An Exploratory Study on Service Dimensions of Regional Shopping Centres: A Segmentation Approach
Jason Sit and Ho Yin Wong, Griffith University Dawn Birch, University of Southern Queensland
Abstract
Despite the advent of e-retailing and other shopping alternatives in the retailing sector, the ‘one-stop’ regional shopping centre remains a popular retail format. ServQual and ServPerf have been used to measure the service quality of individual retail stores on five key dimensions, namely reliability, assurance, tangibles, empathy, and responsiveness. However, these dimensions appear to be less relevant for measuring the performance of the ‘one-stop’ regional shopping centre that comprises a mix of anchors, specialty stores and service outlets. This study revealed a set of eight factors that may better reflect the service dimensions of regional centres, namely personal service, ambulance, amenity, ambience, entertaining service, merchandise mix, access and proximity. Further, this study revealed four distinct shopper segments of regional centres namely, the ‘experiential’ shopper, the ‘serious’ shopper, the ‘apathetic’ shopper, and the ‘service’ shopper.
Introduction
A regional shopping centre is built around one-full line department store, a full-line discount department store, one or more supermarkets and around 100 specialty stores (Property Council of Australia, 1999). This type of shopping centre makes significant contribution to the economy of Australia. For example, in 2000, regional centres recorded an estimated $3.4 billion retail sales and employed approximately 30 000 people in the state of Queensland, Australia (Dimasi and Rutherford, 2001).
Retail Service of Regional Shopping Centres
Service is central to the shopping centre’s marketing mix (Kirkup and Rafiq, 1999; Lovelock, Patterson and Walker, 1998). Indeed, service can be a means of image differentiation for competitive shopping centres (Dennis, Marsland and Cockett, 2001). ServQual and ServPerf have been used to measure the service quality of individual retail stores (such as, specialty stores and department stores) on five key dimensions, namely, responsiveness, assurance, tangibles, empathy and reliability (Dabholkar, Thorpe and Rentz, 1996; Gagliano and Hathcote, 1994). However, these dimensions appear to be less relevant for measuring the service quality of regional shopping centres that comprise a mix of anchors, retail stores and service outlets. That is, the service mix of a regional centre comprises more than behavioural attributes of retail employees (Cronin and Taylor, 1992; Parasuraman, Zeithaml and Berry, 1988). In this study alternative measures of service performance were explored. Moreover, few studies have explored the service dimension as a means of identifying distinct market segments of shopping centres. Hence, the objectives of this study are twofold. First, this study aims to identify the service dimensions of regional centres. Second, based on the service dimensions, the study aims to identify the service-oriented segments of regional centres.
Based on the retailing literature together with the preliminary investigations, four dimensions for measuring the service performance of regional shopping centres were identified, namely, personal services, atmospherics, retail mix, and accessibility. Based on focus group discussions and the literature, a pool of 31 items were generated to operationalise these dimensions. Next, a questionnaire was developed to measure those items on Likert-type scales. The survey was mailed to 960 households in a regional city in Queensland, Australia. Households were randomly selected using an area sampling technique, and the main shopper in the household was requested to respond (Malhotra, 1983). Two hundred and fifty-one usable questionnaires were returned, representing a 26% response rate.
Results of Data Analysis
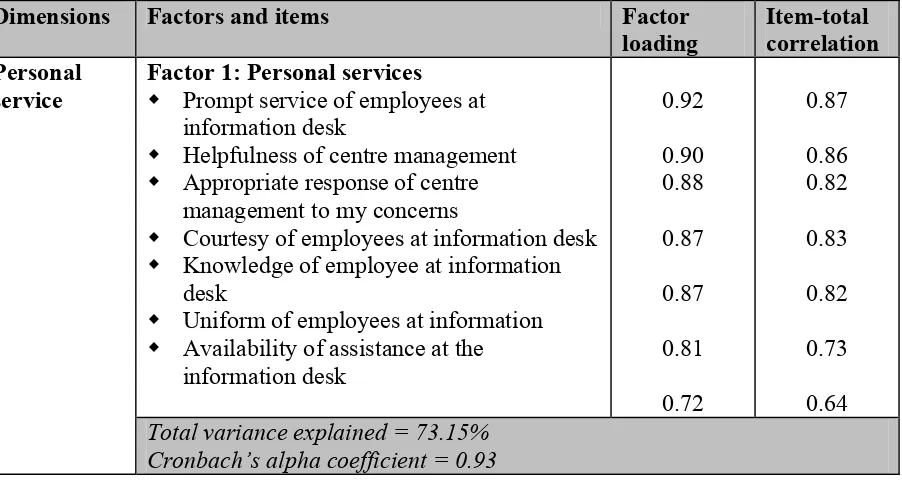
[image:2.595.75.526.485.725.2]Data analysis involved two stages, namely exploratory factor analysis and cluster analysis. In the first stage, the data was subjected to principal components analysis with a varimax rotation. Due to low correlation between the items representing the four dimensions, the items reflecting each of the four dimensions were factor analysed separately revealing eight factors, as summarised in Table 1 (Tabachnick and Fidell, 1989). Only factors with eigenvalues greater than 1.0 were retained. The Kaiser-Meyer-Olkin (KMO) measure of sampling adequacy was rated 0.60 and above, and also Bartlett’s test of sphericity was high and significant (Kaiser, 1958; Norusis, 1993). The second stage of data analysis involved k-means clustering (a non-hierarchical clustering) of regional centre respondents to explore whether distinct groupings of shoppers could be discerned. K-means clustering has been found to be both exceptionally robust and unaffected by data idiosyncrasies (Punj and Stewart, 1983). The cluster analysis was based on the set of eight factors. To determine optimal number of clusters, cluster, 5-cluster, and 6-cluster solutions were performed and examined. The 4-cluster solution was chosen as it produced most meaningful and contrasting segments of shoppers, as summarised in Table 2.
Table 1: Exploratory Factor Analysis for Service Dimensions of Regional Centres
Dimensions Factors and items Factor
loading
Item-total correlation Factor 1: Personal services
Prompt service of employees at information desk
Helpfulness of centre management Appropriate response of centre management to my concerns
Courtesy of employees at information desk Knowledge of employee at information desk
Uniform of employees at information Availability of assistance at the information desk
0.92
0.90 0.88
0.87
0.87
0.81
0.72
0.87
0.86 0.82
0.83
0.82
0.73
0.64 Personal
service
Factor 2: Ambulance Adequate lifts Directory signboards
Brochures on the centres’ facilities Adequate escalators
Well-lit
Variance explained = 45.84% Cronbach’s alpha explained = 0.80
0.74 0.74 0.69 0.68 0.60 0.64 0.57 0.55 0.63 0.61
Factor 3: Amenities
Ease of finding restrooms Clean restrooms
Convenient location of restrooms
Variance explained = 13.44% Cronbach’s alpha explained = 0.92
0.90 0.87 0.84 0.91 0.77 0.86
Factor 4: Ambience Modern décor
Fashionable colour scheme Pleasant background music Air-condition
Variance explained = 8.80% Cronbach’s alpha coefficient = 0.81
0.89 0.85 0.76 0.51 0.76 0.76 0.59 0.46 Atmospheric
Total variance explained = 68.09%
Factor 5: Entertaining services
Occasional entertainment (e.g. fashion shows)
Childcare services Food court
Specific venues for entertainment (eg cinemas)
Variance explained = 39.85% Cronbach’s alpha coefficient = 0.76
0.85 0.75 0.71 0.69 0.65 0.53 0.51 0.54
Factor 6: Merchandise mix Good choice of brands
Stocking of my preferred brands Good range of merchandises
Variance explained = 24.54% Cronbach’s alpha coefficient = 0.80
0.86 0.84 0.83 0.67 0.66 0.65 Retail mix
Total variance explained = 64.39%
Factor 7: Access
Easy to get around within the centre Easy to find the entrances and exists Appropriate trading hours
Variance explained = 42.43% Cronbach’s alpha coefficient = 0.73
0.86 0.83 0.73 0.59 0.62 0.48
Factor 8: Proximity Centre is close to work Centre is close to home
Variance explained = 28.37% Cronbach’s alpha coefficient = 0.72
0.88
0.88 0.56 0.56 Accessibility
Table 2: Clusters of Regional Centre Patrons
Mean scores
Cluster 1 Cluster 2 Cluster 3 Cluster 4 Factors
Experiential Serious Apathetic Service
1. Personal services 3.38 3.13 1.90 3.46
2. Ambulances 3.25 2.72 1.70 3.02
3. Amenities 3.76 3.45 2.17 3.67
4. Ambience 2.83 1.94 1.52 2.67
5. Entertaining services 2.89 1.83 1.36 1.31
6. Merchandise mix 3.61 3.22 2.95 1.94
7. Access 3.50 3.15 2.41 3.06
8. Proximity 2.67 1.26 1.86 1.86
% of membership 40.08 38.89 16.27 4.76
Discussions of Results
The first dimension, personal services, revealed one factor, and thus was labelled ‘personal services’. This factor concerned the attitude of employees and shopping centre management in handling customers’ enquiries. The second dimension, atmospherics, comprised three factors: ambulance (the infrastructure that facilitates the shopper’s navigation within the centre); amenities (the locality and cleanliness of restrooms); and ambience (the centre design). These three factors are also known as the ‘silent salespeople’ that communicate the in-centre quality to the customer (Merrilees and Miller, 2001). Retail mix, the third dimension, comprised two factors including entertaining services and merchandise mix. The entertaining services included food courts, entertainment and childcare services, whereas the merchandise mix comprised the brand mix, merchandise and retail stores. The fourth dimension, accessibility, also comprised two factors, namely access and proximity. Access referred to the ease with which the consumer could navigate within the centre, and proximity emphasised the distance between the centre and the consumer’s place of work and residence.
Service performance dimensions. The first objective of this study was to identify service dimensions of regional centres. The core product of regional centres is the merchandise mix, which is supplemented by facilitating services (personal services, ambulance, amenities, ambience, and access), and supporting services (entertaining services) (Lovelock, Patterson and Walker, 1998). Facilitating services are essential to regional centres in delivering the merchandise to the customer, whereas supporting services add value to the shopping experience (Merrilees and Miller, 1996). For example, escalators and directory signboards (ambulances) facilitate navigation within the regional centre, and thus enable the customer to reach a selected shop (core product) more efficiently. Moreover, during the shopping process, a customer may be impressed by a fashion show (an entertaining service) being held at the centre, which in turn may enhance his or her shopping experience.
personal service, but lesser importance on ambience and entertainment. This segment perceives shopping to be an important ‘mission’, and thus is more concerned with the utilitarian attributes. Further, serious shoppers may be willing to travel longer distances in order to accomplish the mission, as indicated by lesser importance on proximity. Unlike experiential shoppers, the third segment, the ‘apathetic’ shopper reported the lowest ratings on almost all factors. This segment appears to have little intrinsic interest in shopping and may perceive shopping to be a ‘burden’ or a ‘chore’. The fourth segment, the ‘service’ shopper, placed higher importance on personal service and atmospherics (ambulance, amenities and ambience). This segment appears to be concerned with the interactivity at regional centres, through communicating with either ‘real’ retail staff or ‘silent salespeople’ (Merrilees and Miller, 2001, p. 379).
Managerial Implications and Future Research
This exploratory study extends the academic literature on shopping centre marketing by identifying dimensions that more appropriately reflect the service of regional centres than those offered by ServQual and ServPerf. The multiple-item scale developed in this study could be modified to gather benchmark data regarding service quality of shopping centres, and thus allow management to evaluate the strengths and weaknesses of their service areas. This study has indicated the utility of the service dimension as a means for more insightful market segmentation. Specifically, three ‘service-oriented’ segments were identified, namely the ‘experiential’ shopper, the ‘serious’ shopper, and the ‘service’ shopper. The identification of service-oriented segments and their motivations will assist management to address key issues that drive the shopping activity of specific shopping segments, and thus assist with the development of suitable promotional strategies for various segments. For example, in targeting the ‘service’ segment, regional shopping centre management could emphasise that well-trained staff and an inviting atmosphere will enhance the shopper’s interactive experience within the centre.
The findings of this study were confined to regional shopping centres. Further study is required to examine the construct validity and reliability of those factors when applied to other shopping centre categories, such as sub-regional and neighbourhood centres. Moreover, given this study was confined to the perceptions of respondents residing in a rural city in Queensland, Australia, the demographic and behavioural backgrounds of shopper segments may differ across regions.
Conclusion
References
Cronin, J. J., and Taylor, S. A., 1992. Measuring service quality: a re-examination and extension. Journal of Marketing. 56, 55-68.
Dabholkar, P. A., Thorpe, D. I., and Rentz, J. O., 1996. A measure of service quality for retail stores: scale development and validation. Journal of the Academy of Marketing Science. 24(1), 3-16.
Dennis, C., Marsland, D., and Cockett, T., 2001. The mystery of consumer behaviour: market segmentation and shoppers' choices of shopping cenrtes. International Journal of New Product Development & Innovation Management. September/October, 223-239.
Dimasi, T., and Rutherford, D., 2001. Queensland Shopping Centre Industry: Economic Contribution. Melbourne: Jebb Holland Dimasi Australia.
Gagliano, K. B., and Hathcote, J., 1994. Customer expectations and perceptions of service quality in retail apparel specialty stores. Journal of Services Marketing. 8(1), 60-69.
Kaiser, H. F., 1958. The varimax criterion of analytic rotation in factor analysis. Psychometrika, 23, 187-200.
Kirkup, M., and Rafiq, M., 1999. Marketing shopping centres: challenges in the UK context. Journal of Marketing Practice: Applied Marketing Science. 5(5), 119-133.
Lovelock, C., Patterson, P., and Walker, R., 1998. Services Marketing: Australia and New Zealand.Sydney: Prentice Hall Australia.
Malhotra, N., 1983. A threshold model of store choice. Journal of Retailing. 59(2), 3-21.
Merrilees, B., and Miller, D., 1996. Retailing Management: A Best Practice Approach. Melbourne: RMIT Press Australia.
Merrilees, B., and Miller, D., 2001. Superstore interactivity: a new self-service paradigm of retail service?. International Journal of Retail & Distribution Management. 29(8), 379-389.
Norusis, M. J., 1993. Professional Statistics: SPSS for Windows. New York: SPSS Inc United States.
Parasuraman, A., Zeithaml, V. A., and Berry, L. L., 1988. SERVQUAL: a multiple-item scale for measuring consumer perceptions of service quality. Journal of Retailing. 64(1), 12-40.
Property Council of Australia, 1999. Directory of Shopping Centres: New South Wales and Australia Capital Territory 1997/1998. Sydney: Property Council of Australia.
Punj, G., and Stewart, D., 1983. Cluster analysis in marketing research: review and suggestions for application. Journal of Marketing Research. 20, 134-148.