Higher CMM Levels Attained by QA Certified
Software Developers
Aileen Cater-Steel and Edmond Fitzgerald
Department of Information Systems, Faculty of Business
The University of Southern Queensland
Toowoomba, Australia
Abstract
This paper addresses the question: is higher capability maturity associated with adoption of Quality Assurance (QA) certification?
To assess the extent of adoption of third-party QA certification by Australian software developers, a survey of 1,000 software developers was recently conducted. The questionnaire also included an assessment of their capability maturity based on the capability maturity model (CMM). Cynics who criticise the value of QA certification may be surprised by the strong association found between adoption of QA certification and capability maturity.
1 Introduction
Many software projects are plagued by quality problems such as unmet requirements, schedule and budget overruns. Recent examples include the FBI’s abandoned $500 million fingerprint-on-demand system and California’s nonfunctional $1 billion welfare database [23]. Inadequate documentation is one area often suggested as contributing to problems of poor estimates, unmet requirements, project cost over-runs, and ongoing maintenance costs [21]. Dunn and Ullman [14] stress that efficient, consistent and informative documentation must attend all phases of development or the customer requirements may be compromised.
The adoption of QA standards by software developers may result in improvements in documentation and maintenance activities as QA standards place heavy emphasis on documentation at all stages of the systems development life cycle. There has been a recent groundswell of interest in QA certification by many industries because certification can be a source of competitive advantage, especially in international trade involving Europe and Asia [7].
2 Adoption of QA Certification
To achieve ISO 9000 certification, companies must successfully undergo an audit by an accredited third party registrant. A successful registration audit is the culmination of months of planning, training, documenting and reviewing. During the adequacy audit, the company’s quality manual is reviewed by a qualified auditor from an accredited registrant. Then during the compliance audit, the certificate is issued if objective evidence (records, documents, etc.) is found to confirm that the activities of the organisation are in accordance with the quality documentation and the requirements of the relevant standard. The certificate is valid for 3 years conditional on successful annual audits by an accredited registrant.
In recent years, Australian software developers have been committing resources to achieve this certification (to ISO 9001 or AS 3563) in response to government purchasing policies favouring standards-certified suppliers. However, varying perceptions have been reported about the relevance of the ISO 9000 standard to software development. Cynics suggest the ‘piece of paper’ does little to improve the processes and subsequent product [15]. Dromey [13 p.13] claims that ‘... there are plenty of organisations that have costly certified Quality Management Systems but the bottom line is that their software has not shown any marked improvement’.
Recently, as part of this study, Australian software developers were surveyed to determine the extent of QA adoption. Major findings revealed that 11 percent of respondents are certified to ISO 9001 or AS 3563, seven percent are in progress and 21 percent plan to adopt QA certification. They also revealed that specialist developers are adopting QA certification at twice the rate of in-house developers [8]. So it appears that many Australian developers are convinced that certification is worthwhile.
3 The Capability Maturity Concept
1. Initial:
chaotic process
2. Repeatable:
disciplined process
3. Defined:
standard, consistent process
4. Managed:
predictable process
5. Optimising:
continuously improving
[image:3.595.145.492.152.272.2]process
Figure 1 The five levels of the capability maturity model (Source: adapted [17])
This model has been used extensively in the United States and has spawned other assessment methods for example Tick-IT (UK), Bootstrap (Europe), and Trillium (Canada). As well as being required by many prospective procurers, the CMM and its derivatives are valuable as self-assessment tools to highlight strengths and weaknesses in software development practices [16].
As development process maturity is strongly linked to the success or failure of software projects [4], the SEI CMM model has been applied in the USA by many organisations to assess their software processes and recommend improvements. The SEI claims that higher maturity levels are associated with lower risk, higher productivity and higher quality of the software process [19]. There have been many published reports and case studies claiming dramatic improvements from the application of CMM-based software process improvement programs in the United States, for example, Hughes Software Engineering Division, Tinker Airforce Base, Schlumberger, and Raytheon [27].
3.1 Assessment of the SEI Model
Despite CMM’s popularity, there are critics [2, 5, 6, 9, 28]. Although Bollinger and McGowan [5] criticise the evolutionary aspects of the underlying model, Humphrey and Curtis [18] vigorously defend it, claiming the evolutionary improvement approach is based on experiences of fields such as organisational behaviour, quality control and engineering management. Most of the criticism is not focused on the CMM model, but on how Software Capability Evaluations (SCE) are conducted to assess the capability of prospective developers for Defense Department contracts.
3.2 Improvements to the SEI Model
Stage Description
A Reviews and Change Control
B Standard Process and Project Management C Review Management and Configuration Control D Software Process Improvement
E Management of Review and Test Coverages F Analysis of Measurement
[image:4.595.152.474.156.251.2]G Advanced Practices
Table 2 Seven stages of maturity [12]
In recognising that Drehmer and Dekleva’s [12] maturity stage measure may be a more accurate model of maturity evolution than the CMM, their maturity stages were also considered in measuring capability maturity in this study.
3.3 Comparison of ISO 9001 and CMM
With the growing popularity of the CMM and increased adoption of QA certification, researchers and practitioners ask the question, what is the relationship between these two process improvement models? To answer this question, a number of studies have compared the content of the ISO 9001 and CMM [3, 10, 24, 25, 29, 31].
ISO 9001 CMM
Strengths Strengths
Generic standard, wide application Well developed and specifically for software
International support network Applicable to process assessment, capability evaluation and process monitoring
Sets minimum requirements for general quality management systems
Successfully applied by leading software development organisations
ISO 9000-3 provides guidance for software developers
Attracts broad interest from both academia and industry in software sector
Weaknesses Weaknesses Mainly general quality system assurance
standard, not aimed at process assessment
Needs more information and coverage
Does not encourage continuous quality improvement
Needs to be more flexible and scaled
Lacks assessment guidance based on maturity levels
Designed for large business orientation
Oriented to organisation rather than project Some requirements (e.g. peer reviews and vendor assessments) are costly to implement.
[image:4.595.146.489.427.656.2]Table 1 compares the strengths and weaknesses of ISO 9001 and the CMM. The general consensus from these studies is that certification to ISO 9001 is equivalent to CMM level two with some CMM level three practices, however Paulk [25] concedes that an organisation could be certified to ISO 9001 but assessed at CMM level one.
Although the content of these models has been compared, to our knowledge there has not been any empirical research to compare QA certification adoption with capability maturity levels. This research undertook that comparison by testing the hypothesis that capability maturity will be positively associated with adoption of QA certification.
4 Research Design
4.1 Research Questions
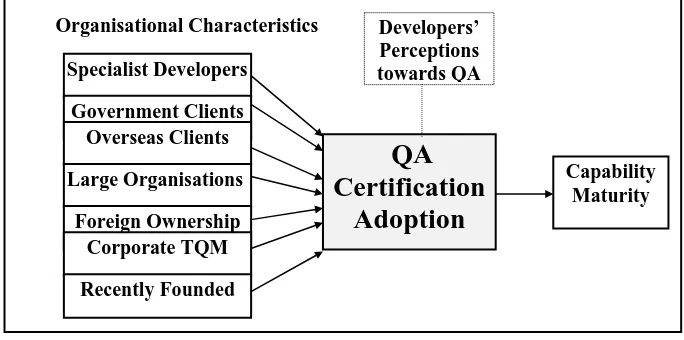
The overall purpose of the study was to investigate the extent of adoption of QA certification, organisational characteristics of adopters, the capability maturity of Australian software developers, and their perceptions regarding certification costs and benefits.
Organisational Characteristics
QA
Certification
Adoption
Developers’ Perceptions towards QA Specialist Developers
Government Clients Overseas Clients
Large Organisations
Foreign Ownership Corporate TQM
Capability Maturity
[image:5.595.148.490.394.564.2]Recently Founded
Figure 2 Research Model
As depicted in figure 2, the study addressed the following four research questions: (i) What is the extent of adoption of third-party certified QA standards by the Australian software development industry?
(ii) Do QA certified developers exhibit common organisational characteristics?
(iii) Is higher capability maturity associated with adoption of QA certification?
As it was not possible to report all the findings within the constraints of this paper, it focuses on reporting the association between capability maturity and adoption of QA certification (ie. research question iii).
4.2 Survey Design
A questionnaire was designed and then pilot tested in two stages with suggested modifications from the first stage incorporated for the second stage of testing. The questionnaire included 12 demographic questions, 5 questions relating to QA certification progress, 13 statements probing developers perceptions regarding the value of QA certification and government QA policy and 33 questions (based on the SEI maturity questionnaire) to determine software engineering practices. The next section details the formulation of the CMM section of the questionnaire as it is the focus of this paper.
Capability maturity questions
In 1991, the SEI published the ‘Capability Maturity Model for Software’ [26]. This document included a questionnaire - ‘Preliminary Version of Maturity Questionnaire’ - which was based on the original 1987 questionnaire of Humphrey and Sweet [20]. The Preliminary Version questionnaire contained 110 questions relating to software engineering practices to enable assessors to make a preliminary assessment of software engineering maturity levels. Of the 110 questions, 42 were designated as ‘key’ questions. These ‘key’ questions were used as the starting point for the CMM section of the questionnaire as they had formed the basis of the CMM survey conducted by Drehmer and Dekleva [12] and were included by Arthur [1] as a quick assessment method. Ko [22] used 22 of the questions from Arthur’s adaptation to determine the CMM levels of software developers in Hong Kong.
The latest version of the CMM questionnaire [34] contains 124 questions but was not used in this survey for three reasons:
• there are no designated ‘key’ questions and the length of the complete instrument would deter time-conscious respondents;
• if the new questionnaire was used, it would be difficult to compare the results of this study with earlier studies [e.g. 12, 22];
• there has been little research reported to provide validation of the new questionnaire.
The question of what scale to use was then considered. A two point ‘yes/no’ scale was used in the Preliminary Version Questionnaire [26], Arthur’s [1] quick assessment and Ko’s [22] survey. Drehmer and Dekleva [12] also used a two point scale: ‘endorsed/not endorsed’. The current version of the SEI questionnaire [34] uses a four point scale; 'yes, no, does not apply, don’t know'. Recognising that this instrument would be used to assess practices at an organisational, rather than project level, and that an organisation may enforce different levels of rigour for different projects, it was decided to allow respondents to indicate that practices may be in use for some projects, or for all projects. Thus, a four point scale was used: ‘for all projects, for some projects, no/not applicable, don’t know’. This enabled the results of this survey to be compared with others, but valuable additional information was also gained about the assimilation of these software engineering practices within organisations.
4.3 Sample Selection
The target population was all organisations in Australia which develop software for sale (specialist developers) or for their own use (in-house developers). Firstly, all specialist Australian software developers were extracted from the ‘Oz on Disc’ Yellow Pages Database. From the total population of approximately 4,000 software developers, a random sample of 500 was selected. To ensure in-house developers were adequately represented in the study, a random sample of 500 was drawn from the MIS 3001 database which contains details of the 3,500 largest users of IT in Australia. A total of 288 useable responses was received.
5 Determining Capability Maturity
In considering capability maturity, three measures were employed: firstly a ‘raw’ capability score was calculated; then the CMM level was determined; finally, answers to the CMM-based questions were grouped to assess the Drehmer and Dekleva [12] stage model.
5.1 ‘Raw’ Capability Score
An assessment of respondents’ capability maturity was determined from their answers to the 33 software engineering practices questions adapted from the SEI maturity questionnaire. A ‘raw’ capability score was calculated by assigning a value of two for each practice applied to all projects, one if applied to some
0 5 10 15
0 3 7
[image:8.595.147.496.152.286.2]10 13 16 19 22 25 28 31 34 37 40 43 46 49 52 55 60 66
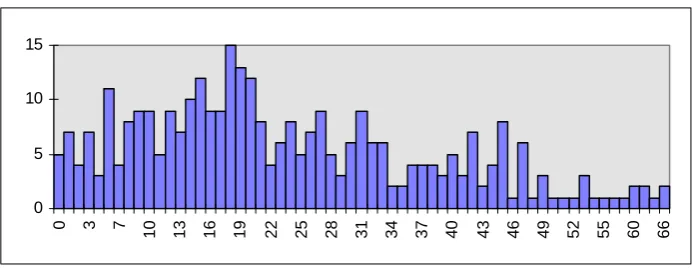
[image:8.595.149.483.391.476.2]Figure 3 Distribution of raw capability maturity scores
Table 3 reveals that the mean rank of the raw capability maturity score is highest in organisations that are certified, decreasing through the ‘in progress’ organisations, and those planning certification, down to those with no plans for certification. The mean rank of capability maturity score of certified organisations (218) is almost double that of the organisations with no plans to adopt QA certification (118).
CERTIFICATION STATUS Raw Capability Maturity Score
ISO 9001 or AS 3563 N Mean Rank
No Plans 178 118.90
Planned 59 171.97
In Progress 20 176.52
Certified 31 218.55
Kruskal-Wallis chi-square =50.7427, d.f.=3, p<0.001
Table 3 Comparison of certification status with the mean rank of the raw capability maturity score
This suggests that either mature organisations are adopting QA, or, right from the planning stage, capability maturity is increasing, perhaps because recognised software engineering processes are implemented as part of the QA certification process.
5.2 CMM Levels
process closely follows that advocated by Humphrey and Sweet [20], who advised the use of 90 percent hurdles to be applied on all prior level ‘key’ questions.
Firstly, the points for the questions relating to level-two practices were summed. Respondents scoring less than eight of the nine maximum points were given a CMM level of one. Next, all values for level-two and level-three questions of respondents who successfully passed the first hurdle were summed. Respondents scoring less than 18 of the 20 maximum points exited the test with a CMM level of two. Finally, all values for level-two, level-three and level-four questions of respondents who successfully passed the second hurdle were summed. Respondents scoring less than 28 of the 32 maximum points exited the test with a CMM level of three. Successful respondents were allocated CMM level four. As mentioned earlier, CMM level-five questions were not included in the instrument.
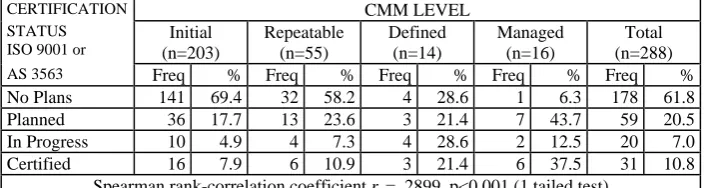
The ordinal variable ‘CMM level’ was cross-tabulated against certification status (table 4), and the Spearman-rank correlation coefficient calculation confirmed a very significant association between the CMM levels and certification status.
CERTIFICATION CMM LEVEL
STATUS ISO 9001 or
Initial (n=203)
Repeatable (n=55)
Defined (n=14)
Managed (n=16)
Total (n=288)
AS 3563 Freq % Freq % Freq % Freq % Freq %
No Plans 141 69.4 32 58.2 4 28.6 1 6.3 178 61.8 Planned 36 17.7 13 23.6 3 21.4 7 43.7 59 20.5 In Progress 10 4.9 4 7.3 4 28.6 2 12.5 20 7.0 Certified 16 7.9 6 10.9 3 21.4 6 37.5 31 10.8
[image:9.595.144.498.364.458.2]Spearman rank-correlation coefficient rs = .2899, p<0.001 (1 tailed test)
Table 4 Certification status by CMM level – frequencies and percentages
5.3 Maturity Stages
Stage Description Percentage of Stage Completed
A Reviews and Change Control 87.50 B Standard Process and Project Management 71.43 C Review Management and Configuration Control 75.00 D Software Process Improvement 87.50 E Management of Review and Test Coverages 83.33
F Analysis of Measurement 25.00
[image:10.595.149.484.168.276.2]G Advanced Practices 16.67
Table 5 Typical stage completion profile for one respondent
When the median of the percentage completion for each stage was cross-tabulated against certification status (table 6), QA certified organisations had a higher proportion of stages completed, compared to those in the process of adopting certification, which in turn were higher than the ‘planning’ and ‘no plans’ organisations.
Stage Description No Plans Planned In Progress
Certified
A Reviews and Change Control 50.00 75.00 68.75 87.50 B Standard Process and Project
Management
35.71 50.00 64.29 71.43
C Review Management and Configuration Control
33.35 50.00 50.00 66.67
D Software Process Improvement 25.00 37.50 37.50 62.50 E Management of Review and
Test Coverages
16.67 *16.67 33.33 50.00
F Analysis of Measurement 12.50 25.00 25.00 *25.00 G Advanced Practices 0.00 8.33 16.67 33.33
Table 6 Cross-tabulation of certification by median of stage percentage completion
Generally, Drehmer and Dekleva’s [12] stage model is supported by the data from this survey. There are only two instances (noted by * in table 6) where the median of subsequent stages is higher than the median of the previous stage.
6 Discussion
[image:10.595.150.488.379.506.2]in capability maturity from low capability maturity in organisations with no QA plans, increasing through the ‘planned’ and ‘in progress’ groups to a high mean capability score in the group of certified organisations. This implies that process improvement commences from the planning stage when management commits to QA, and that more advanced software engineering practices are progressively adopted and implemented throughout the process of achieving QA certification.
A comparison of CMM levels in Australia with Hong Kong revealed the proportion of organisations at level one (initial) is similar in Australia and Hong Kong [22], nearly twice as many Hong Kong developers are at level two, but considerably more Australian developers are using level-three practices compared to their Hong Kong counterparts. The maturity of Singapore [30] and Australian developers is similar, with more Singapore specialists (vendors) and private sector developers at the higher levels, but Australian government organisations generally higher than the Singapore government developers [8].
Turning now to the Drehmer and Dekleva [12] stage model, based on our study’s data, as can be seen in table 7, the respondent population averages 61 percent completion of the stage A activities - reviews and change control. This drops to just under 46 percent for the next stage, standard process and project management. The mean completion percent continues to decrease through the subsequent stages, with the mean completion percent for the final stage - advanced practices - at only 15 percent.
Maturity Stage
Description of Stage Mean
Completion Percent
A Reviews and Change Control 61.04
B Standard Process and Project Management 45.71 C Review Management and Configuration Control 43.07 D Software Process Improvement 36.35 E Management of Review and Test Coverages 26.74
F Analysis of Measurement 21.23
[image:11.595.148.480.432.552.2]G Advanced Practices 15.29
Table 7 Mean of completion percentages for each maturity stage
7 Conclusion
The results from this study, while unable to establish cause and effect relationships between QA certification and capability maturity, demonstrate that they are associated. Although some certified organisations do not use advanced software engineering practices, generally, progress towards certification is associated with capability maturity.
Organisations pressured to invest in QA certification to maintain competitive advantage may be surprised to find that it is the source of genuine software process improvement. Software clients may also take heart from our findings that show by dealing with certified developers some level of assurance is in fact provided. However, other things such as project risk and costs and developer reputation and expertise also need to be considered.
Finally, this study provided empirical evidence confirming that the Drehmer and Dekleva [12] model depicts a ‘real world’ evolutionary model of how organisations proceed through stages of maturity from reviews and change control to advanced practices.
References
[1] Arthur, L.J. 1993, Improving Software Quality: An Insider's Guide to TQM,
Wiley.
[2] Bach, J. 1994, 'The Immaturity of the CMM', American Programmer, vol. 7, 9, pp. 13-8.
[3] Bamford, R.C. & Deibler, W.J. 1993, 'Comparing, Contrasting ISO 9001 and the SEI Capability Maturity Model', Computer, October, pp. 68-70.
[4] Billings, C., Clifton J., Kolkhorst, B., Lee, E., & Wingert, W.B. 1994, 'Journey to a Mature Software Process', IBM Systems Journal, vol. 33, no. 1, pp. 46-61. [5] Bollinger, T.B. & McGowan, C. 1991, 'A Critical Look at Software Capability Evaluations', IEEE Software, July, pp. 25-41.
[6] Brodman, J.G. & Johnson, D.L. 1994, 'What Small Businesses and Small Organisations Say About the CMM', Proc.16th Int. Conf. on Software Engineering, May, pp. 331-40.
[7] Brown, S. 1994, 'Now It Can Be Told', Sales and Marketing Management, November, pp. 34, 38.
[8] Cater-Steel, A.P. & Fitzgerald, E.P. 1997, Quality Assurance Certification: Adoption by Australian Software Developers and its Association with Capability Maturity, Proc APSEC & ICSC, Hong Kong pp. 11-23.
Software, Jan, pp. 98-100.
[11]Davis, C.J., Thompson, J.B., Smith, P., & Gillies, A. 1992, 'A Survey of Approaches to Software Quality within the United Kingdom', Occasional Paper, University of Sunderland, vol. 92, no. 5, pp. 1-74.
[12]Drehmer, D. & Dekleva, S. 1993, 'Measuring Software Engineering Maturity: a Rasch Calibration', Proc.ICIS, Dec, pp. 191-201.
[13]Dromey, R.G. 1995, 'Software Quality and Productivity Improvement', in
Software Quality and Productivity: Theory, practice, education and training, Eds. Lee et al., Chapman & Hall.
[14]Dunn, R.H. & Ullman, R.S. 1994, TQM for Computer Software, McGraw-Hill,
NY.
[15]Gome, A. 1995, 'ISO 9000 'Inappropriate for Small Business'', Business Review Weekly, 13 Mar, p. 52.
[16]Herbsleb, J.D. & Goldenson, D.R. 1996, 'A Systematic Survey of CMM Experience and Results', Proc 18th Int Conf Software Engineering Berlin, IEEE Computer Society Press, Los Alamitos, CA, pp. 323-30.
[17]Humphrey, W.S. 1988, 'Characterizing the Software Process: A Maturity Framework', IEEE Software, March, pp. 73-9.
[18]Humphrey, W.S. & Curtis, W. 1991, 'Comments on 'A Critical Look'', IEEE Software, July, pp. 42-6.
[19]Humphrey, W.S., Kitson, D.H., & Kasse, T.C. 1989, The State of Software Engineering Practice: A Preliminary Report, SEI.
[20]Humphrey, W.S. & Sweet, W.L. 1987, A Method for Assessing the Software Engineering Capability of Contractors, SEI Carnegie Mellon University, Pittsburgh, Penns.
[21]Kendall, P.A. 1996, Introduction to Systems Analysis & Design, Irwin,
Chicago.
[22]Ko, R. 1995, 'Status and Approaches of Software Process Improvement in Hong Kong', Proc. of 2nd Int. SPICE Symposium, June, pp. 141-4.
[23]Neumann, P.G. 1997, ‘System Development Woes’, Communications of the ACM, vol. 40, no. 12, p. 160.
[24]Paulk, M.C. 1993, 'Comparing ISO 9001 and the Capability Maturity Model for Software', Software Quality Journal, vol. 2, pp. 245-56.
[25]--- 1995, 'How ISO 9000 Compares With the CMM', IEEE Software, Jan, pp. 74-83.
[26]Paulk, M.C., Curtis, W., & Chrissis, M.B. 1991, Capability Maturity Model for Software, SEI CMU.
Maturity Model: Guidelines for Improving the Software Process, Addison-Wesley,
Reading, MA.
[28]Saiedian, H. & Kuzara, R. 1995, 'SEI Capability Maturity Model's Impact on Contractors', IEEE Computer, vol. 28, no. 1, pp. 16-26.
[29]Saiedian, H. & McClanahan, L.M. 1996, 'Frameworks for Quality Software Process: SEI Capability Maturity Model Versus ISO 9000', Software Quality Journal, vol. 5, no. 1, pp. 1-23.
[30]Tan, M. & Yap, C.Y. 1995, 'Impact of Organisational Maturity on Software Quality', in Software Quality and Productivity: Theory Practice, education and training, Eds. Lee et al., Chapman & Hall for IFIP, London, pp. 231-4.
[31]Wang, Y., He, Z., Ross M, Staples, G., & Court, I. 1996, 'Quantitative Analysis and Mutual Mapping Between ISO 9001 and CMM', in 1st Int. Conf. on ISO 9000 & TQM, pp. 83-90.
[32]BIGSTEPS: Rasch Analysis for ALL Two -Facet Models, 1992 Wright, B. D., & Linacre, J. M.: University of Chicago, Mesa Press Psychometric Laboratory. [33]Zahedi, F. 1995, Quality Information Systems, Boyd & Fraser, Mass.
![Figure 1 The five levels of the capability maturity model (Source: adapted [17])](https://thumb-us.123doks.com/thumbv2/123dok_us/362701.67513/3.595.145.492.152.272/figure-levels-capability-maturity-model-source-adapted.webp)
![Table 2 Seven stages of maturity [12]](https://thumb-us.123doks.com/thumbv2/123dok_us/362701.67513/4.595.146.489.427.656/table-seven-stages-maturity.webp)
![Table 6 Cross-tabulation of certification by median of stage percentage completion Generally, Drehmer and Dekleva’s [12] stage model is supported by the data from](https://thumb-us.123doks.com/thumbv2/123dok_us/362701.67513/10.595.149.484.168.276/tabulation-certification-percentage-completion-generally-drehmer-dekleva-supported.webp)

