A non-contact, thermal noise based method for the calibration of lateral deflection
sensitivity in atomic force microscopy
Nic Mullin and Jamie K. Hobbs
Citation: Review of Scientific Instruments 85, 113703 (2014); doi: 10.1063/1.4901221 View online: http://dx.doi.org/10.1063/1.4901221
View Table of Contents: http://scitation.aip.org/content/aip/journal/rsi/85/11?ver=pdfcov Published by the AIP Publishing
Articles you may be interested in
Effect of cantilever geometry on the optical lever sensitivities and thermal noise method of the atomic force microscope
Rev. Sci. Instrum. 85, 113702 (2014); 10.1063/1.4900864
Note: Curve fit models for atomic force microscopy cantilever calibration in water Rev. Sci. Instrum. 82, 116107 (2011); 10.1063/1.3661130
A method for atomic force microscopy cantilever stiffness calibration under heavy fluid loading Rev. Sci. Instrum. 80, 125103 (2009); 10.1063/1.3263907
Accurate noncontact calibration of colloidal probe sensitivities in atomic force microscopy Rev. Sci. Instrum. 80, 065107 (2009); 10.1063/1.3152335
A non-contact, thermal noise based method for the calibration of lateral
deflection sensitivity in atomic force microscopy
Nic Mullina)and Jamie K. Hobbs
Department of Physics and Astronomy, University of Sheffield, The Hicks Building, Hounsfield Road, Sheffield S37RH, United Kingdom
(Received 14 April 2014; accepted 27 October 2014; published online 19 November 2014)
Calibration of lateral forces and displacements has been a long standing problem in lateral force microscopies. Recently, it was shown by Wagneret al.that the thermal noise spectrum of the first tor-sional mode may be used to calibrate the deflection sensitivity of the detector. This method is quick, non-destructive and may be performedin situin air or liquid. Here we make a full quantitative com-parison of the lateral inverse optical lever sensitivity obtained by the lateral thermal noise method and the shape independent method developed by Andersonet al.We find that the thermal method provides accurate results for a wide variety of rectangular cantilevers, provided that the geometry of the can-tilever is suitable for torsional stiffness calibration by the torsional Sader method, in-plane bending of the cantilever may be eliminated or accounted for and that any scaling of the lateral deflection signal between the measurement of the lateral thermal noise and the measurement of the lateral deflection is eliminated or corrected for. We also demonstrate that the thermal method may be used to characterize the linearity of the detector signal as a function of position, and find a deviation of less than 8% for the instrument used.© 2014 Author(s). All article content, except where otherwise noted, is licensed under a Creative Commons Attribution 3.0 Unported License.[http://dx.doi.org/10.1063/1.4901221]
I. INTRODUCTION
Atomic Force Microscopy (AFM)1is a widely used
sur-face characterization technique that allows both imaging and measurement of tip-surface forces by monitoring the deflec-tion of a flexible cantilever. In general, flexural bending of the cantilever allows the measurement of forces perpendicu-lar to the sample surface,2and torsional bending (twist of the cantilever about its long axis) allows forces in the plane of the sample (such as friction) to be measured.3In the vast
ma-jority of instruments, cantilever deflection is measured by the optical lever technique.4 This gives an output in volts; hence
it is necessary to calibrate the measured cantilever deflection signal into units of force if quantitative data are required.
For flexural cantilever bending, this is usually achieved via a straightforward two-stage process. The deflection sig-nal is calibrated into spatial units by performing an approach curve onto a non-compliant surface. The inverse gradient of the contact region of this curve gives the Inverse Optical Lever Sensitivity (InvOLS) in nanometres of tip displacement per volt of detector signal. The force constant of the cantilever may be calibrated by any one of a variety of methods, with the thermal noise,5 Sader,6 reference spring,7 and added mass8 methods being the most widely used. The deflection voltage may then be multiplied by the InvOLS and the force constant to calculate the force.
In the torsional case, the situation is more complicated. Due to the size and geometry of the cantilever and tip, it is not straightforward to apply a well-defined lateral force or displacement at the tip apex. For this reason, a wide variety of
a)Author to whom correspondence should be addressed. Electronic mail:
methods to calibrate lateral forces have emerged. These have recently been reviewed in Ref.9. The majority of these meth-ods are ex situ, often require dedicated equipment, are fre-quently time consuming and typically require hard mechani-cal contact with a surface, leading to tip damage or contam-ination. While the torsional Sader method10provides a quick and simple means to determine the torque constant of the can-tilever and requires only the plan-view dimensions, the reso-nant frequency and quality factor of the fundamental torsional mode, determination of the lateral InvOLS is problematic, and
ex situmethods requiring special equipment are often used. Recently, Wagner and co-workers11published a two-step
method that allows the lateral InvOLS to be determined from the torsional thermal noise spectrum of the cantilever and the torsional torque constant, as measured by the torsional Sader method. This represents a significant advance, in that it al-lowsin situcalibration of lateral forces using only a thermal noise spectrum and the dimensions of the cantilever, with no requirement for hard contact with the surface or special equip-ment. The thermal method was also found to give reasonable results in liquid, which has proved difficult for many other lateral calibration methods, and is usually accomplished by
ex situcalibration in air combined with an analytically deter-mined correction factor to account for the altered detection beam path in liquid.12,13 Comparison of the thermal method
with the well-established wedge method14showed qualitative
agreement with significant deviations.11 By contrast, other
lateral calibration methods have shown strong quantitative agreement when compared with established techniques.15–17
In the work presented here, we experimentally validate the thermal method developed by Wagner et al.11 by
com-paring it to the shape independent method developed by Anderson et al.18 for a selection of rectangular cantilevers
0034-6748/2014/85(11)/113703/9 85, 113703-1 © Author(s) 2014
113703-2 N. Mullin and J. K. Hobbs Rev. Sci. Instrum.85, 113703 (2014)
commonly used for lateral force experiments including Lat-eral Force Microscopy3 (LFM), Torsional Resonance19 (TR)
mode, and lateral force modulation20 techniques. We find
good quantitative agreement between the two methods, as long as the cantilever geometry is suitable for calibration by the torsional Sader method, that in-plane bending of the can-tilever is accounted for and that it is ensured that there is no scaling of the lateral signal between the channel used for ther-mal noise calibration and the lateral deflection signal recorded in the AFM software.
II. THEORY
The basis of all thermal noise calibration techniques2 is
the equipartition theorem. This states that, for an oscillator with one degree of freedom:
1 2kBT =
1 2kx
2, (1)
wherekB is Boltzmann’s constant,Tis the absolute temper-ature in kelvin,kis the force constant in newtons per metre andx2is the mean-square displacement from equilibrium in metres. For the case of a point mass executing torsional oscil-lation, the equivalent expression is
1 2kBT =
1 2kϕϕ
2, (2)
where kϕ is the torsional torque constant in newton-metres per radian andϕ2is the mean-square angular displacement in radians.
The experimental observable in AFM is the deflection voltage calculated from the position of a laser beam, reflected from the upper surface of the cantilever, on a split photodi-ode. The displacement of the laser beam is proportional to the angle of the upper surface of the cantilever and the voltage is proportional to the displacement of the beam. Hence the tor-sion angle of the cantilever is related to the lateral deflection voltage by
ϕ =γ V , (3)
whereγ is the angular InvOLS in radians per volt and V is the lateral deflection voltage. Substituting Eq.(3)into Eq.(2)
and rearranging forγ leads to
γ =
kBT
kϕV2. (4)
Hence if the mean-square lateral deflection voltage fluc-tuation due to Brownian motion of the cantilever can be mea-sured, and the torsional torque constant is known, the angular InvOLS may be calculated. A similar approach has previously been used for calibration of the flexural InvOLS.21,22
To ensure that only voltage fluctuations due to the ther-mal motion of cantilever are recorded, it is common practice to Fourier transform the deflection voltage and fit the resulting resonant peak in frequency space.5The total observed Power
Spectral Density (PSD) of the cantilever deflection signal is
P(f), where
P(f)=S(f)+Pwhite, (5)
Pwhite is the frequency independent background noise of the detection system andS(f) is the PSD of a damped harmonic oscillator driven by white noise, given by6,21,23,24
S(f)= PDCf
4 0
f2−f2 0
2
+f2f2 0
Q2
. (6)
Here,PDC is the PSD of the oscillator at DC,f is fre-quency in Hz, f0 is the resonant frequency of the cantilever in Hz, andQis the quality factor. Integrating Eq.(6)over all frequencies to give the total voltage noise power gives23
V2 =
∞
0
S(f)df = πf0PDCQ
2 . (7)
Inserting Eq.(7)into Eq.(4)gives
γ =
2kBT
π kϕf0PDCQ, (8)
for the angular InvOLS. To convert the angular InvOLS into spatial units, the displacement of the tip about the torsion axis is considered to follow an arc that subtends the torsion angle of the cantilever at a radiush. This gives
γtors =h
2kBT
π kϕf0PDCQ, (9)
whereγtorsis the InvOLS in units of metres of tip movement per volt of lateral deflection and his the tip height, defined as the perpendicular distance of the tip apex from the torsion axis of the cantilever, which is assumed to lie halfway through its thickness.
III. EXPERIMENTAL METHOD
A. AFM and cantilevers
Below we describe the measurements carried out to ob-tainγtorsby both the thermal noise method11and the shape in-dependent method.18 These measurements were repeated for 8 different cantilevers, 4 made from single crystal silicon (All In One (AIO) probes, with aluminium back side coating, Bud-getSensors, Bulgaria) and 4 made from silicon nitride with a gold back side coating (OMCL-RC800, Olympus, Japan also referred to as “ORC-8” by some suppliers). Cantilevers of each type are designated as A, B, C, and D, following the manufacturer’s convention.
These cantilevers cover a range of resonant frequencies and force constants, including the typical values used for LFM,3 lateral force modulation,20and TR-mode19 AFM. All
cantilevers used here have an approximately rectangular ge-ometry, although the silicon cantilevers have bevelled edges and tapered free ends. The length, width, thickness, distance of the tip apex from the torsion axis and the set-back of the tip from the end of the cantilever beam were measured using a scanning electron microscope (Philips XL30 FEGSEM).
collection of the lateral thermal noise spectrum up to frequen-cies of 3.75 MHz via a high-speed analog-to-digital converter already present in the system. For this experiment, low de-tection noise is not typically required due to the high Q of the torsional resonance and the low InvOLS value making the resonant peak easily detectable above the noise floor. How-ever, the ability to record the torsional thermal noise in soft-ware considerably simplifies the experiment. While the lat-eral deflection signal may be accessed from hardware in many commercially available AFMs, it is often scaled relative to the software value of the lateral deflection collected during LFM scanning.25 It must be emphasized that if this scaling factor
is not either eliminated or explicitly corrected for in the cal-ibration procedure, the thermal method will yield erroneous results.
B. Shape independent method
The shape independent method18 of Anderson et al.
works by scanning a sample which contains features at a va-riety of angles to the surface normal (glass pipettes were used in Ref.18). By assuming Amontons’ Law for friction and re-solving the forces acting on the cantilever, it is possible to calculate the lateral force applied at the tip from the normal load, adhesion, angle of repose of the cantilever, and the sur-face topography. The slope of a plot of calculated lateral force against the measured lateral deflection then gives the lateral calibration factor in newtons per volt.
The sample for the shape independent method was pre-pared by pulling quartz fibres (mean diameter 13μm) from a woven sample (J. P. Stevens, USA) using tweezers. The fibres were cleaned in 37% hydrochloric acid (Sigma Aldrich, UK) and sonicated in de-ionized water (Sigma Aldrich, UK) five times. The fibres were dried in low vacuum at room temper-ature overnight. To immobilize the fibres, a thin film of Nor-land Optical Adhesive NOA81 (NorNor-land Products Inc., USA) was spin coated onto a glass coverslip. A cleaned fibre was then placed onto the surface of the adhesive film before curing the adhesive using a UV light source. Capillary action caused the adhesive to wet the fibre and wick up around its edges, but the film was sufficiently thin that a portion of exposed quartz with a hemi-cylindrical profile remained exposed at the sur-face. Calibration scans were performed exclusively on the ex-posed quartz areas. A large area AFM image showing the fibre and the surrounding substrate is shown in Figure1.
[image:4.612.367.511.53.165.2]Before scanning, care was taken to ensure that the can-tilever long axis was parallel to the fibre long axis, and per-pendicular to the fast scan axis of the AFM. The detection laser was positioned onto the free end of the cantilever, which was not necessarily the position of maximum photodiode sum signal. The instrument was shut into a home built vibration and acoustic isolation hood. No further adjustments to the po-sition of the laser spot on the cantilever or the popo-sition of the photodetector were made after this point. The instrument was then allowed to settle while the vertical deflection of the can-tilever was monitored. Once the drift in the vertical deflection had reached a value lower than 10% of the relative setpoint voltage over the time required to take a calibration scan, the
FIG. 1. 3D rendering of an AFM height image of the sample used for the shape independent lateral calibration. The scan size is 10μm and the height scale is 1.2μm. The image has been line flattened to first order along the direction perpendicular to the fibre axis.
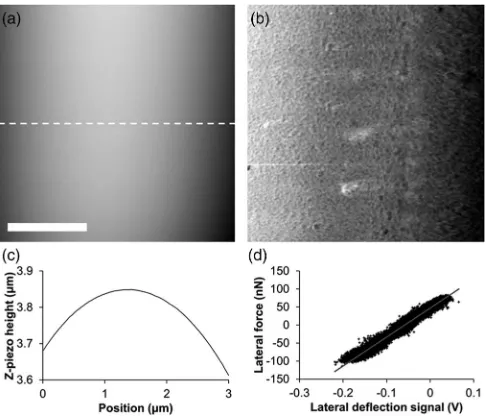
cantilever under test was engaged onto the surface of the fi-bre and a 3×3μm scan of 256×256 pixels was taken at a line rate of 1 Hz. A 10% “overscan” was used; excluding the “sticking” portion of the friction force loop, correspond-ing to the need to overcome static friction at the turnaround of the fast scan axis, from the measurement. The 3×3μm scan on the 13μm diameter fibres gave access to±∼13◦ of sample slope. A typical calibration scan, showing the height and lateral deflection signals, is shown in Figure2.
The deflection setpoint and values of the vertical deflec-tion before engaging and immediately after retracting from the surface on completion of the scan were recorded. The raw, unmodified height (measured) (the Z-piezo capacitive sensor signal); vertical deflection (feedback error signal), and lateral deflection signal images were saved in both trace and retrace directions. Following image capture, approach curves were taken at 10 points along the fibre axis, and the mean value of the adhesion calculated. The sample was then moved so that
FIG. 2. (a) AFM height image of the scan used for calibration of AIO can-tilever B. The scale bar represents 1μm and the greyscale corresponds to 400 nm. (b) Corresponding lateral deflection image in the trace direction. The greyscale is 246.3 mV. (c) Cross section through image (a) along the dashed white line. (d) Calibration plot for AIO cantilever B, as output from the shape independent lateral calibration software developed in Ref.18. All images are raw data with no levelling applied.
[image:4.612.317.560.471.679.2]113703-4 N. Mullin and J. K. Hobbs Rev. Sci. Instrum.85, 113703 (2014)
an area of clean, flat glass slide was below the cantilever. The cantilever was engaged onto this area, a further 10 approach curves were recorded and the mean value of the flexural In-vOLS calculated from these. All approach curves were ac-quired with closed loop scanning in the Z direction activated.
C. Thermal method
Immediately following the shape independent calibra-tion, the cantilever was retracted 500μm from the surface (to ensure that no long range forces, squeeze damping etc. were influencing the cantilever) and thermal noise spectra were recorded for both the vertical and lateral deflection channels. We found minimal crosstalk between the vertical and lateral channels, allowing straightforward identification of the first torsional mode. The sampling rate for the lateral channel was 60 MHz, decimated by a factor of 8 to give a sampling rate of 7.5 MHz and a Nyquist frequency of 3.75 MHz. The resonant frequencies of the first torsional modes of the cantilevers tested here were all significantly below the Nyquist frequency. Thermal noise was acquired in 100 ms non-overlapping blocks and each spectrum was averaged over one minute; hence each spectrum is the average of 600 indi-vidual PSDs. No windowing (i.e., a rectangular window) was used. It was verified for all cantilevers that the above param-eters cause minimal spectral distortion due to finite sampling rate.26 A typical lateral thermal noise spectrum for the first torsional mode of AIO cantilever B is shown in Figure3.
D. Calibration in water
When calibrating in water, a similar procedure to that described above was followed. The torsional Sader method requires the quality factor to be much greater than unity10
[image:5.612.329.546.52.162.2]and the Q of the cantilever is substantially reduced in liquid. We found that repeats of the torsional Sader method in air (Q∼500) gave results that were repeatable to<1%. When the same cantilever was immersed in water (Q ∼ 8.5) the torsional Sader method consistently returned results approxi-mately 10% larger than the value in air. In order to negate this effect, a thermal noise spectrum of the torsional mode of the cantilever was recorded in air and the torsional torque con-stant calculated from this. A drop of de-ionised water (Sigma Aldrich, UK) was then pipetted onto the cantilever and sam-ple, the laser realigned and the shape-independent and thermal
[image:5.612.64.287.614.720.2]FIG. 3. Lateral thermal noise spectrum for the first torsional mode of AIO cantilever B. The raw data are shown in black and the fit to Eq.(5)is overlaid in grey.
FIG. 4. Lateral thermal noise spectrum for the first torsional mode of AIO cantilever B in liquid. The raw data are shown in black and the fit to Eq.(5) is overlaid in grey.
InvOLS calibration experiments (which do not require large Q for accuracy) were then performed as described above. Due to the difficulty in obtaining accurate results from conventional lateral calibration methods (including the shape-independent method) in liquid, only one cantilever (AIO cantilever B) was calibrated in water. The thermal noise spectrum used for cali-bration is shown in Figure4.
Despite the low Q of the cantilever (8.5) reducing the PSD of the thermal noise at resonance by over an order of magnitude, the peak is still easily visible above the noise floor. We found minimal difference between Lorentzian24and
sim-ple harmonic oscillator models for the PSD of the first tor-sional resonance in liquid.
IV. ANALYSIS
A. Thermal method
Thermal noise spectra for the first torsional mode of each cantilever were fitted to Eq.(5). The torsional torque constant was calculated using10
kϕ=0.1592ρw4LQω02i, (10)
whereρis the density of air, assumed to be 1.18 kg/m3,wis the width of the cantilever,Lis its length,Qandω0 are the quality factor and angular resonant frequency measured from the fitted thermal noise spectrum of the first torsional mode, andi is the imaginary part of the hydrodynamic function, calculated from Eq. (21) of Ref.27, assuming 1.86×10⁻⁵ kg/m/s for the viscosity of air and evaluating the Reynolds number at the resonant frequency.
The torsional InvOLS in nanometres of movement at the tip per volt of detector signal was then calculated using Eq.(9).
When calibrating flexural force constants5 and InvOLS
values21from thermal cantilever vibrations, it has been shown
that a correction must be applied22,28 for the difference in mode shape between a freely vibrating cantilever and a stat-ically deflected one. This is because the optical lever detec-tion system measures the angle of the upper surface of the cantilever4 as opposed to the position of the tip. In the case
tip height. This is true regardless of the cause of the tip dis-placement, or the geometry of the cantilever, as long as the tip may be assumed to be rigid and both the laser spot and the tip are at the free end of the cantilever. Under these assump-tions correction for the difference in statically and dynami-cally deflected cantilevers is unnecessary. A similar conclu-sion was reached by Wagneret al.,11and may also be reached by examining the mode shapes of cantilevers subjected to a static torque at their free end29and cantilevers free to oscillate
torsionally.30In cases where the laser or tip is not at the end of
the cantilever, a correction factor may be calculated from the tip setback, laser position, and respective mode-shapes. This was found to be insignificant for the cantilevers in this study, so was not used. Vibrations of higher torsional modes of the cantilever were also neglected, as at the frequency of the first mode, their contribution is removed byPwhitein Eq.(5).
The uncertainties for each measurement were calculated by summing the uncertainties of the constituent terms in quadrature. For the thermal method, these were assumed to be±10% forkϕcalculated by the torsional Sader method, the standard deviation of the fitting parametersf0,Pdc, andQover their fitted range (all<1% for all cantilevers) and±200 nm for the tip height as measured by SEM. These values typically lead to an uncertainty of 7%–9% on the thermally calculated InvOLS. This value is dominated by the uncertainty in the tor-sional torque constant.
B. Shape independent method
The inputs to the shape independent method18are the an-gle of repose of the cantilever, the flexural force constant, the necessary displacement of the tip in Z to reach the imaging setpoint, the adhesion between the tip and the sample surface and the height and lateral deflection images in trace and re-trace directions. The angle of repose is 10◦for the instrument used here, as specified by the manufacturer, in good agree-ment with our own measureagree-ments. The flexural force constant was calibrated via the thermal noise method5as implemented
in the JPK AFM control software, using the mean value of the flexural InvOLS measured from ten approach curves taken on a flat glass surface. The value of the flexural force constant was corrected for the tip set-back (L) using16
k=k
L
L−L
3
. (11)
A correction factor of 0.817 was also applied.28 The
ef-fect of the angle of repose on the normal load is inherent in the shape independent method,18so the force constant was not
corrected for this. The effect of the finite size of the laser spot on the cantilever31 was also neglected. The Z displacement was calculated from the mean flexural InvOLS and the rela-tive deflection setpoint in volts. This was corrected for ther-mal drift by measuring the off-surface deflection immediately before and after the scan, and assuming a linear change in the free deflection voltage with time over this interval. The adhe-sion was measured from ten approach curves taken along the fibre axis. The recorded height (measured) and lateral deflec-tion images were exported as text files with the height units in
micrometers and the lateral deflection in volts using Gwyd-dion software.32These images were “raw” with no levelling,
scaling, resampling, or filtering applied. The calculated values and image text files were then input into the software package developed by Andersonet al.18 and the value of the coeffi-cient of friction iteratively adjusted until the input and fitted values matched to the third significant figure. In some cases it was necessary to crop the images in the fast scan direction in order to remove turnaround effects. This was done using the “crop columns” function built into the shape independent soft-ware. After converging the trial and output values of the co-efficient of friction, its value and the lateral calibration factor in newtons per volt were recorded. For the shape independent method, a±10% uncertainty was assumed forkas measured by the thermal noise method, the uncertainty of the vertical InvOLS and adhesion were calculated from the standard de-viation of the value measured from 10 approach curves and was typically between 0.4% and 3% and 11% and 18%, re-spectively. The uncertainty in the adhesion rose to 53% when calibrating in water, due to the much reduced adhesion under these conditions.2The uncertainty of the load voltage was cal-culated from the standard deviation of the vertical deflection (error) signal images acquired during the calibration scan and was typically 1% or less. The uncertainty in the angle of re-pose was assumed to be 2◦ for silicon cantilevers and 5◦ for silicon nitride cantilevers. The uncertainty on the sample an-glesθ andα(as defined in Ref.18) were assumed to be 1◦, and the uncertainty in the coefficient of friction was taken to be the standard deviation of the fitting procedure in the cal-ibration software, and was typically below 1%. Overall, an uncertainty between 19% and 27% was calculated for the lat-eral force sensitivity determined using the shape independent method in air and 55% in liquid. The dominant contribution to the uncertainty was the adhesion force in all cases.
C. Comparison of shape independent and thermal methods
The shape independent and thermal methods output dif-ferent quantities – namely the lateral force sensitivity in units of newtons per volt and the lateral InvOLS in units of me-tres per volt, respectively. In order to convert the lateral force sensitivity into the lateral InvOLS, we divide by the effective lateral force constant, given by33
keff = ktors
1+ k
t ors
klat
, (12)
wherektorsis the torsional force constant in newtons per metre at the tip, which may be calculated from the torsional torque constant,kϕ, in the limit of small torsion angles by16
ktors = kϕL
(L−L)h2, (13)
andklatis the force constant for in-plane bending of the can-tilever, given by33
klat = Et w
3
4 (L−L)3. (14)
113703-6 N. Mullin and J. K. Hobbs Rev. Sci. Instrum.85, 113703 (2014)
If the flexural force constant of the cantilever is known, it is also possible to calculate the lateral force constant using the relation:
klat = w
t 2
k, (15)
to remove any dependence on the material properties of the cantilever. However, this relation is only valid for isotropic materials and introduces a large uncertainty from the squared dependence on the thickness of the cantilever. For this reason, allklatvalues in this work were calculated using Eq.(14).
The use of the effective lateral force constant rather than
ktorsis necessary to account for in-plane bending of the can-tilever when a DC lateral force is applied.16,33 It has been demonstrated that in plane bending of the cantilever may be neglected if the in-plane force constant,klat, is much greater than the torsional force constant,ktors.33 For the cantilevers
considered here,ktors is between 0.06 and 1.6klat, so lateral bending is non-negligible in our experiment. Unfortunately, the calculation ofklat from Eq.(14)incurs significant uncer-tainty due to the linear dependence of this parameter on can-tilever thickness. Assuming uncertainties of±200 nm on the cantilever dimensions L, w, t, and h, and 10% for the tor-sional torque constant,kϕ, a total uncertainty on keff of ap-proximately 15% for the silicon cantilevers and 30% for sili-con nitride cantilevers is obtained. This is added in quadrature to the uncertainty on the lateral force sensitivity when calcu-lating the lateral InvOLS. Conversely, it would be added to the uncertainty on the lateral InvOLS if calculating the lateral force from an LFM experiment where the thermal method had been used for lateral InvOLS calibration.
V. RESULTS AND DISCUSSION
A. InvOLS values derived from thermal and shape independent methods
The properties of each cantilever and the results of the individual calibration procedures are shown in TableI.
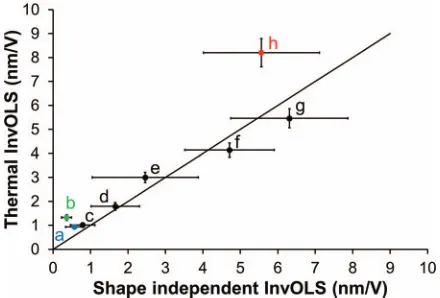
[image:7.612.328.548.51.200.2]The InvOLS calculated from the thermal measurements is plotted against the InvOLS calculated by dividing the force
FIG. 5. Plot of lateral InvOLS values obtained from the thermal and shape independent methods. The black line isy=x, corresponding to perfect agree-ment between the two methods. Data point a corresponds to OMCL-RC800-A, b – OMCL-RC800-D, c – OMCL-RC800-B, d – OMCL-RC800-C, e – AIO-B (in water), f – AIO-B, g – AIO-C, h – AIO-D. Points a, b, and h (marked in blue, green, and red, respectively) return InvOLS values that do not agree within the calculated experimental uncertainties and are discussed individually in the text.
sensitivity measured from the shape independent method by
keffin Figure5.
The thermal method returned values of the torsional InvOLS for all cantilevers. The shape independent method yielded measurable force sensitivity values for all cantilevers except for AIO cantilever A. Despite numerous repeats of the experiment with this cantilever it was not possible to converge the trial and output coefficients of friction by the shape inde-pendent method. A possible reason for this is thatklatis lower thanktorsfor this cantilever, which could lead to buckling.
[image:7.612.51.561.613.751.2]All of the other cantilevers returned converging coef-ficients of friction with values between −0.4 and 0.7. We note that negative values of μ are unphysical. Similar re-sults were obtained by Andersonet al.18and it was suggested that a non-uniform coefficient of friction may be the cause of the negative values of μ. Some inhomogeneity may be seen in the lateral force images collected in this work (e.g., Figure 2(b)), supporting this conclusion. As highlighted in Ref.18, the coefficient of friction is a second order term and
TABLE I. Comparison between the thermal and shape independent InvOLS measured for 8 different cantilevers in air and one in water. Cantilever dimensions were measured by SEM, the resonant frequency (f0) and quality factor (Q) of the first torsional mode were measured from fits of the torsional thermal noise spectra, the torsional force constant,ktors, was calculated by the torsional Sader method (assuming the density and viscosity of air are 1.18 kg/m3and 1.86×
10−5kg/m/s, respectively) and tip height, the lateral force constant,klat, is calculated from the cantilever dimensions and material properties (Young’s moduli of 170 GPa and 270 GPa were assumed for silicon and silicon nitride, respectively).
L w t h Torsional Torsional ktors klat keff Aspect Shape independent Thermal InvOLS Cantilever (μm) (μm) (μm) (μm) f0(kHz) Q Material (N/m) (N/m) (N/m) ratio InvOLS (nm/V) (nm/V)
AIO-A 510.0 33.3 3.43 15.3 453.5 316.1 Si 82.02 43.19 28.29 15.32 . . . 3.73±0.27
plays a relatively minor role in the determination of the lateral force sensitivity, so these results were retained and used.
The plot in Figure5shows that there is good agreement for the torsional InvOLS value calculated from both methods for the majority of cantilevers tested, including the measure-ment in liquid. There are three outlying points (labelled “a,” “b,” and “h”) in Figure5where the two methods return lateral InvOLS values that do not agree within the calculated uncer-tainty. These are discussed individually below.
Point “h” (red) corresponds to AIO cantilever D. This cantilever has an aspect ratio of 2.26:1, which is lower than the aspect ratio of 3 generally considered the lowest value for which the underlying assumptions of the Sader method allow accurate results.6As the InvOLS calculated from the thermal
method depends onkϕ−1/2, while the shape independent In-vOLS scales withkϕ−1, an error in the calculation ofkϕ will cause the two methods to disagree. In line with measurements of the flexural modes of cantilevers with low aspect ratios,21,34
the torsional torque constant is expected to be underestimated by the torsional Sader method. This would cause both meth-ods to overestimate the InvOLS, but the thermal method to overestimate it to a greater extent. AIO cantilever D also de-parts significantly from the rectangular geometry (Figure6) inherently assumed in the torsional Sader method. The effect of the taper is to reduce the hydrodynamic load,34leading to
the torsional torque constant being overestimated. This effect could mitigate, or even exceed the underestimation ofkϕ due to the low aspect ratio. The departure from rectangular ge-ometry also affects the calculation of klat. The actual width of the cantilever towards the free end is significantly smaller than the value used, causing Eq.(14)to overestimateklat. This would lead tokeffbeing overestimated and the shape indepen-dent InvOLS being underestimated. In this case, we believe that a combination of underestimation ofkϕ due to the low aspect ratio and overestimation ofkeffdue to the taper lead to the observed disagreement between calibration methods.
[image:8.612.53.298.569.716.2]Point “a” (blue) corresponds to OMCL-RC800 cantilever A. This cantilever has an aspect ratio of 2.38:1, again, lower than the value of 3 considered the lower limit for accuracy in the Sader method. This cantilever is almost ideally rectangu-lar, so the dominant effect is underestimation ofkϕ, leading to overestimation of the lateral InvOLS by the thermal method.
FIG. 6. SEM image of the AIO cantilever D. The dashed box shows the ap-proximate plan view dimensions assumed for the calibration of the torsional torque constant. The scale bar represents 20μm.
AIO cantilever D and OMCL-RC800 cantilever A also have the highest values ofkeff in this study. It has previously been shown that deformation of the tip itself cannot necessar-ily be neglected if the overall lateral stiffness is high.35If tip bending is occurring during the shape independent measure-ment, this would causekeff to be further overestimated, and the shape independent InvOLS to be underestimated, in line with the behaviour observed here.
Point “b” corresponds to OMCL-RC800 cantilever D. For this cantileverklat<ktors, so the value ofkeffused to calcu-late the calcu-lateral InvOLS from the calcu-lateral force sensitivity in the shape independent method is dominated byklat, which is cal-culated from Eq.(14)and the material properties and dimen-sions of the cantilever. Here we believe that the disagreement between the methods originates in the calculation ofklat, most probably in the assumption of the bulk value for the Young’s modulus of silicon nitride, which is known to vary consid-erably for thin films,36 and whose value depends sensitively
on the deposition conditions. Using Eq.(15)to calculateklat from the flexural stiffness, width, and thickness reduces the disparity between the shape independent and thermal InvOLS values (data not shown), but the two methods still do not agree within the experimental error. The only other cantilever in this study withklat <ktors is AIO cantilever A, for which it was not possible to measure a calibration factor from the shape independent method. As discussed above, this may indicate that large lateral bending gives rise to buckling, resulting in an erroneous calibration factor from the shape independent method.
As expected, SEM imaging of the tips of cantilevers after calibration by the shape independent method revealed signif-icant blunting and damage (Figure 7), especially for stiffer cantilevers. In these cases, calibration by the thermal method offers the significant advantage of not requiring any contact with the sample surface.
B. Photodiode linearity
It has previously been highlighted that the lateral InvOLS can vary significantly with the position of the reflected laser beam on the photodiode.16 Due to its speed and
simplic-ity, requiring only a thermal noise spectrum to be captured,
FIG. 7. (a) SEM image of the tip of a fresh AIO-B cantilever. The scale bar is 5μm. (b) SEM image of the tip of AIO cantilever B after shape independent calibration, showing damage caused to the tip apex by hard contact with the sample during the calibration procedure.
[image:8.612.314.561.583.706.2]113703-8 N. Mullin and J. K. Hobbs Rev. Sci. Instrum.85, 113703 (2014)
the thermal method is ideal for characterizing the photodi-ode response. In order to measure the variation of the lateral InvOLS, thermal noise spectra were acquired for the first tor-sional mode of AIO cantilever B at a grid of positions on the photodiode, using the same parameters as described in Sec.III C. The relative position of the laser spot on the pho-todiode was varied using the phopho-todiode positioning screws. Spectra were collected at 2 V intervals in a raster pattern. At each point, the vertical and lateral deflections remained within ±100 mV of their stated position for the duration of the mea-surement. The lateral thermal InvOLS was then calculated us-ing a fit of the thermal noise spectrum to Eq.(5), the measured dimensions of the cantilever and the measured temperature. To aid comparison, all lateral InvOLS values shown are nor-malized to the value measured at the centre of the photodiode, which, for this experiment was 4.52 nm/V.
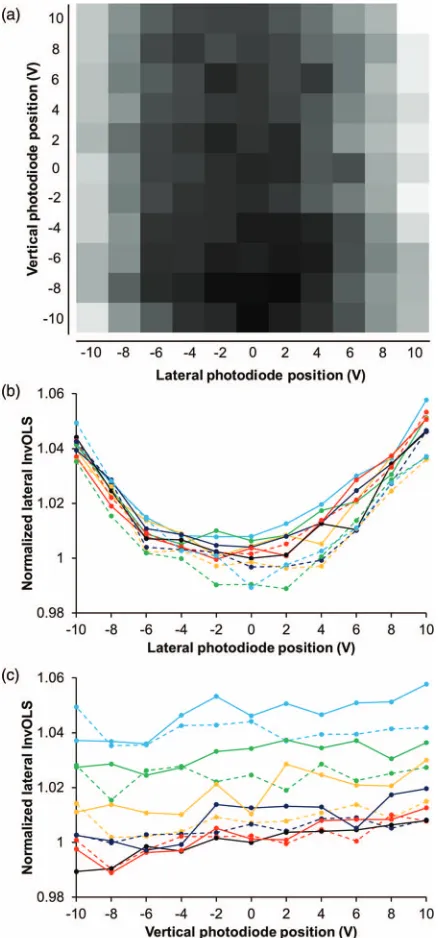
As can be seen from Figure 8(a), the measured lateral InvOLS does vary as a function of photodiode position for the instrument, cantilever, and alignment used here. For values within approximately 5 V of the centre, the deviation is less than 2% and may be safely ignored.
For lateral deflections (Figure8(b)), the InvOLS is lowest in the centre of the photodiode and rises toward the edges in a parabolic fashion. This behaviour is approximately what is expected for optical lever detection systems, and is due to the approximately Gaussian intensity profile of the laser spot on the photodiode.37 The photodiode sum signal remained
con-stant throughout the measurement, indicating that the laser spot is not truncated by the edges of the photodiode for the range of values tested. Similar behaviour (though much more pronounced) was observed in Ref.16(note that Cannaraet al.
plot the deflection sensitivity, i.e., the reciprocal of the In-vOLS as plotted in Figure8of this work).
At vertical photodiode positions away from the centre, there is little variation in the lateral InvOLS. A slight system-atic increase with increasing vertical photodiode position may be seen in Figure8(c); however, this was not a reproducible trend and has a magnitude of less than 2% for all measure-ments shown here. The variation in lateral InvOLS as a func-tion of vertical photodiode posifunc-tion is sufficiently small that correction is unlikely to be necessary for friction versus load experiments, where the lateral signal is measured as a func-tion of vertical deflecfunc-tion.
Overall, the value of the lateral InvOLS varies by less than 8% over the full range of both vertical and lateral di-rections, with the majority of the variation occurring well away from the photodiode centre. The variation of the lateral InvOLS is similar in magnitude to the absolute experimen-tal error on this value (as the linearity measurements were carried out with the same cantilever and laser alignment, the relative error on the measurements in Figure8is determined only by the fitting parameters of the thermal noise spectrum, and is<1% for all points) meaning that if large lateral forces are to be measured, or it is necessary to work at positions far from the centre of the photodiode, correction for the varia-tion of the lateral InvOLS is necessary for accurate results. Due to the quick and simple nature of the thermal calibra-tion procedure, a grid of InvOLS measurements (such as that in Figure8(a)) may be made before or after an experiment,
FIG. 8. (a) Greyscale map of the normalized lateral InvOLS as measured by the thermal method for different positions on the photodiode. Black to white corresponds to InvOLS values from 0.989 to 1.057 of the value at the centre of the photodiode. (b) The lateral InvOLS as a function of lateral position for different vertical positions on the photodiode, corresponding to cross sections through (a) in the horizontal direction. Black represents vertical displace-ments of 0 V, red 2 V, dark blue 4 V, orange 6 V, green 8 V, and light blue 10 V from the photodiode centre. Solid lines represent positive voltage; dashed lines represent negative voltage. (c) Lateral InvOLS as a function of vertical position for different lateral positions on the photodiode, corresponding to cross sections through (a) in the vertical direction. The colour and symbol conventions are the same as (b).
[image:9.612.329.548.51.520.2]from the cantilever; hence it is likely that different instruments and different cantilevers will give significantly different be-haviour and this correction should be made on an individual basis.
VI. CONCLUSION
We have performed a quantitative comparison between the thermal noise method for calibrating the lateral InvOLS and the InvOLS calculated from the shape independent lateral calibration method. We find good agreement between the two methods, as long as 3 simple criteria are satisfied:
(1) That the geometry of the cantilever is suitable for cal-ibration by the torsional Sader method.10 This requires
that the cantilever is approximately rectangular and has an aspect ratio of at least 3.
(2) That in-plane bending of the cantilever may either be eliminated or accounted for.33
(3) That any scaling of the lateral deflection signal between the collection of the lateral thermal noise spectrum and the recording of the lateral deflection in software may be eliminated or accounted for.25
We note that a recently published version of the flexu-ral Sader method allows calibration of cantilevers of arbitrary shape.34 Extension of this to torsional modes would
elimi-nate point 1. Point 2 may be addressed by judicious choice of cantilever, with short, wide cantilevers with tall tips min-imizing the need for correction for in-plane bending.33 For
experiments in TR mode under relatively weak tip-sample in-teraction, in-plane bending may also be neglected.38 Point 3
requires only careful measurement of the AFM system used. The thermal noise method has the advantage of being quick, simple, and not requiring tip-surface contact. Due to its quick and non-destructive nature it may be easily repeated on multiple occasions and allows easy characterization of the de-tector response. For this reason the method is attractive, par-ticularly for experiments requiring sharp or chemically func-tionalized tips39or dynamic lateral force experiments.
ACKNOWLEDGMENTS
We gratefully acknowledge Professor Steven P. Armes for supplying the quartz fibres, Mr. Tilo Jankowski and Dr. Heiko Haschke from JPK Instruments for factory modifica-tions of the NanoWizardR
3 AFM, Mr. Paul Kemp-Russell from the Physics and Chemistry Workshop at the University of Sheffield for fabrication of the acoustic and vibration iso-lation hood, and the EPSRC for financial support through its Programme Grant scheme (Grant No. EP/I012060/1).
1G. Binning, C. F. Quate, and Ch. Gerber,Phys. Rev. Lett.56, 930 (1986). 2A. L. Wiesenhorn, P. K. Hansma, T. R. Albrecht, and C. F. Quate,Appl.
Phys. Lett.54, 2651 (1989).
3C. M. Mate, G. M. McClelland, R. Erlandsson, and S. Chiang,Phys. Rev.
Lett.59, 1942 (1987).
4G. Meyer and N. M. Amer,Appl. Phys. Lett.53, 1045 (1988). 5J. L. Hutter and J. Bechoeffer,Rev. Sci. Instrum.64, 1868 (1993). 6J. E. Sader, J. W. M. Chon, and P. Mulvaney,Rev. Sci. Instrum.70, 3967
(1999).
7C. T. Gibson, G. S. Watson, and S. Myhra,Nanotechnology7, 259 (1996). 8J. P. Cleveland, S. Manne, D. Bocek, and P. K. Hansma,Rev. Sci. Instrum.
64, 403 (1993).
9M. Munz,J. Phys. D: Appl. Phys.43, 063001 (2010).
10C. P. Green, H. Lioe, J. P. Cleveland, R. Proksch, P. Mulvaney, and J. E.
Sader,Rev. Sci. Instrum.75, 1988 (2004).
11K. Wagner, P. Cheng, and D. Vezenov,Langmuir27, 4635 (2011). 12T. Pettersson, N. Nordgren, M. W. Rutland, and A. Feiler,Rev. Sci. Instrum.
78, 093702 (2007).
13E. Tocha, J. Song, H. Schönherr, and G. J. Vansco,Langmuir23, 7078
(2007).
14D. F. Ogletree, R. W. Carpick, and M. Salmeron,Rev. Sci. Instrum.67,
3298 (1996).
15R. G. Cain, M. G. Reitsma, S. Biggs, and N. W. Page,Rev. Sci. Instrum.
72, 3304 (2001).
16R. J. Cannara, M. Elgin, and R. W. Carpick,Rev. Sci. Instrum.77, 053701
(2006).
17S. S. Barkley, Z. Deng, R. S. Gates, M. G. Reitsma, and R. J. Cannara,Rev.
Sci. Instrum.83, 023707 (2012).
18E. V. Anderson, S. Chakraborty, T. Esformes, D. Eggiman, C. DeGraf, K.
M. Stevens, D. Lin, and N. A. Burnham,ACS Appl. Mater. Interfaces3, 3256 (2011).
19L. Huang and C. Su,Ultramicroscopy100, 277 (2004).
20P. Maivald, H.-J. Butt, S. A. C. Gould, C. B. Prater, B. Drake, J. A. Gurley,
V. B. Elings, and P. K. Hansma,Nanotechnology2, 103 (1991).
21M. J. Higgins, R. Proksch, J. E. Sader, M. Polcik, S. McEndoo, J. P.
Cleve-land, and S. P. Jarvis,Rev. Sci. Instrum.77, 013701 (2006).
22P. Attard, T. Pettersson, and M. W. Rutland,Rev. Sci. Instrum.77, 116110
(2006).
23S. M. Cook, T. E. Schäffer, K. M. Chynoweth, M. Wigton, R. W.
Sim-monds, and K. M. Wang,Nanotechnology17, 2135 (2006).
24T. Pirzer and T. Hugel,Rev. Sci. Instrum.80, 035110 (2009).
25We have measured this to be the case for the JPK NanoWizardR 3 AFM with VortisTM Advanced SPM Controller used here (signals measured from the Signal Access Module built into the controller), an Asylum Re-search MFP-3DTMwith high bandwidth photodiode option (signals
mea-sured at the BNC output from the AFM head) and for Veeco (now Bruker) MultimodeRand DimensionRAFMs using NanoScopeR IIIa and IV con-trollers (signal measured using a Signal Access Module placed between the AFM and the controller).
26J. E. Sader, J. Sanelli, B. D. Hughes, J. P. Monty, and E. J. Bieske,Rev. Sci.
Instrum.82, 095104 (2011).
27C. P. Green and J. E. Sader,J. Appl. Phys.92, 6262 (2002). 28H.-J. Butt and M. Jaschke,Nanotechnology6, 1 (1995).
29S. Timoshenko and J. N. Goodier,Theory of Elasticity(McGraw-Hill, New
York, 1951), p. 275.
30M. Reinstaedtler, U. Rabe, V. Scherer, J. A. Turner, and W. Arnold,Surf.
Sci.532–535, 1152 (2003).
31R. Proksch, T. E. Schäffer, J. P. Cleveland, R. C. Callahan, and M. B. Viani,
Nanotechnology15, 1344 (2005).
32D. Neˇcas and P. Klapetek,Cent. Eur. J. Phys.10, 181 (2012). 33J. E. Sader and C. P. Green,Rev. Sci. Instrum.75, 878 (2004).
34J. E. Sader, J. A. Sanelli, B. D. Adamson, J. P. Monty, X. Wei, S. A.
Craw-ford, J. R. Friend, I. Marusic, P. Mulvaney, and E. J. Bieske,Rev. Sci. In-strum.83, 103705 (2012).
35M. A. Lantz, S. J. O’Shea, M. E. Welland, and K. L. Johnson,Phys. Rev. B
55, 10776 (1997).
36A. Khan, J. Phillip, and P. Hess,J. Appl. Phys.95, 1667 (2004). 37T. E. Schäffer and P. K. Hansma,J. Appl. Phys.84, 4661 (1998). 38Y. Song and B. Bhushan,J. Appl. Phys.99, 094911 (2006)
39C. D. Frisbie, L. F. Rozsnyai, A. Noy, M. S. Wrighton, and C. M. Lieber,
Science265, 2071 (1994).