Rochester Institute of Technology
RIT Scholar Works
Theses Thesis/Dissertation Collections
12-4-2015
Effect of Simulated Canopy Cover on Created
Vernal Pools in the Northeastern US
Elizabeth Anne Bruen [email protected]
Follow this and additional works at:http://scholarworks.rit.edu/theses
This Thesis is brought to you for free and open access by the Thesis/Dissertation Collections at RIT Scholar Works. It has been accepted for inclusion in Theses by an authorized administrator of RIT Scholar Works. For more information, please [email protected].
Recommended Citation
R
•
I
•
T
Effect of Simulated Canopy Cover on Created Vernal Pools in
the Northeastern US
by
Elizabeth Anne Bruen
A Thesis Submitted in Partial Fulfillment of the Requirements for the Degree of
Master of Science in Environmental Science
Thomas H. Gosnell School of Life Sciences
College of Science
Rochester Institute of Technology
Rochester, NY
i
Committee Approval:
_____________________________________________________________
Anna Christina Tyler, Ph.D.
Date
Thesis Advisor
_____________________________________________________________
Elizabeth N. Hane, Ph.D.
Date
Committee Member
_____________________________________________________________
ii
Table of Contents
Acknowledgements………...iii
Abstract………..1
Introduction ………2
Vernal Pool Restoration and Creation..………..…………. 5
Methods ………7
Site Description……….……….…7
Experimental Design ………..… 9
Sampling and Analytical Methods……….10
Data Analysis ……….12
Results ……….…...13
Leaf Litter ………….………13
Nutrients ……….………14
Organic Matter……….………...14
Invasive Plant Cover ……….15
Chlorophyll a ………….………15
Macroinvertebrates …..………15
Amphibians ……….……….16
PCA ………..16
Discussion……….17
Hydrology………17
Organic Matter and Nutrient Dynamics ………..………18
Biodiversity and Invasive Species .….………..20
Interactions among Variables………21
iii
Tables and Figures
Tables
Table 1: Topographic Characteristics……….24
Table 2: Repeated Measures ANOVA……….25
Table 3: One-way ANOVA………..26
Table 4: Leaf Litter………..26
Table 5: Plant Cover………..26
Table 6: Macroinvertebrates………27
Table 7: Bray-Curtis ………28
Table 8: Amphibians………29
Table 9: Principal Components Analysis………..30
Figures Figure 1: Aerial imagery………..31
Figure 2: Flooding profiles………..………..32
Figure 3: Nutrient concentrations in Surface Water………33
Figure 4: Extractable nutrient concentrations……….34
Figure 6: Organic Matter………35
Figure 7: Total Invasive Cover……….35
Figure 8: Individual invasive species………..36
Figure 9: Chlorophyll a………...37
Figure 10: Macroinvertebrates………..38
Figure 11: Cluster Diagram………..39
1
Abstract
2
Introduction
Vernal pools in the Northeastern United States are small, forested wetlands characterized by periodic flooding, typically in spring. Wetlands provide the largest value of ecosystem services on an areal basis relative to other terrestrial ecosystems (Costanza, 2014). These include flood control, drought prevention, water quality protection, nutrient removal and provision of habitat for numerous species (Mitsch and Gosselink, 2000; Schlesinger, 1997). Vernal pools in
particular are key components in flood protection following spring snowmelt and rains, and can be important regional sinks for nitrogen (Brooks, 2009; Capps et al., 2014). These unique ecosystems also support both terrestrial and aquatic organisms, acting as local hotspots for biodiversity (Colburn et al., 2007). To combat extensive loss of wetlands, vernal pools may be created to mitigate losses in area and function of existing vernal pools (Lichko and Calhoun, 2003). In many instances, however, created pools do not mimic the natural ecological functions found in extant vernal pools due to shortcomings in the restoration process, especially
susceptibility to invasive plant species, lower soil organic matter, altered carbon cycling, an altered hydroperiod, lack of canopy cover, and lower diversity of macroinvertebrates (Korfel et al. 2010; Lichko and Calhoun, 2003). Because of the importance of these systems for regional biodiversity of both terrestrial and aquatic species, gaining a better understanding of conditions required for adequate ecosystem function is imperative to enable more successful vernal pool creation.
3
temperate regions, vernal pools are typically found in forested landscapes. The surrounding forest canopy has an indirect effect on hydroperiod, by influencing light availability,
temperature, evaporation and water uptake and transpiration by vegetation (Black and Zedler, 1998; Brooks, 2004).
In seasonal pools, there is substantial variation in water chemistry, including nutrient
concentrations and pH, associated with the length and frequency of the hydroperiod (Bonner et al., 1997). As a result, vernal pools may be hotspots of biogeochemical activity. The rates of decomposition and denitrification are greater in flooded zones than in the surrounding landscape (Capps et al., 2014) and there is evidence of mercury methylation and bioaccumulation in seasonal forest pools relative to the length of the hydroperiod (Brooks et al. 2012). However, these factors are also driven by the canopy cover, which controls temperature, evaporation, light availability and delivery of labile carbon (Schiesari, 2006), resulting in characteristic differences in the biogeochemistry of closed canopy versus open canopy pools. In an open canopy pool, high light availability promotes growth of algae and floating and emergent vascular plants that then supply higher trophic levels. In closed canopy pools, however, light is intercepted by the trees and organic matter delivery to the pools is delayed until leaves are shed in the autumn. As a result of this more refractory source of organic matter, closed canopy pools tend to have a higher carbon: nitrogen ratio in the soils (Schiesari, 2006).
Hydroperiod and canopy cover are also driving factors in the biological community of vernal pools, which includes macroinvertebrates, vascular plants, algae, amphibians, migratory birds, and some mammals. Vernal pools serve important nursery functions for many species of amphibians because of the lack of fish and other desiccation-intolerant predators (Bonner et. al, 1997). Obligate vernal pool amphibians, including the endangered tiger salamander (Abystoma tigrinum), Jefferson salamander (Ambystoma jeffersonian) and wood frogs (Rana sylvatica), spend their lives near their natal vernal pool. During the flooded period, a variety of
opportunistic species colonize the pools (Bonner et al., 1997). These species often have
4
(Nicolet, 2004). Thus, at the landscape level, vernal pools contribute to overall forest community biodiversity (Nicolet, 2004).
R. sylvatica and A. Jeffersonian have higher growth rates in an open canopy pool than in a closed canopy pool (Schiesari, 2006). This is due to factors associated with canopy cover, such as leaf litter, temperature, hydroperiod and light availability. An experimental canopy removal over vernal pools in Connecticut showed that certain canopy intolerant species, the green tree frog (Hyla versicolor) and spring peepers (Sudacris crucifer) were more abundant after cutting part of the canopy (Skelly et al., 2014). As indicated by these studies, certain amphibian species require some direct sunlight for development within vernal pools, though some cover is still necessary to provide carbon, and reduce water loss through evapotranspiration. Thus restoring the pools and the surrounding area is of utmost important for declining amphibian populations and we are in need of a better understanding of the factors that lead to successful vernal pool restoration (Brooks, 2005).
While the duration of the hydroperiod is important for amphibians, pool hydrology has less of an effect on the presence and abundance of macroinvertebrate species than the predominant food source, whether it is detritus in the form of leaf litter from the above canopy or autochthonous production (Bischof et al., 2013). The food web of closed canopy vernal pools requires an external source of carbon to function properly (Rubbo et al., 2006). The type of leaf litter, i.e. what species it is from, is not as important to the food web as the presence or absence of litter. Removing litter may lower respiration rates in vernal pools but won’t affect primary production (Rubbo et al., 2006). The algal assemblages in vernal pools are not affected by the tree species in the canopy above, and thus the leaves they shed (Verb et al. 2001). Similarly, for decomposition rates in the pools, the chemistry of the leaf litter is of secondary importance, primarily decomposition rates are affected by climatic region (Aerts, 1997).
5
acid metabolism may occur in the dark, suggesting an advantage of this type of metabolism in these intermittently flooded systems (Keeley and Sandquist, 2014). Vernal pools with a longer hydroperiod were found to have lower exotic plant cover as a longer hydroperiod allows for native plant species adapted to flooding (Gerhardt and Collinge, 2003). Hydroperiod length and tussock height of the sedge Carex stricta are directly related (Lawrence and Zedler, 2011)
meaning that in years when there is more water available aquatic plant species have more growth potential.
Vernal pool restoration and creation
Creating vernal pools to replace those lost to human development may enhance regional biodiversity, key biogeochemical processes, and flood protection. Creation and restoration of vernal pools requires attention to numerous factors, including canopy cover, hydrology, soil type and geology, organic matter, and substrate for organisms. Failure of restoration projects often results from sitting on unsuitable soil or geology, failure to understand effects of surrounding land use (including canopy cover), failure to establish appropriate hydrology, or invasion by opportunistic plants (Sutter and Francisco, 1998; Zedler and Kercher, 2004). In vernal pool restoration projects there is a lack of understanding about the relationships between depth, precipitation, and hydroperiod (Black and Zedler, 1998). It is also particularly unclear what the role of canopy cover, and subsequent leaf litter input, is during vernal pool creation. In addition, many projects have site specific performance goals, often geared towards replacing extant functions of destroyed wetlands. Thus, vernal pool design must account for the functions of the pool being replaced, i.e. if amphibian breeding habitat is desired, substrate for attachment of egg masses must be provided (Lichko and Calhoun, 2003). There are, however, a variety of
challenges including difficulty meeting lost functions in creation and restoration projects due to our lack of understanding the differences between created and natural systems (Brinson, 1993).
The disturbance associated with wetland creation frequently opens the door for opportunistic plant invasion (Zedler and Kercher, 2004), such that restored or created wetlands often have more invasive species than reference wetlands (Balcombe, 2005). Invasive plants are
6
(Ehrenfeld, 2003; Zedler and Kercher, 2004). They decrease biodiversity and increase susceptibility to further invasion through interactions with microorganisms and large animals (Zedler and Kircher, 2004). Because created vernal pools may also have higher light availability due to the lack of a full canopy, these systems are highly susceptible to invasion by herbaceous plants that impact the creation of functionally equivalent wetlands. However, it is not clear what role the tree canopy has on created vernal pool function and whether pool restoration may be improved by additional attention to factors associated with the surrounding landscape.
The overall goals of this study were to establish the differences in physio-chemical and biotic attributes between natural and created vernal pools in Western, NY and to determine if simulated canopy cover will limit invasive plant cover and influence the trajectory of vernal pool
development. I predicted that natural vernal pools would receive greater inputs of leaf litter and as a result have higher soil organic matter, more diverse amphibian and macroinvertebrate communities, lower algal biomass and lower cover by invasive plants than created pools. In addition, I hypothesized that experimental leaf litter and shade creation would bring organic matter, nutrient and biodiversity levels closer to those of natural pools. Leaf litter will provide an energy source in the form of organic carbon, and shade creation will increase hydroperiod by reducing evapotranspiration; thus, providing more development time for macroinvertebrate and canopy tolerant amphibian larvae. The shade was also expected to deter shade-intolerant invasive wetland plants.
Methods
Site Description
This study was conducted at High Acres Nature Area (HANA) in Perinton, NY. HANA,
adjacent to the High Acres Landfill, is owned by Waste Management of New York, LLC and is a certified Corporate Lands for Learning site through the Wildlife Habitat Council. The land cover has changed multiple times throughout its history. The original wetlands were drained for
7
Natural vernal pools exist in the forested upland (Figure 1). These are complex pools that are hydrologically connected through surface water during peak flooding. The canopy cover is comprised of predominantly Maple species (Acer spp.), with contributions from Oaks (Quercus spp.), Eastern Cottonwood (Populus deltoides), Beech (Fagus grandifolia), and Basswood (Tilia americana). Four discrete pools were randomly selected for this study.
In 2009, eight vernal pools were created. Most of the existing trees were removed during
construction, leaving an expanse of land with little tree cover (Figure 1). In addition, excavation removed top layers of soil, likely removing the native plant seed bank and reducing organic matter in the soil. Trees and shrubs, including Maples (Acer spp.), Red Osier Dogwood (Cornus sericea), and Sycamore (Platanus occidentalis), were planted during the original construction. These plantings were augmented in July 2014 with live stakes of four species, Silky Dogwood (C. amomum), Red Osier Dogwood (C. sericea), Common Elderberry (Sambucus canadensis), and Common Buttonbush (Cephalanthus occidentalis). The pools were also rapidly colonized by herbaceous plants, including True Sedges (Carex spp.), Water Plantain (Alismo plantago aquatica), and Broadleaf Arrowhead (Saggitaria latifolia) in addition to a number of invasive plants. The herbicide glyphosate was applied in 2013 to the entire area of the created vernal pools to remove Cattail (Typha spp.), Reed Canary Grass (Phalaris arundinacea), and Purple Loosestrife (Lythrum salicaria). Spraying in the area surrounding the pools continued in 2014 and 2015, but a 2 m buffer zone was established around each pool where no herbicide was applied. Invasive species were removed from all created pools in June 2014, and cattail seed heads were cut again in July 2015.
Pool bathymetry was measured at the peak of spring flooding in 2014 for created pools and 2015 for natural pools. I measured the length at the longest axis of each pool, and the width at the center of the length axis. Water depth was measured by overlaying a grid of 50 points over the rectangle formed by the length and width axes and measuring the depth at the intersection of the grid lines. The points without standing water were marked as 0 cm to delineate the boundary of each pool. Because all pools were approximately elliptical, the maximum pool surface area (SA)
was calculated using the formula SA=!"#! , where L is the length of the long axis and W is the
8
from Brooks and Hayashi, 2002, as adapted from Hayashi and van der Kamp, 2000. Where V is
the maximum volume, at maximum area, A, and maximum depth, d, and𝑝 = !"#
!
!"
!"#!"!, where d0
corresponds to radius of 0.5 m and r0 corresponds to the radius at y0 (Hayashi and van der Kamp,
2000). To monitor maximum water level changes over time, a 2 m section of PVC pipe was placed at the deepest point depth and depth was measured biweekly throughout the hydroperiod from April to October of 2014 and 2015 (natural pools in 2015 only). Heterogeneity of the bottom of the pools was calculated by finding the standard deviation of the difference between depth point and 8 surrounding points for all depth points (n=50) and was averaged for the bathymetry grid.
To assess differences in canopy cover between natural and created pools, ambient light
availability was measured using a LiCOR 2pi quantum light sensor following the installation of the shade cloths. Litterfall was also measured in both natural and created pools to determine the amount of organic carbon supply from the tree canopy. Leaf litter was collected using 53 L plastic laundry baskets. Five holes were drilled in the bottom of each basket to allow water to drain. Three or six baskets were placed in each created or natural pool, respectively, with the larger number of baskets in the natural pools reflecting their larger size. Litter was collected bi-weekly from mid-October through December 2014, and late August through December 2015. Leaves were air dried, sorted by species and weighed. The organic carbon content was
calculated using average leaf carbon values (Cornell, 1992).
Experimental Design
To simulate the impact of canopy cover on created vernal pools, I implemented four treatments (n=2 pools): leaf litter addition, shading, leaf litter + shading, and a control (Table 1). The low replication within treatments is acceptable because there is manipulation of a whole ecosystem as opposed to a small part (Hurlbert, 1984). The manipulations for each pool were randomly
9
of PVC piping. Shade cloths did not cover the entire surface area of the pool, but were sufficient to shade approximately 20-30% of the pool area with a reduction in light availability of
10 Sampling & Analytical Methods
Water column nutrients (ammonium, nitrate and phosphate), soil organic matter and extractable nitrogen and phosphorus, and macroinvertebrate and plant communities were measured in the created vernal pools between May 22 - June 2, 2014 prior to the implementation of experimental manipulations , and twice during each summer (2014 and 2015) after treatments were imposed. The natural pools were sampled during 2015 only, but the created pools were sampled in 2014 and 2015. In 2014, water column samples were collected once from the created pools and were collected monthly during the flooded season of 2015, resulting in May and June samples. Soil samples were collected twice, once during the hydroperiod in June and once after desiccation in August in 2014 and 2015. Macroinvertebrates were sampled using the kicknet once during the duration of the hydroperiod, and soil cores were taken once. Benthic microalgae and periphyton was assessed twice during the 2015 hydroperiod.
Water column nutrient samples were collected using a 60 ml syringe and immediately filtered through a 0.45 um PES syringe filter into Whirlpak bags. The samples were placed immediately on ice prior to freezing at -20°C until analysis. In the lab, water samples were analyzed for NO3-,
NH4+, and PO43-. NO3- and PO43- were analyzed using Lachat Quickchem 8500 autoanalyzer
with a cadmium-reduction. NH4+ was measured using the phenol-hypochlorite method
(Solarzano, 1969).
Soil samples for organic matter and extractable nitrogen and phosphorous (n=3 per pool) were collected with a metal soil auger to a depth of 10 cm. These samples were frozen at -20°C until analysis. To extract NO3- and NH4+, 5 g subsamples were shaken with 2M KCL, centrifuged and
then filtered. NO3- was measured using a Lachat Quickchem 8500 autoanalyzer with a cadmium
reduction (Lachat, 2003) and extractable NH4+ was measured using the phenol-hypochlorite
method (Solarzano, 1969). Soil phosphorous was determined using two 0.1 g subsamples, one for total phosphorous (TP) and inorganic phosphorous (IP). The samples were mixed with 0.5 mL of Mg(NO3)2 and combusted for two hours at 550°C. Ten ml of 1N HCl was added to all
11
The plant community within each pool was determined by measuring the percent cover of each species in the entire pools. This was done prior to implementation of treatments on June 2 2014, and again in August 2014, and three times in 2015, May 26, July 7, and August 16. In 2015, three data points within each pool were added to assess vegetation cover at a smaller scale. A 1 m2 quadrat was placed down in three locations within each pool and percent cover of all species was determined.
Microalgal biomass was assessed using two methods that were designed to determine the benthic algae on the soil surface and the periphyton colonization on structures within the pools. Benthic chlorophyll a was measured as a proxy for benthic microalgal biomass. Surface sediment
samples were taken on June 3, 2014, and June 1 and August 15, 2015 with a 5 cc syringe corer to a depth of 1 cm, immediately placed in 15 ml centrifuge tubes, wrapped in aluminum foil, and placed on ice in the dark. Samples were stored at -80°C and analyzed within 30 days. Six mL of 90% acetone was added to each tube which was then shaken, prior to sonication for three - one minute intervals. Following a 24 h extraction at -20°C, samples were shaken to resuspend and centrifuged for five minutes. Absorbance at 665 nm and 750 nm was measured on a Shimadzu 1800 spectrophotometer before and after acidification and the chlorophyll a
concentration calculated according to Lorenzen, 1967.
Periphyton was measured based on EPA Water: Bioassessment Chapter 6, Periphyton Protocol using the adaptation of Rosemond et al., 1993 and Stevenson and Bahls, 1999. While natural substrate is preferred for colonization, it is much more difficult to accurately assess biomass on a heterogeneous natural surface (Stevenson and Bahls, 1999). As a result, I used 2.5 cm x 2.5 cm clay tiles, which were chosen over other artificial substrates as they harbor the highest
biodiversity of periphyton (Tuchman and Stevenson, 1980). I placed 3 tiles randomly in each pool, in pools with shade treatment the tiles were placed beneath the cloth. After 3 weeks, the entire tile was collected and placed in a 60 ml centrifuge tube, wrapped in aluminum foil, and placed on ice until storage at -80°C. Chlorophyll a was measured as above, except that 10 mL of 90% acetone was necessary to cover the tile completely.
12
in 100% ethanol. Epifauna were sampled by agitating the water with a kicknet for 1 minute while traveling along a 5 meter transect (Le Viol, 2009). Invertebrates were isolated and preserved as above. Individuals were identified to the lowest practical taxonomic level using guidebooks of freshwater macroinvertebrates in the northeastern US, with the aid of a dissecting microscope (Merritt et al., 2008; Peckarsky, 1990). Both samples from each pool were combined and the Shannon-Weiner Diversity Index was calculated. Amphibian populations were estimated using egg mass observation and quantifying tadpole presence. For eggs, a two person observation, as adapted from the technical reports of Faccio, 2010, and Paton, Timm, and Tupper, 2003, was performed. In the field, an assistant wrote down all egg masses I observed for half of each pool, and then for the second half the roles were reversed to eliminate observer bias. Tadpoles were identified and counted concurrent with macroinvertebrate kicknet sampling. The presence of amphibian egg masses or tadpoles during invertebrate sampling was noted in 2014 and tadpoles collected while using the kicknet were counted, identified and released.
Statistical Analysis
To statistically interpret the differences between natural and control treatment created vernal pools a repeated measures ANOVA was performed for all measured parameters, except leaf litter parameters which were analyzed using a one way ANOVA. To statistically analyze the
differences between the experimental treatments I performed repeated measures ANOVA and paired t post hoc test. Macroinvertebrate community was also analyzed using a discriminant canonical correlation analysis. All data was tested for normality using JMP 12 software.
To see how the treatments are effective at bringing the created pools closer to the function of natural pools, a principal component analysis was conducted with JMP 12 software. One PCA was performed which included environmental variables, such as chlorophyll a, soil and water nutrient concentrations and soil organic matter, plant community, including total cover of invasive species, woody species, and emergent cover, and macroinvertebrate community, which included all macroinvertebrate diversity and. The data was separated by year and a row-wide estimation was used.
13
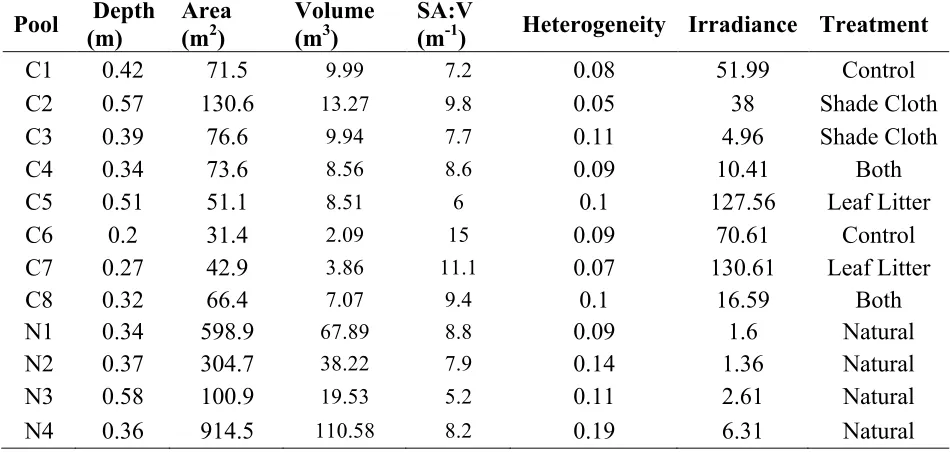
Using JMP 12 there were differences found in the physiochemical and biological variables of each pool, created (Table 2; Table 3) and natural (Table 3). All created vernal pools were found to be approximately elliptical on the surface and the depth profile was semi-circular. The natural vernal pools had varying depths and shapes with more heterogeneous bottom (p=0.025). The surface area (SA) and volume (V) were smaller in created pools than in all natural pools, but the SA: V ratio was comparable between both sets of pools (Table 1). The water depths of all vernal pools vary greatly over time (Figure 2).
Leaf Litter
The natural pools had greater inputs of leaf litter. There was significantly more carbon per basket (p<0.001) than created pools (Table 4), as a result of the greater overall mass of leaves falling into the natural pools. The average carbon falling into to the natural pools was 0.15 kgm-2 .C, but in the created pools this number was less than 0.004 kgm-2. C (Table 4).
14 Nutrients
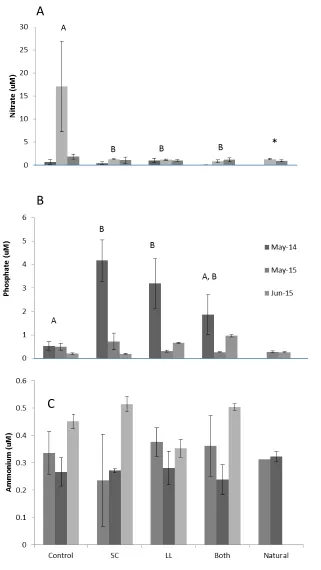
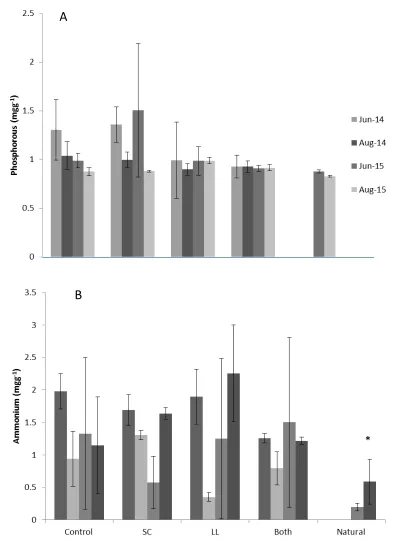
Nitrate concentrations in surface water were significantly different among the treatments (p=0.016) and between natural pools. Surface water nitrate was significantly higher in control pools (Figure 3A). Phosphate concentrations were also significantly different (p<0.0001) among the treatments (Figure 3B). Shade Cloth pools, and Both pools were not significantly different, and Control pools and Both pools were not significantly different, but Shade Cloth pools and Control pools were different. Natural pools and control pools were not significantly different. Ammonium concentrations were significantly different (p=0.0384) among treatments, but there was also a significant interaction between time and treatment (p=0.0045). May 2014 was
different than May 2015 (p=0.0041) and June 2015 (p=0.0038). May and June of 2015 were not significantly different than each other (p=0.8051).
There were no differences in soil phosphorus or extractable ammonium among treatments or between natural and created pools. Soil phosphorous was not significantly different among any treatment (p=0.49 and p=0.22, respectively; Figures 4B and 4C).
Organic Matter
Soil organic matter was found to be significantly different among treatments, p=0.020 (Figure 5). In the created pools, there were also temporal differences in organic matter. From June 2014 to August 2014, all treatments nearly doubled the amount of soil organic matter. The natural pools had lower levels of organic matter than control pools. Organic matter content in natural pools was more constant than any of the created pools.
Invasive Plant Cover
15
For Typha latifolia (Figure 7A) and Phalaris arundinacea (Figure 7B), there were no significant differences among treatments (p=0.124 and p=0.562, respectively). For Lythrum salicaria, however, (Figure 7C) Shade and Control pools are significantly greater than Both and Leaf Litter pools (p=0.001). There is a time*treatment interaction where Shade Cloth pools are significantly greater during May 2015(p=0.002).
Chlorophyll a
There was substantial temporal variability in benthic microalgal chlorophyll a in the created pools that was not observed in the natural pools, which were consistently lower than the Control created pools (p=0.0035; Figure 8A) and similar between sampling dates. There was a
significant difference (p=0.0449) among treatments in benthic microalgae biomass, where control pools were higher (Figure 8B). Periphyton biomass was also temporally variable in the created pools, but there were more consistent differences among treatments (p=0.0015; Figure 8B). The control pools were again significantly higher than the natural pools (p<0.001).
Macroinvertebrates
The macroinvertebrate species richness was marginally greater (p = 0.054) in created (S =3.9) than natural pools (S=3; Table 6; Figure 9). In general, from 2014 to 2015 there was a decrease in individuals and in total number of species of macroinvertebrates (Figure 9). I found no differences in total abundance (p=0.3993) or diversity (p=0.3001) between created and natural pools.
16 Amphibians
In 2014, prior to the implementation of the amphibian study, two egg masses from Wood Frogs (Rana sylvatica) and one from the American Toad (Bufo americanus) were observed in pool C8. In 2015, no egg masses were observed in any of the created or natural pools. Tadpoles were found in pools C1, C3 and C5, but not in any natural pools (Table 8). Rana sylvatica tadpoles were found in C5, a Leaf Litter pool (3 tadpoles), and in C3, a Shade Cloth pool (2 tadpoles).
Bufo americanus tadpoles, 2, were found in C1, a control pool. I found no tadpoles in the remaining five pools.
Principal Components Analysis
In Figure 11, the score plots from the PCA are shown. The plant community (Figure 11A) in the natural pools has very little variability, but all created pools have a lot of variability, based on how spread the points are on the figure and none of the treatments are closest to the natural pools. Both pools are closest to the natural pools, with Shade Cloth and Leaf Litter pools following. Control pools were the farthest from the natural pools, indicating the most differences in environmental variables. For macroinvertebrate community (Figure 12C), there was a
temporal difference, where in general all 2015 points were closer than 2014 points. In 2015, all pools were negative in component 1 but in 2014, there was much more variation and most were positive in component 1.
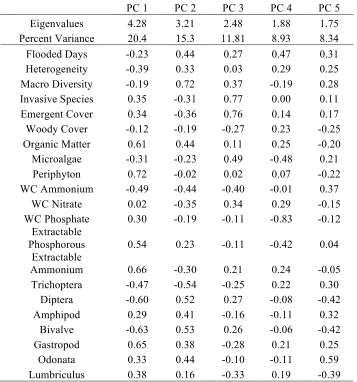
The loading matrix (Table 9) shows how heavily each variable in the overall PCA is weighted for the first four components and whether it is positive or negative. Variables in the first component that are weighted heavily are organic matter, emergent plant cover, periphyton, soil phosphorus, soil ammonium, T. latifolia, P. arundinacea, L. salicaria, S. putris, and P. armigera
in the positive direction, in the negative direction is surface heterogeneity, water ammonium,
Limnephilus sp., E. tenax, and S. occidentale. In the second component, variables heavily weighted in the positive direction includes Prionocyphon sp., Macromia sp., A.
17
flooded days. In the negative direction, P. armigera, macroalgae, Cornus sp., and woody cover are heavily weighted.
Discussion
This study examined the nutrient and organic matter levels within the soil and water, the animal diversity, and plant cover of eight created vernal pools and four natural pools. The combined effect of Leaf Litter and Shade Cloth had the greatest effect, bringing these pools to a more similar functional state to the natural pools s. The treatments were also successful at prohibiting regrowth of invasive species, which impacts the physicochemical and biological characteristics of the pools.
Impact of Hydrology on Factors within Pools
The depth of the natural pools varied spatially within each pool, while the created pools were more regular and bowl shaped. The greater heterogeneity of the natural pools creates more diversity of habitats and small-scale hydrological differences, leading to greater biodiversity (Bauder, 2005). The slightly larger SA:V ratio indicates that there is more interaction between the benthic environment and the water column when flooded, although this effect was
minimal. However, this can impact nutrient cycling within the pool, as levels of oxygen and water may be more variable.
The month of May 2015 was anomalously warm and dry relative to typical western New York state weather (NOAA Physical Sciences Division). The reduced precipitation combined with greater evaporation likely resulted in less water in the pools, in the surrounding hyporheic zone and in the groundwater, accounting for the drop in water levels that occurred towards the end of May 2015. In contrast to the hot and dry May, June 2015 was cooler and wetter than average (NOAA Physical Sciences Division), resulting in a refilling of pools from heavy rains and low evaporation. The pools were inundated until the end of July when they all desiccated within a week and remained dry for the remainder of the season. Differences in inundation length among different vernal pools are greater in years with greater precipitation (Bauder, 2005). In 2014, all of the created pools dried completely only once, as opposed to 2015 where many dried
18
organisms within the pool. The decreased diversity of macroinvertebrates and smaller numbers of amphibians in the created pools between 2014 and 2015 is likely a result of these interannual weather patterns between years. Since many of the pools nearly dried up, or were less than 0.1 m deep at this critical time for macroinvertebrates and amphibians, many aquatic organisms within the pools may have been unable to survive.
Organic matter and nutrient dynamics
The natural pools had significantly more carbon input in the form of leaves. This input of carbon can provide nutrients and organic matter to the pools, and serve as habitat for organisms such as macroinvertebrates and amphibians. As a result, the leaf litter input is the base of the food web in the natural pools. In contrast, the created pools were dominated by herbaceous plants and algae, which provide a different food source and structurally different habitat. The results of this are seen in the macroinvertebrate communities found in the two types of pools. Eristalis tenax
larvae, found only in the natural pools, are known to inhabit waters with high levels of organic matter (Aguilera et al., 1999). Similarly, case maker caddisflies (Limnephilus sp. larvae), were found in both natural and created pools, but were nearly 2x more abundant in natural pools. This taxa requires organic materials to build a protective case and are likely more abundant in natural pools because of the greater leaf litter inputs; these organic casings are better able to retain water and thus, they are often found in temporary pools (Zamora-Munoz and Svenson, 1996). In Leaf Litter treatment pools, there wasn’t a consistent effect on this species. It is likely that there are interactions with other variables, such as light, water depth, and nutrient concentrations, limiting the growth of these animals, as well as low recruitment to the new pools. Gammarus, common taxa found in the created pools but not in the natural pools, is less susceptible to pollution than
Limnephilus (Schulz and Liess, 1999). The high prevalence of Gammarus and lower prevalence of Limnephilus in the created pools may indicate more polluted waters in the created pools.
19
Within vernal pools the amount of organic matter relative to nutrients, like nitrogen, affects the community within the pool. The sensitivity of vernal pools to disturbance, particularly nutrient loading, complicates restoration efforts aimed at achieving lost ecosystem functions. Such high and varied levels of organic matter in the created pools (Figure 6) may be the result of greater levels of benthic microalgae, or other photosynthetic organisms, such as Lemna minor
(Duckweed) captured within the soil sample. Many of the created pools were covered in L. minor and also had more benthic microalgal biomass (Figure 8). The accumulation of this organic matter is a primary form of pedogenesis in vernal pools (Hobson and Dahlgren, 1998). This has implications for the soil types of the vernal pools in the future, and the high levels of organic matter may indicate that the created vernal pools are in the process of forming soils closer to the natural pools.
The potential for eutrophication can cross through from the aquatic phase to the terrestrial phase of vernal pools (Kneitel and Lessin, 2009). This can alter biological community, and can
account for some of the differences among the pools. Land use surrounding ephemeral wetlands, including the upland forest, has a significant impact on vernal pool ecology and biogeochemistry (Bedard-Haughn et al., 2006). In general, the natural pools were less variable between sampling dates for nitrate, phosphate and ammonium because there is less anthropogenic disturbance immediately surrounding them. There is a golf course adjacent to the created pools at HANA, and there is potential for nutrient-enriched runoff from surface and groundwater, which can cause some of the variability in nutrient levels over time. Created pools 1-3 are also located closest to a road, which can result in polluted runoff.
Natural pools had lower levels of ammonium, which may contribute to the low levels of plant cover, benthic microalgae and periphyton relative to the created pools where nutrients were higher. Paired with higher ammonium levels, the created pools in general received more light, even with the shade cloth treatment. Higher levels of irradiance allow for direct photosynthetic activity within the pools, as opposed to in the canopy above as is seen in the natural pools, and may support algae and herbaceous plants with high light requirements in contrast to the low-light ferns and saplings found in the natural pools.
20
Addition of shade and leaf litter may inhibit invasive species colonization during vernal pool restoration. Although the invasive plant regrowth was relatively high initially after cutting and implementation of the treatment, over time there was a steady decline in invasive cover in shade treatments suggesting an important role of shade in reducing invasive species colonization.
Individual invasive species responded differently to the treatments, though. There was an increase in L. salicaria in all treatments between 2014 and 2015, which was also observed in nearby systems (Tyler et al. unpub. data). However, the two Leaf Litter treatments demonstrated some resistance to regrowth of this species, suggesting that addition of organic material may help to deter colonization. Typha latifolia and Phalaris arundinacea did not respond to any of the treatments significantly. T. latifolia cover was low prior to removal, and the small cover that regrew is not likely a threat. P. arundinacea was also not different among any treatments because it was highly variable among pools. Pools with the highest cover of this species were located closest to a large emergent wetland that has high cover of many invasive species, such as
L. salicaria,T. latifolia and P. arundinacea (Tyler et al. unpub. data) and likely serves as a seed source.
Noninvasive plants found within both complexes of pools differed. The natural pools had ephemeral plants in the surrounding land area, including Erythronium americanum (Trout Lily),
Podophyllum spp. (Mayapple), and Arisaema triphyllum (Jack-in-the-pulpit). Ephemeral plants have the potential to alter system-level nutrient fluxes at rates higher than previously expected (Blank et al., 1980). These plants support the vernal dam hypothesis, in which nutrients that would have been lost from the system are kept there through temporary plants which initially take in nutrients but then release them back when they stop growing after the spring. This is another potential cause for steady nutrient levels within the natural pools.
21 Interactions among Variables
The PCA illustrates clear differences between the natural and the created pool that are characterized by organic matter, invasive species, emergent plant cover, periphyton, soil phosphorus and ammonium, were loaded positively in the first component. Invasive species were found with high levels of soil nutrients in the created pools, which support findings in previous studies linking invasive species to high levels of nutrients (Ehrenfeld, 2003). The high organic matter levels may be a result of invasive species, where their litter has high
decomposition rates (Ehrenfeld, 2003). It is likely that the organic matter values are high also because the soil contained high levels of periphyton, as demonstrated by the loading values. The high nutrient levels in the soil allowed for periphyton to colonize an area. Negatively in
component 1, were heterogeneity, water ammonium, Limnephilus sp., E. tenax, and S. occidentale, all characteristic of the natural pools. The more heterogeneous surface of the natural pools, allowed for more macroinvertebrate species, as demonstrated by the loadings.
In principal component two, loaded heavily in the positive direction were Prionocyphon sp.,
Macromia sp., A. plantago-aquatica, emergent plant cover, invasive species cover,
macroinvertebrate diversity, and number of flooded days. Emergent plant cover is likely linked to invasive species cover as a result of other variables within the pools that allow for greater plant growth. Invasive species growth and cover has been linked to improper hydroperiod, as they are more adaptable to variations in water level (Miller and Zedler,
2003). Macroinvertebrates are also related to number of flooded days, as it allows more time for development from larvae to adult. Negatively in component 2, P. armigera, Cornus sp.,
macroalgae, and woody cover were heavily weighted. The high cover of macroalgae may prevent emergent plant species, which is why there is only woody species cover, including
Cornus. This component suggests a trajectory of development related to flooding duration and the dominant vegetation type, with flooding promoting macroalgal growth and woody species.
There was far less variation in environmental variables or plant communities in natural pools than created pools, in general and among treatments. Both treatment pools, followed by Shade Cloth and Leaf Litter pools had the most similar environmental variables, plant and
22
interaction of shade and organic matter inputs were the most effective, showing that in open and closed canopy pools the differences in light and organic matter are both important, and neither factor alone is enough.
Overall, vernal pool creation is a viable option for restoring these critical ecosystems that have been lost. Better management strategies and practices are needed to ensure they function more similarly to an undisturbed natural vernal pool. Canopy cover is a main determinant of the function of vernal pools, and thus, it is of utmost importance in managing these vital ecosystems. Implementing treatments to imitate a forest canopy can alter the biogeochemistry and biotic community composition of a created vernal pool. The findings from this study can be used in future vernal pool creation or restoration projects. Installing treatments that simulate canopy cover may also facilitate invasive species removal in created pools. Invasive species removal has been a great challenge as the threat of invasive species is high in wetland creation projects and there are few known ways to completely remove invasive species. The findings from this study can be used for invasive species removal, where shade, organic matter inputs, or a combination of the two can be used as a supplement to manual removal. This has implications for
biodiversity, as well as various other environmental factors that may be impacted by the presence of invasive plants.
Conclusions
23
[image:28.612.71.546.149.375.2]Tables
Table 1: Maximum depth and surface area of each pool measured at the peak of spring
flooding on May 22, 2014 for the created pools and April 24, 2015 for the natural pools.
Pool Depth (m)
Area (m2)
Volume (m3)
SA:V
(m-1) Heterogeneity Irradiance Treatment
C1 0.42 71.5 9.99 7.2 0.08 51.99 Control
C2 0.57 130.6 13.27 9.8 0.05 38 Shade Cloth
C3 0.39 76.6 9.94 7.7 0.11 4.96 Shade Cloth
C4 0.34 73.6 8.56 8.6 0.09 10.41 Both
C5 0.51 51.1 8.51 6 0.1 127.56 Leaf Litter
C6 0.2 31.4 2.09 15 0.09 70.61 Control
C7 0.27 42.9 3.86 11.1 0.07 130.61 Leaf Litter
C8 0.32 66.4 7.07 9.4 0.1 16.59 Both
N1 0.34 598.9 67.89 8.8 0.09 1.6 Natural
N2 0.37 304.7 38.22 7.9 0.14 1.36 Natural
N3 0.58 100.9 19.53 5.2 0.11 2.61 Natural
24
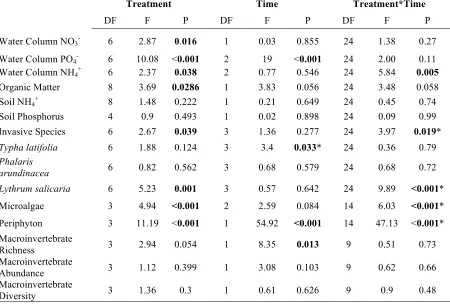
Table 2: Repeated measures ANOVA results for the comparisons among treatments, time and the interaction between treatment and time.
Treatment Time Treatment*Time
DF F P DF F P DF F P
Water Column NO3- 6 2.87 0.016 1 0.03 0.855 24 1.38 0.27
Water Column PO4- 6 10.08 <0.001 2 19 <0.001 24 2.00 0.11
Water Column NH4+ 6 2.37 0.038 2 0.77 0.546 24 5.84 0.005
Organic Matter 8 3.69 0.0286 1 3.83 0.056 24 3.48 0.058 Soil NH4+ 8 1.48 0.222 1 0.21 0.649 24 0.45 0.74
Soil Phosphorus 4 0.9 0.493 1 0.02 0.898 24 0.09 0.99 Invasive Species 6 2.67 0.039 3 1.36 0.277 24 3.97 0.019*
Typha latifolia 6 1.88 0.124 3 3.4 0.033* 24 0.36 0.79
Phalaris
arundinacea 6 0.82 0.562 3 0.68 0.579 24 0.68 0.72 Lythrum salicaria 6 5.23 0.001 3 0.57 0.642 24 9.89 <0.001* Microalgae 3 4.94 <0.001 2 2.59 0.084 14 6.03 <0.001* Periphyton 3 11.19 <0.001 1 54.92 <0.001 14 47.13 <0.001* Macroinvertebrate
Richness 3 2.94 0.054 1 8.35 0.013 9 0.51 0.73 Macroinvertebrate
Abundance 3 1.12 0.399 1 3.08 0.103 9 0.62 0.66 Macroinvertebrate
25
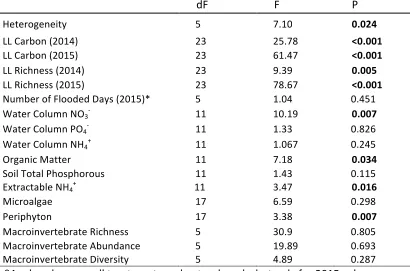
Table 3: Results of the one-way ANOVA comparing natural and created pools.
dF F P
Heterogeneity 5 7.10 0.024
LL Carbon (2014) 23 25.78 <0.001
LL Carbon (2015) 23 61.47 <0.001
LL Richness (2014) 23 9.39 0.005
LL Richness (2015) 23 78.67 <0.001
Number of Flooded Days (2015)* 5 1.04 0.451
Water Column NO3- 11 10.19 0.007
Water Column PO4- 11 1.33 0.826
Water Column NH4+ 11 1.067 0.245
Organic Matter 11 7.18 0.034
Soil Total Phosphorous 11 1.43 0.115
Extractable NH4+ 11 3.47 0.016
Microalgae 17 6.59 0.298
Periphyton 17 3.38 0.007
Macroinvertebrate Richness 5 30.9 0.805
Macroinvertebrate Abundance 5 19.89 0.693
Macroinvertebrate Diversity 5 4.89 0.287
*Analyzed among all treatments and natural pools, but only for 2015 values.
Table 4: Species richness of leaf fall and calculated carbon input (g m-2) in created and natural
pools (Mean ±SE).
Created Natural
2014 S 2.3±0.3 4.8±0.8
Carbon 3.4±1.2 39.3±7.3
2015 S 2.4±0.2 6±0.4
[image:30.612.71.505.497.573.2]26
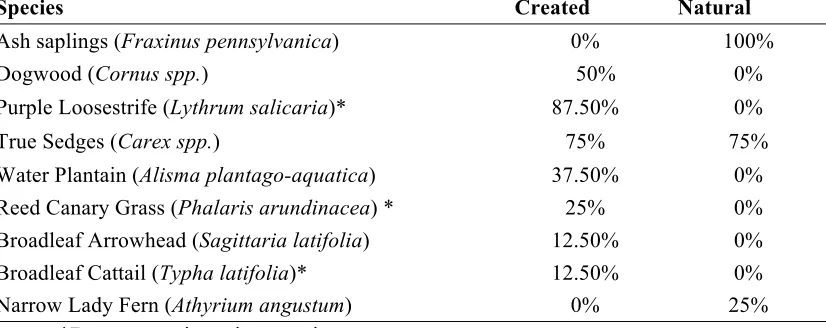
Table 5: Occurrence of herbaceous and woody plants in created (n=8) and natural (n=4) vernal pools at High Acres Nature Area. Values are the percent of pools in which the species was found. Created pools were assessed in June 2014, prior to cutting of invasive plants and implementation of experimental treatments; natural pools were assessed monthly from May through August 2015.
Species Created Natural
Ash saplings (Fraxinus pennsylvanica) 0% 100%
Dogwood (Cornus spp.) 50% 0%
Purple Loosestrife (Lythrum salicaria)* 87.50% 0%
True Sedges (Carex spp.) 75% 75%
Water Plantain (Alisma plantago-aquatica) 37.50% 0% Reed Canary Grass (Phalaris arundinacea) * 25% 0% Broadleaf Arrowhead (Sagittaria latifolia) 12.50% 0% Broadleaf Cattail (Typha latifolia)* 12.50% 0%
Narrow Lady Fern (Athyrium angustum) 0% 25%
27
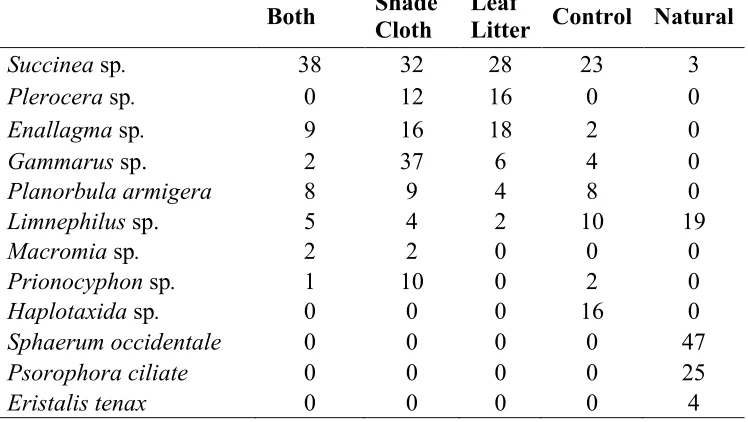
Table 6: Total number of individuals of macroinvertebrate taxa present in the created (n=4) and natural pools (n=4). Created pools contain pooled data from the two pools for 2014 and 2015, n=4, and four natural pools only from 2015, n=4.
Both Shade Cloth Leaf Litter Control Natural
Succinea sp. 38 32 28 23 3
Plerocera sp. 0 12 16 0 0
Enallagma sp. 9 16 18 2 0
Gammarus sp. 2 37 6 4 0
Planorbula armigera 8 9 4 8 0
Limnephilus sp. 5 4 2 10 19
Macromia sp. 2 2 0 0 0
Prionocyphon sp. 1 10 0 2 0
Haplotaxida sp. 0 0 0 16 0
Sphaerum occidentale 0 0 0 0 47
Psorophora ciliate 0 0 0 0 25
Eristalis tenax 0 0 0 0 4
Table 7: Bray Curtis dissimilarity values comparing all treatments, where C is control, SC is shade cloth, LL is leaf litter, B is both, and N is natural.
Plant Macroinvertebrate
C-SC 0.64 0.46
C-LL 0.40 0.47
C-B 0.58 0.33
SC-LL 0.48 0.67
SC-B 0.62 0.51
LL-B 0.22 0.52
C-N 0.83 0.89
SC-N 0.85 0.93
LL-N 0.96 0.95
[image:32.612.72.295.408.572.2]28
Table 8: Amphibian tadpoles and adults observed within each treatment.
Control Shade Cloth Leaf Litter Both Natural
American Toad (Bufo americanus) 2 *
Wood Frog (Rana sylvatica) 2 3
Northern Leopard Frog(Rana pipiens) * *
Gray Tree Frog (Hyla versicolor) * *
Bullfrog (Rana catesbeiana) *
29
Table 9: Loading matrix from principal components analysis for the first five components with eigenvalues greater than 1.
PC 1 PC 2 PC 3 PC 4 PC 5
Eigenvalues 4.28 3.21 2.48 1.88 1.75 Percent Variance 20.4 15.3 11.81 8.93 8.34 Flooded Days -0.23 0.44 0.27 0.47 0.31 Heterogeneity -0.39 0.33 0.03 0.29 0.25 Macro Diversity -0.19 0.72 0.37 -0.19 0.28 Invasive Species 0.35 -0.31 0.77 0.00 0.11 Emergent Cover 0.34 -0.36 0.76 0.14 0.17 Woody Cover -0.12 -0.19 -0.27 0.23 -0.25 Organic Matter 0.61 0.44 0.11 0.25 -0.20 Microalgae -0.31 -0.23 0.49 -0.48 0.21
Periphyton 0.72 -0.02 0.02 0.07 -0.22 WC Ammonium -0.49 -0.44 -0.40 -0.01 0.37
WC Nitrate 0.02 -0.35 0.34 0.29 -0.15 WC Phosphate 0.30 -0.19 -0.11 -0.83 -0.12
Extractable
Phosphorous 0.54 0.23 -0.11 -0.42 0.04 Extractable
Ammonium 0.66 -0.30 0.21 0.24 -0.05 Trichoptera -0.47 -0.54 -0.25 0.22 0.30
Diptera -0.60 0.52 0.27 -0.08 -0.42 Amphipod 0.29 0.41 -0.16 -0.11 0.32
Bivalve -0.63 0.53 0.26 -0.06 -0.42 Gastropod 0.65 0.38 -0.28 0.21 0.25
30
Figures
31
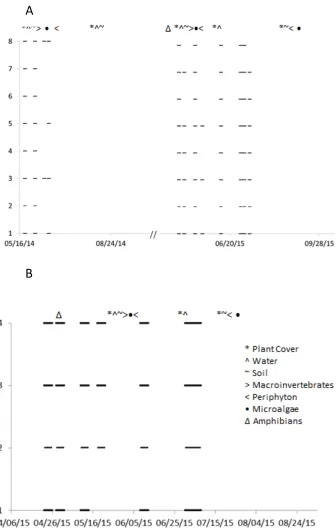
Figure 2: Length and frequency of flooding in A), created and B) natural pools paired with
frequency and timing of sampling.
A
32
Figure 3: Surface water concentration of A) nitrate, B) phosphate, and C) ammonium over time
in all treatments.
A
B
C
A
33
Figure 5: Extractable A) Phosphorus, and B) Ammonium concentrations per gram of soil at each
sampling date among all treatments.
A
B
34
Figure 6: Percent organic matter in soils from all pools at different sampling times.
Figure 7: Invasive species percent cover over time for each treatment
[image:39.612.75.503.385.624.2]35
Figure 8: Individual cover of A) Typha, B) Phalaris arundinacea, and C) Lythrum salicaria over time. Note different y-axes.
A
B
36
Figure 9: A) Benthic micro-algal biomass using chlorophyll a as a proxy B) Periphyton biomass using chlorophyll a as a proxy in experimental created pools and natural pools.
A
37
Figure 10: Macroinvertebrate results among all treatments showing A) species richness (S), B) total number of individuals, and C) Shannon-Weiner diversity index results.
A
B
38
Figure 11: Cluster diagram showing similarity of A) plant and B) macroinvertebrate communities in all pool, by treatment and year.
A
39
40
References
Aerts, Rien. “Climate, Leaf Litter Chemistry and Leaf Litter Decomposition in Terrestrial Ecosystems.pdf.”
OIKOS 79.3 (1997): 439–449. Print.
Angeloni, Nicholas et al. “Effects of an Invasive Cattail Species (TyphaX Glauca) on Sediment Nitrogen and Microbial Community Composition in a Freshwater Wetland.” 2006 : n. pag. Print.
Balcombe, Collin et al. “Balcombe et Al 2005 Wetlands Comp of Plant Communities in Mit and Ref Wetlands Midappalachians.pdf.” Wetlands 25.1 (2005): 130–142. Print.
Batzer, Darold P et al. “Evaluating Regional Differences in Macroinvertebrate Communities from Forested Depressional Wetlands across Eastern and Central North America Evaluating Regional Differences in Macroinvertebrate Communities from Forested Depressional Wetlands across Easte.” 24.2 (2005): 403–414. Print.
Bauder, E. T. “The Effects of an Unpredictable Precipitation Regime on Vernal Pool Hydrology.”
Freshwater Biology 50.12 (2005): 2129–2135.
Bedard-Haughn, Angela, Amanda L. Matson, and Dan J. Pennock. “Land Use Effects on Gross Nitrogen Mineralization, Nitrification, and N2O Emissions in Ephemeral Wetlands.” Soil Biology and Biochemistry 38.12 (2006): 3398–3406. Web. 26 May 2014.
Berven, K. a. “Factors Affecting Population Fluctuations in Larval and Adult Stages of the Wood Frog (Rana Sylvatica).” Ecology 71.July (1990): 1599–1608.
Bischof, Matthew M. et al. “Invertebrate Community Patterns in Seasonal Ponds in Minnesota, USA: Response to Hydrologic and Environmental Variability.” Wetlands 33.2 (2013): 245–256. Web. 19 Feb. 2014.
Black, Charles, and Paul Zedler. “An Overview of 15 Years of Vernal Pool Restoration and Construction Activities in San Diego County , California.” Ecology, Conservation, and Management of Vernal Pool Ecosystems. Ed. CW Witham et al. Vol. 92182. San Diego: N. p., 1998. 195–205. Print.
Blank, James L., Richard K. Olson, and Peter M. Vitousek. “Nutrient Uptake by a Diverse Spring Ephemeral Community.” Oecologia 47.1 (1980): 96–98.
Boening, Dean W. “Ecological Effects, Transport, and Fate of Mercury: A General Review.” Chemosphere
40.12 (2000): 1335–1351.
Bonner, Lisa A, Walter J Diehl, and Ronald Altig. “Physical , Chemical and Biological Dynamics of Five Temporary Dystrophic Forest Pools in Central Mississippi.” Hydrobiologia 353 (1997): 77–89. Print. Boston, H. L., and W. R. Hill. “Photosynthesis-Light Relations of Stream Periphyton Communities.”
Limnology and Oceanography 36.4 (1991): 644–656.
Brinson, Mark. A Hydrogeomorphic Classification for Wetlands. N. p., 1993. Print.
Brooks, Robert T. “Weather-Related Effects on Woodland Vernal Pool Hydrology and Hydroperiod.”
Wetlands 24.1 (2004): 104–114. Print.
Brooks, Robert T. “Annual and Seasonal Variation and the Effects of Hydroperiod on Benthic
Macroinvertebrates of Seasonal Forest (‘vernal’) Ponds in Central Massachusetts, USA.” Wetlands
20.4 (2000): 707–715.
Brooks, Robert T. “Potential Impacts of Global Climate Change on the Hydrology and Ecology of
Ephemeral Freshwater Systems of the Forests of the Northeastern United States.” Climatic Change
41
Brooks, Robert T.,Eggert, Susan L., Nislow, Keith H., Kolka, Randall K., Chen, Celia Y., and Ward, Darren M. “Preliminary Assessment of Mercury Accumulation in Massachusetts and Minnesota Seasonal Forest Pools.” Wetlands 32.4 (2012): 653–663. Web. 19 Feb. 2014.
Brooks, Robert T., and Masaki Hayashi. “Depth-Area-Volume and Hydroperiod Relationships of Ephemeral (vernal) Forest Pools in Southern New England.” Wetlands 22.2 (2002): 247–255. Calhoun, A J K, J Arrigoni, and R P Brooks. “Creating Successful Vernal Pools : A Literature Review and
Advice for Practitioners.” (2014): 1027–1038.
Campbell, Deborah A, Charles Andrew Cole, and Robert P Brooks. “A Comparison of Created and Natural Wetlands in Pennsylvania , USA.” (2002): 41–49. Print.
Capps, Krista a. et al. “Biogeochemical Hotspots in Forested Landscapes: The Role of Vernal Pools in Denitrification and Organic Matter Processing.” Ecosystems (2014): n. pag. Web. 19 Oct. 2014. Carrino-kyker, Author Sarah R, Andrew K Swanson, and Sarah R Carrino-kyker. “Seasonal Physiochemical
Characteristics of Thirty Northern Ohio Temporary Pools along Gradients of GIS-Delineated Human Land-Use.” Wetlands 27.3 (2007): 749–760. Print.
Collinson, N.H. et al. “Temporary and Permanent Ponds: An Assessment of the Effects of Drying out on the Conservation Value of Aquatic Macroinvertebrate Communities.” Biological Conservation 74.2 (1995): 125–133.
Costanza, Robert, Rudolf de Groot, et al. “Changes in the Global Value of Ecosystem Services.” Global Environmental Change 26 (2014): 152–158. Web. 9 July 2014.
Costanza, Robert, Ralph d’Arge, et al. “The Value of the World’s Ecosystem Services and Natural Capital.” Nature 387.6630 (1997): 253–260.
Crooks, Jeffrey a., Andrew L. Chang, and Gregory M. Ruiz. “Aquatic Pollution Increases the Relative Success of Invasive Species.” Biological Invasions 13.1 (2010): 165–176. Web. 15 Sept. 2014. De Meester, Luc et al. “Ponds and Pools as Model Systems in Conservation Biology, Ecology and
Evolutionary Biology.” Aquatic Conservation: Marine and Freshwater Ecosystems 15.6 (2005): 715– 725. Web. 22 Mar. 2014.
De Weese, June M. “Vernal Pool Construction Monitoring Methods and Habitat Replacement
Evaluation.” Ecology, Conservation, and Management of Vernal Pool Ecosystems. Vol. 95825. N. p., 1996. 217–223. Print.
Ehrenfeld, Joan G. “Effects of Exotic Plant Invasions on Soil Nutrient Cycling Processes.” Ecosystems 6.6 (2003): 503–523. Web. 9 Nov. 2013.
Faccio, Steven D. Using Egg Mass Surveys to Monitor Productivity and Estimate Population Sizes of Three Pool-Breeding Amphibians at Marsh-Billings-Rockefeller National Historical Park. N. p., 2011. Print. Gerhardt, Fritz, and Sharon K Collinge. “Exotic Plant Invasions of Vernal Pools in the Central Valley of
California , USA.” (2003): 1043–1052. Print.
Hayashi, M., and G. Van Der Kamp. “Simple Equations to Represent the Volume-Area-Depth Relations of Shallow Wetlands in Small Topographic Depressions.” Journal of Hydrology 237.1-2 (2000): 74–85. Hobson, W a, and R a Dahlgren. “Soil Forming Processes in Vernal Pools of Northern California , Chico
Area.” Ecology, Conser- vation, and Management of Vernal Pool Ecosystems – Proceedings from a 1996 Conference 8627 (1998): 24–37. Print.
42
Cycling.” Ecological Monographs 68.1 (1998): 121–149. Print.
Keeley, J. E. “Photosynthetic Pathway Diversity in a Seasonal Pool Community.” Functional Ecology 13.1 (1999): 106–118.
Keeley, Jon E. “CAM Photosynthesis in Submerged Aquatic Plants.” The Botanical Review 64.2 (1998): 121–175. Print.
Keeley, Jon E, and Darren R Sandquist. “Diurnal Photosynthesis Cycle in Cam and Non-Cam Seasonal-Pool Aquatic Macrophytes.” Ecologiy 72.2 (2014): 716–727. Print.
Kercher, Suzanne M., and Joy B. Zedler. “Flood Tolerance in Wetland Angiosperms: A Comparison of Invasive and Noninvasive Species.” Aquatic Botany 80.2 (2004): 89–102. Web. 23 Mar. 2014. King, Jamie L., Marie a. Simovich, and Richard C. Brusca. “Species Richness, Endemism and Ecology of
Crustacean Assemblages in Northern California Vernal Pools.” Hydrobiologia 328.2 (1996): 85–116. Kneitel, Jamie M., and Carrie L. Lessin. “Ecosystem-Phase Interactions: Aquatic Eutrophication Decreases
Terrestrial Plant Diversity in California Vernal Pools.” Oecologia 163.2 (2010): 461–469.
Korfel, Chelsea a. et al. “Hydrology, Physiochemistry, and Amphibians in Natural and Created Vernal Pool Wetlands.” Restoration Ecology 18.6 (2010): 843–854.
Lawrence, Beth a, and Joy B Zedler. “Formation of Tussocks by Sedges: Effects of Hydroperiod and Nutrients.” Ecological applications : a publication of the Ecological Society of America 21.5 (2011): 1745–59.
Lessin, Carrie L. “Nutrient Addition Effects on Vernal Pool Communities.” California State University, Sacramento, 2010. Print.
Lichko, Lesley E, and Aram J K Calhoun. “An Evaluation of Vernal Pool Creation Projects in New England: Project Documentation from 1991-2000.” Environmental management 32.1 (2003): 141–51. Web. 19 Aug. 2014.
Miller, Rebecca C, and Joy B Zedler. “Responses of Native and Invasive Wetland Plants to Hydroperiod and Water Depth.” Plant Ecology 167 (2003): 57–69. Print.
Mitsch, William J, and James G Gosselink. “THE VALUES OF WETLANDS : LANDSCAPES AND INSTITUTIONAL The Value of Wetlands : Importance of Scale and Landscape Setting.” 35.200 (2000): 25–33. Print.
Nicolet, P. “The Wetland Plant and Macroinvertebrate Assemblages of Temporary Ponds in England and Wales.” Biological Conservation 120.2 (2004): 261–278. Web. 5 Feb. 2014.
Paton, Peter W C, Brad Timm, and Todd Tupper. Monitoring Pond Breeding Amphibians. N. p., 2003. Paton, Peter W. C. “A Review of Vertebrate Community Composition in Seasonal Forest Pools of the
Northeastern United States.” Wetlands Ecology and Management 13.3 (2005): 235–246. Web. 27 Mar. 2014.
Preisser, Evan L. et al. “Vernal Pool Conservation in Connecticut: An Assessment and Recommendations.” Environmental Management 26.5 (2000): 503–513.
Reddy, K. R., and W. F. De Busk. “Nutrient Removal Potential of Selected Aquatic Macrophytes.” Journal of Environment Quality 14.4 (1985): 459.
Richard, T. L. 1992. “Municipal yard waste composting: an operator's guide.” A series of ten fact sheets. Cornell Resource Center, Ithaca, NY.
43
Periphyton: Effects of Nutrients and Herbivores.” Ecology 74.4 (1993): 1264–1280. Print.
Rubbo, Michael J., Jonathan J. Cole, and Joseph M. Kiesecker. “Terrestrial Subsidies of Organic Carbon Support Net Ecosystem Production in Temporary Forest Ponds: Evidence from an Ecosystem Experiment.” Ecosystems 9.7 (2006): 1170–1176. Web. 4 Apr. 2014.
Schiesari, Luis. “Pond Canopy Cover: A Resource Gradient for Anuran Larvae.” Freshwater Biology 51.3 (2006): 412–423. Web. 4 Apr. 2014.
Schulz, Ralf, and Mathias Liess. “Validity and Ecological Relevance of an Active in Situ Bioassay Using Gammarus Pulex and Limnephilus Lunatus.” Environmental Toxicology and Chemistry 18.10 (1999): 2243–2250.
Skelly, David K, Susan R Bolden, and L Kealoha Freidenburg. “Experimental Canopy Removal Enhances Diversity of Vernal Pond Amphibians.” Ecological applications : a publication of the Ecological Society of America 24.2 (2014): 340–5.
Solarzano. “Determination of Ammonia in Natural Waters by the Phenolhypochlorite Method.” (1969): 1–3.
Stevenson, By R Jan, and Loren L Bahls. “Chapter 6 Periphyton Protocols.” Rapid Bioassessment Protocols for Use in Streams and Wadeable Rivers: Periphyton, Benthic Macroinvertebrates, and Fish, Second Edition. N. p., 1999. 1–23. Print.
Stoler, Aaron B, and Rick a Relyea. “Bottom-up Meets Top-down: Leaf Litter Inputs Influence Predator-Prey Interactions in Wetlands.” Oecologia 173.1 (2013): 249–57. Web. 18 Sept. 2014.
Tuchman, Marc L, and R Jan Stevenson. “Comparison of Clay Tile, Sterilized Rock, and Natural Substrate Diatom Communities in a Small Stream in Southeastern Michigan, USA.” Hydrobiologia 79 (1980): 73–79. Print.
Verb, Robert G, Dale A Casamatta, and Morgan L Vis. “Effects of Different Vegetative Substrates on Algal Composition in Vernal Mesocosms.” Hydrobiologia 455 (2001): 111–120. Print.
Zamora-Muñoz, C, and B.W Svensson. “Survival of Caddis Larvae in Relation to Their Case Material in a Group of Temporary and Permanent.” Freshwater Biology 36.December (1996): 23–31.