White Rose Research Online URL for this paper:
http://eprints.whiterose.ac.uk/136607/
Version: Published Version
Monograph:
Walker, Simon Mark orcid.org/0000-0002-5750-3691, Sculpher, Mark
orcid.org/0000-0003-3746-9913, Claxton, Karl Philip orcid.org/0000-0003-2002-4694 et al.
(1 more author) (2012) Coverage with evidence development, only in research, risk
sharing or patient access scheme? : A framework for coverage decisions. Report. CHE
Research Paper, 77 . Centre for Health Economics, University of York , York UK.
[email protected] https://eprints.whiterose.ac.uk/ Reuse
Items deposited in White Rose Research Online are protected by copyright, with all rights reserved unless indicated otherwise. They may be downloaded and/or printed for private study, or other acts as permitted by national copyright laws. The publisher or other rights holders may allow further reproduction and re-use of the full text version. This is indicated by the licence information on the White Rose Research Online record for the item.
Takedown
If you consider content in White Rose Research Online to be in breach of UK law, please notify us by
research, risk sharing or patient access scheme? A
framework for coverage decisions
1
Simon Walker
1
Mark Sculpher
1,2
Karl Claxton
1
Steve Palmer
1
Centre for Health Economics, University of York, UK
2
Department of Economics and Related Studies, University of York, UK
research material more widely available to health economists and other potential users. So as to speed up the dissemination process, papers were originally published by CHE and distributed by post to a worldwide readership.
The CHE Research Paper series takes over that function and provides access to current research output via web-based publication, although hard copy will continue to be available (but subject to charge).
Acknowledgements
This work was funded by an unrestricted educational grant from Pfizer. No restrictions were placed on the design, implementation or description of the research by the funders. The Centre for Health Economics receives funding from the NHS Health Technology Assessment Programme and from the National Institute for Health and Clinical Excellence (NICE) to undertake research in support of NICE’s decision making.
Disclaimer
Papers published in the CHE Research Paper (RP) series are intended as a contribution to current research. Work and ideas reported in RPs may not always represent the final position and as such may sometimes need to be treated as work in progress. The material and views expressed in RPs are solely those of the authors and should not be interpreted as representing the collective views of CHE research staff or their research funders.
Further copies
Copies of this paper are freely available to download from the CHE website
www.york.ac.uk/che/publications/ Access to downloaded material is provided on the
understanding that it is intended for personal use. Copies of downloaded papers may be distributed to third-parties subject to the proviso that the CHE publication source is properly acknowledged and that such distribution is not subject to any payment.
Printed copies are available on request at a charge of £5.00 per copy. Please contact the CHE Publications Office, [email protected], telephone 01904 321458 for further details.
Centre for Health Economics Alcuin College
University of York York, UK
www.york.ac.uk/che
Abstract
Context
Until recently, purchasers’ options regarding whether to pay for the use of technologies have been binary in nature: a treatment is covered or not covered. However, policies have emerged which expand the options - for example, linking coverage to evidence development, an option increasingly used for new treatments with limited/uncertain evidence. There has been little effort to reconcile the features of technologies with the available options in a way that reflects purchasers’ ranges of authority.
Methods
We developed a framework within which different options can be evaluated. We distinguished two sources of value in terms of health: the value of the technology per se; and the value of reducing decision uncertainty. The costs of reversing decisions are also considered.
Findings
Purchasers should weigh the expected benefits of coverage against the possibility the decision may need to be reversed and the possibility adoption will hinder/prevent evidence generation. Based on the purchaser’s range of authority and the features of the technology different decisions may be appropriate. The framework clarifies the assessments needed to establish the appropriateness of different decisions. A taxonomy of coverage decisions consistent with the framework is suggested.
Conclusions
A range of coverage options permit paying for use of promising medical technologies despite their limited/uncertain evidence bases. It is important that the option chosen be based upon not only the expected value of a technology but also the value of further research, the anticipated effect of coverage on further research, and the costs associated with reversing the decision.
Introduction
Historically, new health care technologies such as pharmaceuticals and devices gained access to countries’ health care systems and coverage by public or private third-party payment systems directly following regulatory approval or licensing. In the case of pharmaceuticals, this required evidence of the safety and efficacy of their products (European Medicines Agency 2009; U.S. Food and Drug Administration 2009). However, many health systems, in an effort to stem rising health care costs, now require a higher standard: that the expected additional health benefits of a new technology justify its additional cost (Freemantle and Hill 2004). This so-called “fourth hurdle” (Taylor et al. 2004) has changed the type and quantity of evidence required by purchasers before technologies are made available for widespread use and manufacturers are able to receive payment for use of their products. Even in systems which do not explicitly consider cost and cost-effectiveness, there is a often a focus on the magnitude of health benefits, considering the effectiveness and safety of new products, and informally weighing this against cost - for example, evidence suggests that Medicare in the USA does not automatically cover new, more costly medical technologies without consideration of the magnitude of their incremental health benefits (Chambers, Neumann, and Buxton 2010; Neumann and Tunis 2010).
Thus, in most systems purchasers (sometimes called ‘reimbursement authorities’) are increasingly balancing the potential for improved health outcomes offered by new technologies against acquisition costs. This challenge is accentuated by the fact that such decisions are having to be made earlier, often shortly following licensing, partly as a result of pressure from patients, lobby groups, politicians and manufacturers (Boseley 2006; Cooksey 2006; Evans and Boseley 2006; House of Commons Health Committee 2005; National Institute for Health and Clinical Excellence 2008). However, the type of evidence available at a product’s launch is largely focused on what is necessary to inform regulatory authorities (e.g. for pharmaceutical licensing) rather than coverage decisions, and there is typically little information on relative effectiveness in routine use or against existing interventions, let alone about relative cost-effectiveness. New technologies often appear promising, offering improvement over existing interventions in the same disease area. However, the evidence of long term benefits and costs is inevitably not available at launch, and there is often considerable uncertainty about the consequences of their widespread use.
Purchasers need to be able to take all these factors into account when making decisions about the coverage of new health care technologies.
Until recent years, coverage decisions in many health systems have been considered largely binary in nature, based on the price set by the manufacturer and the evidence available at launch: that is, the purchaser would choose whether or not to pay for the product, for the entire indication or for a particular subgroup, based on existing evidence and current prices. However, new coverage options have emerged which have expanded the options available. Examples include coverage only with research (Carino, Sheingold, and Tunis 2004; Schluessmann et al. 2009; Tunis and Whicher 2009), onlyinresearch (Chalkidou 2006) and with performance linked payments, sometimes referred to as 'risk sharing' (Rutten, Uyl-de Groot, and Vulto 2009; Towse and Garrison 2010). These methods have been developed with the objective of allowing patients early access to promising and innovative health care technologies. They also aim to give manufacturers longer to make returns before patent expiration, and also to allow health care providers to give their patients access to promising technologies whilst reducing the risk payers face in making a wrong coverage decision and obtaining more evidence.
In the US, Medicare has begun to develop coverage policies aimed at reducing uncertainty about effectiveness through the generation of additional evidence. The term Coverage with Evidence Development (CED) is used by Medicare as a catch all term for two separate coverage options in which generating additional evidence is a condition of coverage: coverage with study participation (CSP) and coverage with appropriateness determination (CAD). CSP allows coverage of technologies for which the evidence is not adequate to support full coverage but where additional evidence gathered in the context of clinical care would clarify the benefits of treatment, therefore restricting coverage to those patients receiving the intervention as part of a clinical trial or registry. CAD allows for the collection of additional clinical information that would not be available on a claims form to determine the appropriateness of coverage, therefore not restricting the coverage to those patients participating in a clinical trial or registry but still providing additional evidence. These two schemes have also been referred to as 'only in research' (OIR), which restricts coverage to patients receiving the intervention as part of a clinical study or registry, and 'only with research' (OWR), which does not necessarily limit coverage to those patients participating in a study or registry, respectively (Carlson et al. 2010). The distinction between OIR and OWR is primarily the degree of coverage that the payer confers during the period of evidence generation.
Conceptual framework
Identifying the assessments that should be made when considering the coverage of a new health care technology is central to understanding the potential contributions that new coverage options offer. The appropriate coverage of a promising technology depends upon the assessment of three essential features: i) the value of the technology based on existing evidence; ii) the value of reducing uncertainty about the technology’s benefits, risks, and costs by acquiring more evidence; and iii) the value of any investment or reversal costs resulting from an initial positive coverage decision. These are considered in turn below.
The value of a technology
A technology can be considered valuable if its expected additional benefits (in health or cost terms) justify its additional net costs. In a budget-constrained, or 'closed', health care system like the UK’s NHS, funding a more expensive new technology requires other health care activities to be curtailed to accommodate the additional costs, leading to forgone health outcomes elsewhere which are incurred as 'opportunity costs'. In such a system, a technology is valuable if the expected health benefits to those who will use that technology exceed the health expected to be forgone by other NHS patients whose care would be displaced. The same principle applies to open health systems such as those in the USA but, in the absence of firm budget constraints on health, the opportunity costs may manifest themselves in terms of forgone non health expenditure through increased insurance premiums, taxation or copayments. Although the following exposition takes the perspective of a closed system, it readily generalises to open systems with the opportunities costs falling on non health expenditure rather than health.
Methods to estimate the long term additional health gains and additional net costs associated with a new technology are well established and increasingly sophisticated (Drummond et al. 2005; National Institute for Health and Clinical Excellence (NICE) 2008). Whilst there is no universal agreement on the most appropriate measure of health, most would agree that it is important to capture both the effect on the quantity and quality of life. One such measure which is commonly used is the quality-adjusted life-year (QALY) (Brazier et al. 2007). We use this measure as the unit of health measurement for illustration.
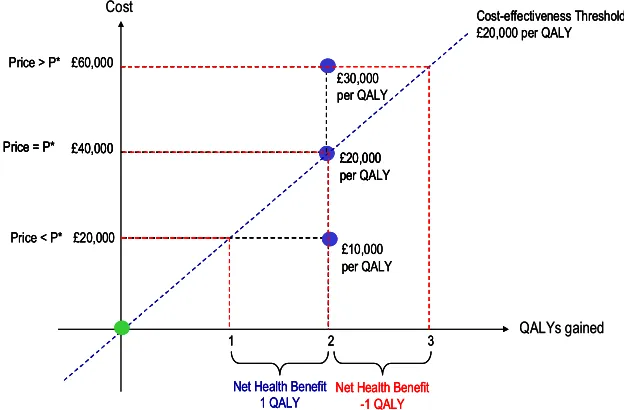
The relationship between value, health benefits and additional cost is illustrated in Figure 1. The y-axis shows the additional cost of the new technology when it is priced at three different levels (price less than P*, P*, and greater than P*), and the x-axis shows the expected health benefits, measured in QALYs. If the health care budget is fixed then additional costs will displace other health care and health will be forgone for other patients (although as stated previously, this can be generalised to open systems where it is non health expenditure rather than health which is displaced). Therefore, some assessment of how much additional cost leads to one QALY being forgone elsewhere is required. This is the concept of the cost-effectiveness threshold used by some budget constrained health care systems (Culyer et al. 2007). The rising diagonal in Figure 1 illustrates a threshold where every additional £20,000 is expected to displace one QALY. This analysis can easily be extended to consider an open system with the threshold instead representing the willingness of society to give up non health expenditure for a health improvement.
QALYs elsewhere, just equal to the expected health benefits. Therefore, there is no NHB overall and P* represents the maximum the health care system can afford to pay for this technology. If the price is set above P*, the health care costs of £60,000 would be expected to displace three QALYs. The health expected to be forgone exceeds the health expected to be gained. If this technology were approved it would reduce overall population health outcomes since the NHB is -1 QALY based on existing evidence.
[image:11.595.138.450.210.415.2]What should become clear from this illustration is the critical role that the price of the technology plays in determining the value of a technology and whether it should be paid for based on existing evidence.
Figure 1: The value of a technology (source Claxton et al 2008)
Whilst the above analysis focuses on theexplicituse of cost-effectiveness analysis to assess value, it is recognised that not all payers use formal economic evaluation. However, no health system can completely ignore opportunity costs. For example, in the USA, some parts of the private sector are beginning to use formal cost-effectiveness analysis (Wellpoint National Pharmacy and Therapeutics Committee 2008), but Medicare does not undertake the explicit forms of economic analysis to inform decisions seen in many European countries, Canada and Australia. However, there is evidence that at least some Medicare coverage decisions reflect an implicitassessment of value for money because Medicare does not automatically cover every intervention offering an incremental benefit – expensive technologies yielding only small gains in effectiveness may not be approved for coverage, cost is likely to be one consideration in this (Chambers, Neumann, and Buxton 2010; Neumann and Tunis 2010). In other words, some assessment is made of whether the magnitude of the health benefits generated by a technology is sufficient to justify it being covered. Indeed, in the context of recent developments in comparative effectiveness research (Institute of Medicine 2009), one interpretation of the value of this initiative to policy and decision makers is that it can provide an assessment of the magnitude of the health improvement offered by new technologies against existing interventions which can be considered alongside their costs. Whether the assessment of value is made explicitly or implicitly, the conceptual framework remains relevant in considering the coverage of new technologies. Although the framework we offer focuses on formal assessments of NHB as the measure of value, our approach can be generalised to more implicit value assessment consistent with the emerging tenets of comparative effectiveness research, whereby some assessment is made of whether the magnitude of the health benefits generated by a technology justify its coverage. The remainder of the paper refers to the concept of the value of the technology in general but it should be emphasised that this can be based on an explicit evaluation of
cost-£20,000 per QALY £40,000
Price = P*
Cost-effectiveness Threshold £20,000 per QALY
QALYs gained Cost
£60,000
£30,000 per QALY Price > P*
3 £20,000
2 £10,000 per QALY Price < P*
1
Net Health Benefit 1 QALY
Net Health Benefit -1 QALY
£20,000 per QALY £40,000
Price = P*
£20,000 per QALY £40,000
Price = P*
£20,000 per QALY £40,000
Price = P*
Cost-effectiveness Threshold £20,000 per QALY Cost-effectiveness Threshold £20,000 per QALY
QALYs gained Cost
£60,000
£30,000 per QALY Price > P* £60,000
£30,000 per QALY Price > P*
33 £20,000
2 £10,000 per QALY Price < P* £20,000
2 £10,000 per QALY Price < P*
11
Net Health Benefit 1 QALY Net Health Benefit
1 QALY
Net Health Benefit -1 QALY Net Health Benefit
effectiveness (such as that made by NICE) or implicit assessment informed by comparative effectiveness research methods.
The value of evidence
The previous section has focused on the value of a technology assuming that the costs and benefits are known with certainty. When assessing the value of a new technology, however, gaps in information may mean that the estimates of the expected (i.e. average) costs, health outcomes and, therefore, overall NHB will be uncertain. Additional evidence can reduce this uncertainty and provide more precise estimates which can reduce the risk of incorrect decisions (i.e., coverage of a technology that does not actually provide a net health benefit).
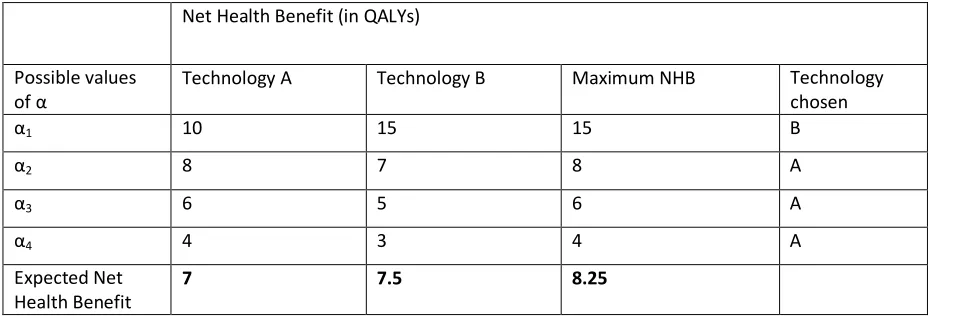
This value of evidence is illustrated in Table 1, where a new technology B is compared with an
A T
NHB F
four possible values with equal probability, each producing a NHB for each technology.
Based on current evidence, technology B has the highest expected NHB (7.5 QALYs), even though the probability it meets a given cost-effectiveness threshold is only 0.25 (B only has the highest NHB for
N
reversing the decision to cover the technology, B is expected to be valuable, offering an additional 0.5 QALYs compared to technology A given existing evidence (Claxton 1999).
However, if more evidence about the effects of the two technologies could resolve the uncertainty
NHB T
basis for estimating the value of further research. Using the example in Table 1, if the uncertainty could be fully resolved then we can establish which treatment would be adopted given the true
B 1 A 2 3,
4where shown to be true, improving NHB by 1 QALY in each case compared to B. However, the results of further research are as yet unknown (i.e. we do not knowex ante
assume each result is equally likely. Therefore, the expected NHB of treatment, if additional evidence could resolve this uncertainty, is found by averaging across the maximum NHB associated
[image:12.595.65.549.550.709.2]QALY
Table 1: Net Health Benefits under uncertainty
Net Health Benefit (in QALYs)
Possible values
Technology A Technology B Maximum NHB Technology
chosen
1 10 15 15 B
2 8 7 8 A
3 6 5 6 A
4 4 3 4 A
Expected Net Health Benefit
7 7.5 8.25
based on existing evidence (8.25 - 7.5 QALYs), i.e., greater than the expected value of new technology itself given current evidence (0.5 QALYs). However, 0.75 QALYs represents an upper bound on the value of additional evidence, or the expected value of perfect information (EVPI), since research which could be conducted is unlikely to resolve all uncertainty surrounding the choice between A and B (Claxton 1999; Claxton and Sculpher 2006). Some assessment of uncertainty, its consequences and the need for further research is needed by purchasers. Such assessment of uncertainty can be informed through well established quantitative methods which can be extended to consider the value of proposed research designs (Ades, Claxton, and Sculpher 2006; Conti and Claxton 2009).
However, the generation of additional evidence may be costly, both in resources needed to do the research and in delays in approving a valuable technology for widespread use. Ideally, a promising technology that is expected on average to be of value would be paid for while further research is being conducted to resolve uncertainties. However, allowing patients early access to the technology may affect the prospects of the research, which is required to generate the additional required evidence, actually being conducted. For example, manufacturers would have less incentive to invest in additional research about a technology once it is covered; physicians might consider further clinical trials to be unnecessary and unethical; and patients might be unwilling to participate if they already have access to the new technology. Therefore, early coverage may mean that the benefits of additional evidence to inform treatment choice for future patients will be forgone. If the benefits forgone for future patients exceed the benefits to current patients of earlier access, then it may be better to withhold coverage of a technology, even if it is expected on average to be valuable given existing evidence, until further research is conducted (Griffin et al. 2010).
For example, in Table 1, the value of access to the new technology (B) for current patients is 0.5 QALYs (compared to standard practice, A), but the value of additional evidence for future patients is 0.75 QALYs. The purchaser should consider whether the benefits of early coverage exceed the future benefits which may be forgone. In doing so they should consider the value of evidence associated with research that might be undertaken if coverage is withheld, how long such research might take, and what other changes might occur during that interval (e.g., the entry of cheaper generics or of other new technologies). Such assessment will partly depend on the price of the technology. For example, if the price of the technology is reduced then there will be greater benefits of early access for current patients and, if the technology was already regarded as valuable at the original price, the value of additional evidence for future patients will tend to fall. Both of these effects would make immediate coverage more likely. Critically, there is an important relationship between the price of a technology, its value and the need for additional evidence (Claxton et al. 2008; Griffin et al. 2010).
Costs of investment and reversal
nonetheless, resolve over time. For example, the price of the technology or its comparators might be expected to change over time (e.g., the entry of generics at patent expiry), or new future technologies might become available and make current technologies obsolete. Even if further research is not conducted, the existence of investment and reversal costs could mean that delaying coverage until uncertainties are resolved or reduced might be preferable even for technologies that are expected to be of value on average based on current evidence (Eckermann and Willan 2008; Palmer and Smith 2000).
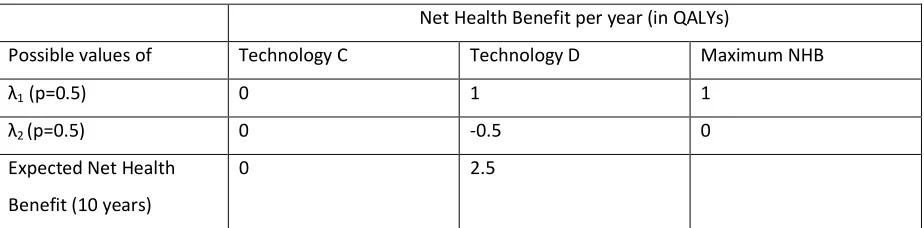
The relationship between investment or reversal cost, uncertainty and immediate coverage or delay is illustrated in Table 2. The new technology D is compared to current clinical practice C. NHBs in
[image:14.595.68.530.260.374.2]
is uncertain but has two equally likely values. Table 2- Option values
Net Health Benefit per year (in QALYs)
Possible values of Technology C Technology D Maximum NHB
1(p=0.5) 0 1 1
2(p=0.5) 0 -0.5 0
Expected Net Health
Benefit (10 years)
0 2.5
If there are no investment or reversal costs, then the purchaser can choose the alternative with the highest expected NHB. If the technologies offer the reported NHB in each of the next 10 years then
D NHB
practice which, for simplicity, we assume is 0 QALYs. If some investment is required to implement D which would displace 2 QALYs elsewhere, the expected NHB of D would be reduced to 0.5 QALYs
H
I
C NHB QALY I 1then D would be covered
NHB QALY
I 2then C would be maintained with NHB of 0 QALYs. Therefore, the expected NHB of
withholding approval of D for one year would be (0.5*7) + (0.5*0) = 3.5 QALYs; which is greater than an immediate decision to use D.
What are the implications?
The technology’s characteristics and the purchaser’s range of authority
Before assessing the coverage options available to the purchaser, it is first worth considering the possible characteristics of the technology (the ‘technology space’) and the purchaser’s range of authority (the scope under their control) in order to determine what coverage options can and should be considered.
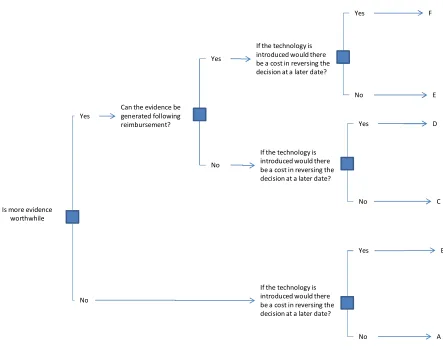
Figure 2 represents a stylized view of the technology space, encompassing six important scenarios (labelled A to F). The scenarios are based on whether an initial positive coverage decision about the technology is likely to be too costly to reverse if new evidence emerges suggesting it was incorrect, whether future research would be worthwhile and whether additional evidence could feasibly be generated following a decision to cover the technology. Future research is potentially worthwhile if the value of the uncertainty that could be reduced exceeds the costs of the research (this is a necessary condition in our framework for research being worthwhile), i.e., that the research is likely to be beneficial when taking account of both the benefits in terms of reduced uncertainty and the costs. Whether the evidence could be generated following coverage would depend upon the source of uncertainty (e.g., this may not be possible if the uncertainty relates to the relative effectiveness of a treatment for which a RCT may be the only suitable design to minimise potential bias but a RCT may be unable to recruit patients if the technology is already covered).
Is more evidence worthwhile
Yes
No
Can the evidence be generated following reimbursement?
Yes
Yes Yes
Yes
No
No No
No If the technology is
introduced would there be a cost in reversing the decision at a later date?
If the technology is introduced would there be a cost in reversing the decision at a later date?
If the technology is introduced would there be a cost in reversing the decision at a later date?
[image:16.595.100.543.359.709.2]A B C D E F
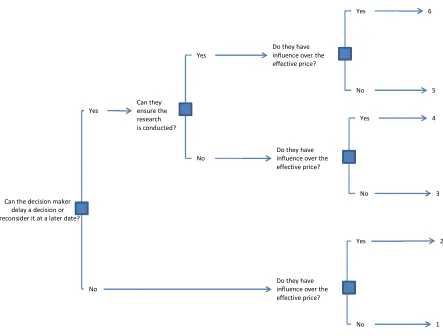
Figure 3 represents the possible ranges of authority that purchasers may have. Representing all possible nuances would be difficult. To simplify we present six key situations (labelled 1 to 6) based on a binary view of three dimensions of the purchaser’s authority. These are, firstly, whether a purchaser can delay a decision or reverse it in the future in the face of new information. For example, some purchasers may be forced to make a decision on whether to cover the technology immediately, and that decision may be non reversible, whilst others may have the ability to delay the decision until more evidence is available or, if they initially decided to cover the technology, may be able to reverse this decision in the light of new evidence. Secondly, whether the purchaser has some influence over the effective acquisition price paid for a technology, either through price negotiation or some arrangements that reduce the effective price without changing the formal list price. The ability to influence price could be dependent on many factors, although here we assume for simplicity that the purchaser can only influence price if it can reject the technology grounds of lack of value, thereby giving the purchaser some bargaining power. Thirdly, whether the purchaser can contract for research or have some control of research budgets so as to ensure the research is conducted. It should be clear that the wider the range of authority of the purchaser the more extensive the options open to it when making coverage decisions on health care technologies. The figure characterises six different types of purchases in terms of their range of authority. It is possible to locate some decision makers into these categories. For example, NICE in the UK probably most closely resembles Purchaser 3 in that it has the ability to delay and review decisions, has limited scope to ensure that research is conducted and has little influence on price. Other systems, such as HAS in France, have more influence over price.
Figure 3: The purchaser’s range of authority
Can the decision maker delay a decision or reconsider it at a later date?
Yes
No
Can they ensure the research
Yes
Yes Yes
Yes
No
No No
No Do they have
influence over the effective price?
Do they have influence over the effective price?
Do they have influence over the effective price?
1 2 3 4 5 6
Choosing among coverage options
The previous section has characterised the technology space and the purchaser’s range of authority each in terms of six possible states (A to F and 1 to 6, respectively). Combining these creates 36 possible combinations, out of which falls a set of feasible coverage options which we consider in detail in Tables 3 and 4. These are as follows:
Reject- The technology is not paid for on the grounds that it is not considered beneficial (i.e. of value) to the health system. This may be able to be reversed at a later date.
Accept- The technology is paid for on the basis that it is considered beneficial to the health system. This may be able to be reversed at a later date.
Influence over effective price- The purchaser has some influence over the effective price paid for a technology. It is assumed that influence will only be possible if the purchaser can reject the coverage of the treatment, otherwise it would have no bargaining power to ensure a reduction in the effective price.
Only in research (OIR)- Coverage of a technology is available only to patients involved in research. This option may involve the purchaser paying for the research, which would require the purchaser to have some influence over research decisions (i.e., being able to contract for the research to be conducted). Alternatively, it may involve the purchaser rejecting the technology and simply recommending research, with the research being paid for by another party (e.g. the manufacturer or another stakeholder), which would not require the purchaser to be able to ensure the research was conducted.
Only with research (OWR)- A positive coverage decision is conditioned upon the collection of additional evidence to support continued, expanded or withdrawal of coverage (Carlson et al. 2010). So the technology is paid for all but further research is also required. This research may be funded by the purchaser, the manufacturer or another stakeholder, but such a decision would require that the purchaser was able to enforce that the research is actually conducted, so will be treated here as an available option only when the purchaser can ensure the research is conducted.
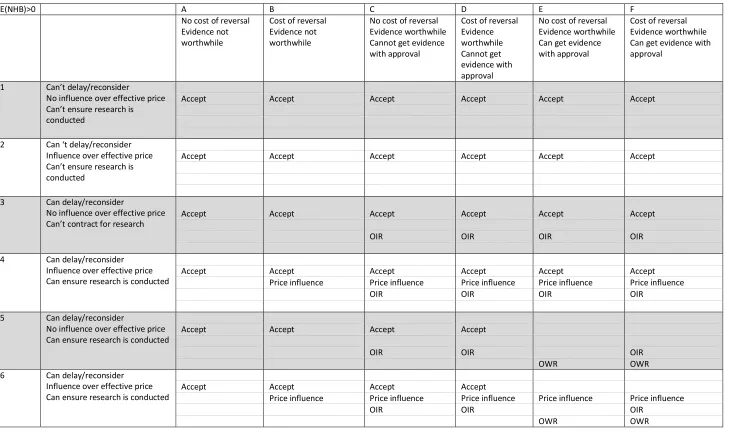
Table 3 shows the coverage options from which the purchaser should choose in each scenario when the technology is expected to be of value (i.e. assessed explicitly or implicitly) on average based on existing evidence. The options available when the technology is not expected to be of value based on current evidence are shown in Table 4. How these choices should be made is then discussed with reference to the conceptual framework presented earlier. The analysis in these tables is based on the introduction of a new technology. When considering the future coverage of an already funded technology similar judgements must be made, although they are not specifically considered here. Our analysis also only considers uncertainties which will be resolved through research and not those uncertainties which will be resolved through some other method (e.g., waiting to observe the generic price of a technology).
Table 3: Coverage options when the treatment is expected to be (i.e. on average) effective (or cost-effective) given existing evidence
E(NHB)>0 A B C D E F
No cost of reversal Evidence not worthwhile
Cost of reversal Evidence not worthwhile
No cost of reversal Evidence worthwhile Cannot get evidence with approval
Cost of reversal Evidence worthwhile Cannot get evidence with approval
No cost of reversal Evidence worthwhile Can get evidence with approval
Cost of reversal Evidence worthwhile Can get evidence with approval
1 Can’t delay/reconsider
No influence over effective price Can’t ensure research is conducted
Accept Accept Accept Accept Accept Accept
2 Can ‘t delay/reconsider
Influence over effective price Can’t ensure research is conducted
Accept Accept Accept Accept Accept Accept
3 Can delay/reconsider
No influence over effective price Can’t contract for research
Accept Accept Accept Accept Accept Accept
OIR OIR OIR OIR
4 Can delay/reconsider
Influence over effective price Can ensure research is conducted
Accept Accept Accept Accept Accept Accept
Price influence Price influence Price influence Price influence Price influence
OIR OIR OIR OIR
5 Can delay/reconsider
No influence over effective price Can ensure research is conducted
Accept Accept Accept Accept
OIR OIR OIR
OWR OWR
6 Can delay/reconsider
Influence over effective price Can ensure research is conducted
Accept Accept Accept Accept
Price influence Price influence Price influence Price influence Price influence
OIR OIR OIR
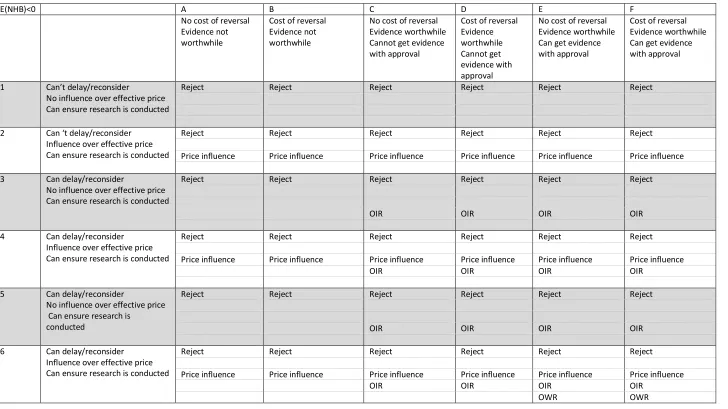
Table 4: Coverage options when the treatment is not expected to be (i.e. on average) effective (or cost-effective) given existing evidence
E(NHB)<0 A B C D E F
No cost of reversal Evidence not worthwhile
Cost of reversal Evidence not worthwhile
No cost of reversal Evidence worthwhile Cannot get evidence with approval
Cost of reversal Evidence worthwhile Cannot get evidence with approval
No cost of reversal Evidence worthwhile Can get evidence with approval
Cost of reversal Evidence worthwhile Can get evidence with approval
1 Can’t delay/reconsider
No influence over effective price Can ensure research is conducted
Reject Reject Reject Reject Reject Reject
2 Can ‘t delay/reconsider
Influence over effective price Can ensure research is conducted
Reject Reject Reject Reject Reject Reject
Price influence Price influence Price influence Price influence Price influence Price influence
3 Can delay/reconsider
No influence over effective price Can ensure research is conducted
Reject Reject Reject Reject Reject Reject
OIR OIR OIR OIR
4 Can delay/reconsider
Influence over effective price Can ensure research is conducted
Reject Reject Reject Reject Reject Reject
Price influence Price influence Price influence Price influence Price influence Price influence
OIR OIR OIR OIR
5 Can delay/reconsider
No influence over effective price Can ensure research is
conducted
Reject Reject Reject Reject Reject Reject
OIR OIR OIR OIR
6 Can delay/reconsider
Influence over effective price Can ensure research is conducted
Reject Reject Reject Reject Reject Reject
Price influence Price influence Price influence Price influence Price influence Price influence
OIR OIR OIR OIR
Below we consider in detail how each type of purchaser should choose between the coverage options available in the other scenarios.
Purchaser 1 who cannot delay or reconsider a decision and has no influence over price
In this context, the decision regarding whether or not to pay for the use of the technology should be based solely on whether or not the technology is expected to be of value. Future research is not of value as the decision cannot be delayed or reconsidered at a later date when evidence becomes available and, similarly, any costs of reversal do not need to be taken into account as the decision cannot be reversed subsequently. Therefore, when the treatment is expected to be of value the technology should always be covered (see row 1 Table 3), and when the technology is not expected to be of value it should always be rejected (see row 1 Table 4).
Purchaser 2 who cannot delay or reconsider a decision and has influence over the price
Purchaser 2 is in a similar position to Purchaser 1 although it has influence over the price. Similarly to Purchaser 1, the value of evidence and any reversal costs do not need to be considered as it cannot delay or reconsider their decision. When the technology is of value on average, given existing evidence, it should always be accepted (see row 2 Table 3). Even though the purchaser has influence over the price, it has no bargaining power in the case when the treatment is expected to be of value as the manufacturer knows that the treatment will be paid for at the current price, and therefore has no incentive to reduce it. When the treatment is not expected to be of value it should not be paid for unless a reduction in the effective price can be secured to make the technology valuable on average (see row 2 Table 4).
Purchaser 3 who can delay or reconsider a decision and has no influence over price or
scope to ensure the research is conducted
This purchaser has three coverage options available, either to accept or reject immediately, or to reject for now but recommend research be carried out to reduce any uncertainty (OIR recommendation).
In a situation where the technology is expected to have positive NHB based on current evidence (Table 3), if additional evidence collection is not worthwhile the treatment should always be accepted, as the evidence will never be generated to show that the decision was incorrect (3A and 3B Table 3). When gathering additional evidence is worthwhile then the purchaser should decide whether the value of immediate acceptance (the expected NHB as a result of patients receiving the treatment during the period it would take to conduct the research) outweighs the value of the evidence that will be forgone. If not then an OIR decision should potentially be recommended instead of accepting the technology immediately. As the purchaser is unable to ensure the research is conducted they cannot enforce that evidence will be generated following acceptance, so it does not matter whether the evidence can be generated with acceptance or not. Costs of reversal can be ignored as the evidence which would change the decision will not be generated if the technology is accepted. Therefore, the choice remains between accept and OIR (see 3C, 3D, 3E and 3F).
Purchaser 4 who can delay or reconsider a decision and has influence over price but
cannot ensure the research is conducted
Purchaser 4 is in a similar situation to Purchaser 3 but also has influence over the price paid. Therefore, the choice between coverage options is very similar in the two situations, although now a manufacturer may be able to alter an OIR decision to an accept decision by lowering the price and thus improving the technology’s value. In this case the value of immediate acceptance would increase, and it may also reduce the value of additional evidence (making OIR less favourable) (see 4C, 4D, 4E, 4F Table 3 and Table 4). Even when the evidence is not worthwhile (i.e., the value of the reduction in uncertainty does not exceed the cost), when the treatment is not expected to be of value on the basis of current evidence the manufacturer can lower the price to a level so the treatment is expected to be of value to secure the coverage of their treatment (see 4A and 4B Table 4).
Purchaser 5 who can delay or reconsider a decision, can ensure the research is conducted
but has no influence over price
Here the purchaser has more coverage options available as OWR and OIR options are included where the purchaser actively ensures the research is conducted rather than recommending research (and hoping it takes place) through an OIR decision, as has been assumed with the previous purchasers.
Let us first consider where the treatment is expected to be of value given current evidence (Table 3). When the collection of additional evidence is not worthwhile or research cannot be undertaken once the technology has been paid for (for example, when relative effectiveness evidence is required but coverage makes recruitment difficult), then the purchaser faces the same coverage options as Purchaser 3. Hence they should weigh up the same factors when choosing between the available options although they can now ensure that the research is conducted through an OIR decision (5A, 5B, 5C, 5D Table 3). However, when it is considered that the evidence can be generated once the treatment has been paid for, then a OWR option may now be worthwhile. When there is no cost of reversal, OWR becomes the dominant coverage option as more patients will receive the treatment that is expected to be of value therefore providing the same expected benefit to patients as immediate acceptance and the valuable additional evidence will also be collected (5E Table 3).
When there is a cost of reversal the choice is now between OWR and OIR (OWR still dominates outright acceptance as the uncertainty will also be resolved). The purchaser should now weigh up the expected NHB as a result of patients receiving the treatment in the time it would take to conduct the research against the probability that the treatment will not be found to be of value by the research and the cost of reversing the decision is incurred in the future. If the expected benefits outweigh the probability and costs of reversal then a OWR decision should be made; however, if they do not, an OIR decision should be considered (5F Table 3).
When the treatment is not of value, given current evidence, OWR should never be considered and the purchaser faces the same choices as those of Purchaser 3, although they should weigh up whether they should fund the research themselves, or simply recommend that the research is conducted.
Purchaser 6 who can delay or reconsider a decision, has influence over price and can
ensure the research is conducted
discussion as for 5, but now should note that, by agreeing effective reductions in price, they can change the balance between the various coverage options. For example, whilst previously the probability and costs of reversal may have made an OIR decision favourable in 5F Table 3, by securing a reduction in price the NHB to patients increases, and may make a OWR decision worthwhile (6F Table 3).
When the treatment is not expected to be of value given existing evidence (Table 4), OWR now becomes a coverage option when the evidence can be generated with coverage, as long as the price can be reduced to a level where the treatment is expected to be of value (6E and 6F). In the case of 6E, if the treatment is now expected to be of value, OWR will dominate OIR (the patients all receive the treatment with expected NHB and the evidence will also be generated). In the case of 6F, the purchaser should now weigh up the expected NHB as a result of patients receiving the treatment during the research period, against the probability that the treatment will be found by the research not to be of value, hence incurring the cost of reversing the decision in the future. If the expected benefits outweigh the probability and costs of reversal then an OWR decision should be made; however, if they do not, an OIR decision should be considered.
What assessments are needed when choosing between coverage options?
The above has set out how purchasers should choose between the set of coverage options under various scenarios. There are a number of general insights which come from these analyses. When the purchaser is unable to delay a decision or to reconsider it at a later date their options are heavily limited: they should accept or reject, and the coverage decision should be based solely on the expected value of the treatment (whether assessed explicitly or implicitly). For technologies which are expected not to be of value given existing evidence, the purchaser is generally limited to rejecting the technology or trying to ensure a reduction in the price.
A new taxonomy of coverage options
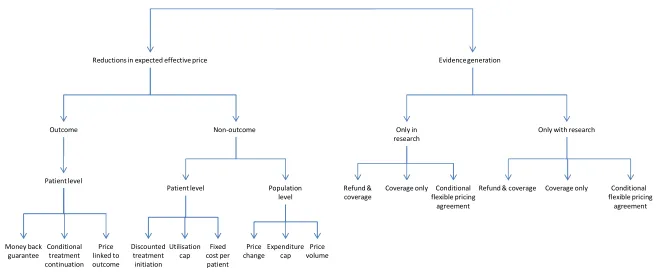
Conventionally, coverage decisions have been considered to be binary in nature: technologies were either paid for or not. However, the range of options available to purchasers can be expanded to include many more options which should be considered. A plethora of coverage options has developed although, as yet, there is no common terminology for those observed in practice. To address this, a taxonomy of coverage options is presented which attempts to draw out the key features of observed coverage decisions on the basis of the analyses presented previously. To this end the coverage options are split into two broad areas: those associated with reductions in the effective price (i.e. influence over pricing decisions from the previous section); and those associated with evidence generation (i.e. OIR or OWR decisions from the previous section). Differences between the coverage options are often a result of variation in how the allocation of risk between the manufacturer and the purchaser is altered by the agreement. Carlson et al. previously suggested a taxonomy which, although it has influenced the approach here, differs in that their key distinction was between whether the coverage options are outcome or non outcome based rather than whether the focus is on altering the expected price or reducing the uncertainty surrounding value for money through the generation of additional evidence (Carlson et al. 2010).
The taxonomy here is intended to assist an understanding of the coverage decisions observed in practice. The aim is to make a clear distinction between those coverage decisions which alter the expected value of a treatment with existing evidence through changing its effective price, and those which provide additional evidence so at to reduce the uncertainty surrounding value. Further differences are down to the allocation of risk between the purchaser and the manufacturer and to what is actually specified in the agreement, e.g. is the price explicitly linked to the results of research? In Appendix A various examples of these coverage decisions have been described and allocated to the appropriate section of the taxonomy.
Reductions in the expected effective price
Decisions which result in reductions in the effective price make treatments more desirable by reducing their expected costs to the health care system. The previous section grouped such agreements as having influence over the price paid for a technology; however, there are many nuances to the coverage decisions observed in practice which, whilst all affecting the effective price, do so in different ways. Figure 4 distinguishes reductions in effective price as being one of two types: outcome and non-outcome based.
Outcome based coverage decisions
Outcome based coverage decisions link the effective price paid for a technology to some measure of clinical outcome and, therefore, operate at the level of the individual patient (although these can be aggregated so payments are effected at the population level). Three types of outcome based agreements can be distinguished: money back guarantees, conditional treatment continuation and price linked to outcome.
i) Money back guarantees
Outcome Non-outcome
Reductions in expected effective price Evidence generation
Only in research
Only with research
Refund & coverage
Conditional flexible pricing
agreement Patient level
Population level
Price change
Price volume Expenditure
cap Money back
guarantee
Conditional treatment continuation
Price linked to outcome
Patient level
Discounted treatment initiation
Utilisation cap
Fixed cost per patient
Coverage only Refund & coverage Coverage only Conditional flexible pricing
[image:25.842.76.733.112.385.2]agreement
example of such a scheme is the agreement between Park Davis and North Staffordshire Health Authority for the use of atorvastatin in patients with high cholesterol. The manufacturer agreed to rebate the health authority if patients did not achieve a low density lipoprotein cholesterol concentration target of less than 3 mmol/l after treatment with atorvastatin (Chapman et al. 2003).
ii) Conditional treatment continuation
Conditional treatment continuation involves payment for the continued use of a technology only in patients who have achieved a target clinical effect (Carlson et al. 2010). Such schemes can also involve refunds, either full or partial, for those patients who do not achieve the targeted effect. An example of such an agreement is that between Johnson and Johnson and the UK’s NHS for the use of bortezomib for multiple myeloma. Johnson and Johnson agreed to repay the NHS in either cash or product for patients who fail to respond after 4 cycles of treatment with bortezomib. Those who respond would receive an additional 4 cycles of the treatment (Green et al. 2006).
iii) Price linked to outcome schemes
Price linked to outcome schemes involve the price being directly linked to a specified outcome for each patient (either clinical or other; for example, a biomarker). These schemes share similarities with money back guarantees, although the risk is still shared as the better a patient’s outcome the higher the price. No examples of such schemes have been indentified in practice, perhaps as a result of their high management costs or the possibility for gaming by either the manufacturer or the purchaser to artificially raise or lower price. However, with the advancement in health care information systems it may be possible in the future to have schemes where the price paid for the treatment of a given patient is directly related to their outcome.
Non outcome based coverage decisions
With non outcome based coverage decisions effective prices can be determined at an individual patient level or at a population level (i.e. across all patients).
a) Patient level non outcome coverage decisions
Patient level non outcome coverage decisions are characterised by different effective prices for a given technology for different patients, but this is not achieved by linking prices to measures of outcome; rather, prices are linked to other factors associated with treatment. Three types of such agreements can be identified: discounted treatment initiation, utilisation caps and fixed cost per patient.
i) Discounted treatment initiation
Discounted treatment initiation schemes involve patients receiving a technology for a price which is different to the list price at the initiation of treatment. The price then reverts to the list price if the patient remains on the treatment after a set number of courses or period of time. Unlike with conditional treatment initiation schemes, there is no agreement that that patients will remain on treatment should they achieve a target effect. In the UK, the first cycle of sunitinib for the treatment of renal cell carcinoma is provided free for all patients (NICE 2009).
ii) Utilisation caps
the cost of 14 injections in the treated eye with any subsequent injections being covered by Novartis.
iii) Fixed cost per patient
A coverage decision of a fixed cost per patient involves a set price for an entire course of a patient’s treatment regardless of the number of treatments actually received. Such a decision still involves a risk share between the manufacturer and the purchaser with the purchaser paying more for patients who require very few treatments but less for those who require many. In the UK such a scheme has been agreed for the use of gefitinib for the treatment of non-small cell lung cancer (NICE 2010).
b) Population level non outcome coverage decisions
Population level non outcome coverage decisions are characterised by the effective price being determined at the level of the health care system rather than the individual patient. Three forms of such decisions can be distinguished: price changes, expenditure caps and price volume agreements.
i) Price changes
Price changes involve the negotiation of a price per unit of the technology between the manufacturer and the purchaser which differs from the list price. Examples of such agreements are limited, however, as a result of global reference pricing, where pricing of a drug in one country is linked to the price in another. As a result of this most such agreements would not be published as the manufacturer would fear price erosion of their technology in other markets as well.
ii) Expenditure caps
Expenditure caps limit the total expenditure by a health system on a treatment without limiting the total quantity of the treatment available, effectively linking the price of a treatment directly to how much of it is used. These agreements also involve a risk shift, with the manufacturer facing the risk of treatment levels being above those consistent with the expenditure cap. In Australia an agreement was reached that the Australian Health Authority would cover $100 million (Australian) a year of the cost of etanercept for the treatment of rheumatoid arthritis, with the manufacturer meeting any costs in excess of this (Lu et al. 2004). It was estimated that the treatment would cost $140 million a year.
iii) Price volume agreements
Price volume agreements link the price paid per unit for a health care technology to the total number of units purchased. An example of such a decision is non linear pricing schemes where the price paid for a unit differs dependent on the total number of units purchased, perhaps being reduced once a threshold number of treatments purchased is reached.
Evidence generation
Only in research
Evidence generated under OIR can be used to inform coverage decisions in one of three ways: i) Coverage only
These schemes involve collecting additional evidence to inform a future decision on wider coverage of the technology, perhaps at a set date or when the evidence base is considered sufficiently mature to revise the decision. In the UK, NICE has recommended many treatments only be used in the context of randomised trials or studies. The use of laparoscopic surgery for colorectal cancer was initially rejected by NICE and recommended only in the context of a clinical trial which was ongoing. When the treatment was reconsidered at a later date it received positive guidance on the basis of evidence provided by the clinical trial (Chalkidou 2006).
ii) Refund and coverage
In addition to the arrangements used outlined for coverage only, this category of coverage decision also involves some form of refund or rebate from the manufacturer to the health care system if the additional research suggests that the price paid for the technology for those patients participating in research resulted in the technology not being of value.
iii) Conditional pricing agreement
Conditional pricing agreements involve an agreement between manufacturer and purchaser that the price of the technology will be determined directly by the results of the research. Such schemes may also include a refund linked to the cost of treatment for the research if the results show the treatment is not of value.
Only with research
Only with research schemes allow all patients access to the technology, but also provide for the generation of evidence to reduce uncertainty. Such schemes can be used to inform future coverage decisions in the same ways as those described under OIR.
An example of a coverage only scheme is the Swedish agreement on the use of rosuvastatin for high cholesterol, whereby the manufacturer agreed to provide additional data on the use of the drug in clinical practice and the long term effects of the drug on morbidity and mortality (Anell and Persson 2005). Another is the French authorities’ agreement to a refund and coverage scheme to cover risperidone at list price for patients with schizophrenia whilst the manufacturer performed further studies to evaluate whether the treatment helped patients stay on their medication. If the studies showed this not to be the case the manufacturer would refund a portion of the money spent on the treatment (Whalen 2007).
Discussion
The concepts described in this paper are intended to provide a set of guiding principles for purchasers when considering whether to pay for new health care technologies. Even if these concepts are not implemented using formal analysis they should still be in the forefront of the purchaser’s thoughts when making such decisions.
The paper also sets out a stylized version of the technology space and the purchaser’s range of authority and shows the coverage decisions which should be considered under the resulting 36 possible combinations. The greater the purchaser’s range of authority, the greater the coverage options available and, therefore, the increased scope to optimise decisions. In many countries the range of authority described above is split between several decision making bodies - for example, with a purchaser having control of payment for use decisions and another body having control of research funding. The conceptual framework, however, demonstrates that these are intrinsically linked and both have real effects on health outcomes. The separation of these areas of authority, or the failure of purchasers and other decision makers to act together, may, therefore, result in inefficient decisions by limiting the coverage options available.
It should be noted that only uncertainty which can be reduced through research has been considered here. As previously mentioned, there are other sources of uncertainty which cannot be resolved by further research but might be resolved over time (e.g., the future price of a technology or it comparators). In the presence of such uncertainty it may be optimal to reject a technology, which is expected to be value for money given existing evidence, and to wait until the uncertainty has been resolved.
The taxonomy provided here aims to assist the understanding of the coverage decisions observed in practice. Table A in Appendix A provides details of coverage decisions from several countries and allocates the decision in accordance with the taxonomy. In terms of schemes involving reductions in expected effective price, many were observed in practice on the basis of information available in the public domain. Seven examples of money back guarantee schemes are presented, of which four were observed in the UK, two in Germany and one in the USA. Ten versions of conditional treatment continuation schemes have been identified in the UK, the USA, Australia, Italy and Canada. No examples of decisions where the price was directly linked to outcome were found, this may be as a result of the large transaction and information costs associated with such schemes. Only one example of each of a discounted treatment initiation, utilisation cap and fixed cost per patient were observed, all of which were in the UK. No examples were found where there was a change in the list price agreed between the purchaser and the manufacturer, although it is likely that such agreements would remain private as a result of the impact they could have on prices in other countries through global reference pricing. Examples of expenditure caps were observed in Australia and Germany.
Another set of schemes which have emerged but which are not dealt with explicitly in our taxonomy are cost-sharing schemes whereby patients cover some or all of the cost of treatments that are not deemed to meet acceptable value for money standards (Austvoll-Dahlgren et al. 2008; Jackson 2010). These have not been dealt with explicitly here as they involve more complex issues around patient choices and preferences particularly when considered across different types of health systems.
Conclusions
References
Ades A, Claxton K, Sculpher M. 2006. Evidence synthesis, parameter correlation and probablistic sensitivity analysis.Health Economics15:373-82.
Anell A, Persson U. 2005. Reimbursement and clinical guidance for pharmaceuticals in Sweden: Do health-economic evaluations support decision making? European Journal of Health Economics 50:274-9.
Austvoll-Dahlgren A, Aaserud M, Vist G, Ramsay C, Oxman A, Sturm H, Kösters J, Vernby Å. 2008. Pharmaceutical policies: effects of cap and co-payment on rational drug use. Cochrane Database of Systematic Reviews.
Berns J, Fishbane S, Elezin H, Lynn R, Deoreo P, Tharpe D, Meisels I. 2005. The effect of a change in epoetin alfa reimbursement policy on anemia outcomes in hemodialysis patients. Hemodialysis Intertnational9:255-63.
Boseley S. 2006.Open up NHS to our drug firms, White House demands. InThe Guardian.
Brazier J, Ratcliffe J, Salomon J, Tsuchiya A. 2007. Measuring and valuing health benefits for economic evaluationOxford: OUP.
Carino T, Sheingold S, Tunis S. 2004. Using clinical trials as a condition of coverage: lessons from the National Emphysema Treatment Trial.Clinical Trials1:108-21.
Carino T, Williams II R, Colbert A, Bridger P. 2006. Medicare's coverage of colorectal cancer drugs: A case study in evidence development and policy.Health Affairs25:1231-9.
Carlson J, Sullivan S, Garrison L, Neumann P, Veenstra D. 2010. Linking payment to health outcomes: A taxonomy and examination of performance-based reimbursement schemes between health care payers and manufacturers.Health PolicyForthcoming.
Centers for Medicare and Medicaid Services. Coverage with Evidence Development. Available at
http://www.cms.hhs.gov/CoverageGenInfo/03_CED.asp(accessed 16/12/2009.
Chalkidou K. 2006."Only in research": a polite "no" or a valuable policy option?Birmingham: NICE. Chambers J, Neumann P, Buxton M. 2010. Does medicare have an implicit cost-effectiveness threshold?Medical Decision Making30:E14-E7.
Chapman S, Reeve E, Price D, Rajaratnam G, Neary R. 2004. Outcomes guarantee for lipid-lowering drugs: results from a novel approach to risk sharing in primary care.The British Journal of Cardiology 11:205-10.
Chapman S, Reeve E, Rajaratnam G, Neary R. 2003. Setting up an outcomes guarantee for pharmaceuticals: new approach to risk sharing in primary care.BMJ326:707-9.
Claxton, K, Briggs A, Buxton M, Culyer A, McCabe C, Walker S, Sculpher M. 2008. Value based pricing for NHS drugs: an opportunity not to be missed?BMJ336:251-4.
Claxton K, Cohen J, Neumann P. 2005. When is evidence sufficient?Health Affairs24:93-101.
Claxton K, Sculpher M. 2006. Using value of information analysis to prioritise health research: some lessons from recent UK experience.Pharmacoeconomics24:1055-68.
Conti S, Claxton K. 2009. Dimensions of design space: a decision theoretic approach to optimal research portfolio design.Medical Decision Making29:643-60.
Cooksey D. 2006.A review of UK health research funding. London: Stationery Office.
Culyer A, McCabe C, Briggs A, Claxton K, Buxton M, Akehurst R, et al. 2007. Searching for a threshold, not setting one: the role of the National Institute for Health and Clinical Excellence.Journal of Health Services Research & Policy12:56-8.
Department of Health. 2008.The Pharmaceutical Price Regulation Scheme. London: Department of Health.
Drummond MF, Sculpher MJ, O'Brien BJ, Stoddart GL, Torrance GW. 2005.Methods for the economic evaluation of health care programmes: Oxford Medical Publications.
Eckermann S, Willan A. 2008. The option value of delay in Health Technology Assessment. Medical Decision Making28:300-5.
Economist Intelligence Unit. 2008. The NICE u-turn on Lucentis raises more questions about the UK reimbursement system.The Economist.
European Medicines Agency. 2009. European Medicines Agency. Available athttp://www.ema.europa.eu/(accessed 16/12/2009.
Evans R, Boseley S. 2006.Drug firms’ lobby tactics revealed. InThe Guardian.
Freemantle N, Hill S. 2004.Evaluating pharmaceuticals for health policy and reimbursement. Oxford: Blackwell.
Gajraj E, Chung H, Boysen M, Barnett D, Longson C. 2009. Lenalidomide for the treatment of relapsed multiple myeloma.Lancet10:647-8.
Green C, Bryant J, Takeda A, Cooper K. 2006. Bortemozib for the treatment of multiple myeloma patients. InSouthampton Health Technology Assessments Centre: University of Southampton.
Griffin S, Claxton K, Palmer S, Sculpher M. 2010. Dangerous omissions: the consequences of ignoring decision uncertainty.Health EconomicsDOI:10.1002/hec.1586.
House of Commons Health Committee. 2005.The influence of the pharmaceutical industry: Fourth Report of Session 2004-2005. InFourth Report of Session 2004-2005. London: The Stationery Office.
Institute of Medicine. 2009. Initial national priorities for comparative effectiveness research. Washington, DC:Institute of Medicine.
Jackson E. 2010. Top-up payments for expensive cancer drugs: rationing, fairness and the NHS.The Modern Law Review73:399-427.
Lu C, Williams K, Day R. 2007. The funding and use of high-cost medicines in Australia: the example of anti-rheumatic biological medicines.Australia and New Zealand Health Policy4:2.
Lu C, Williams K, Day R, March L, Sanson L, Bertouch J. 2004. Access to high cost drugs in Australia. BMJ329:415-6.
Martin S, Rice N, Smith P. 2008. Does health care spending improve health outcomes? Evidence from English programme budgeting data.Journal of Health Economics27:826-42.
Moldrup C. 2005. No cure, no pay.BMJ330:1262-4.
National Institute for Health and Clinical Excellence. 2008.First report of the health committee 2007-2008. London:Stationery Office.
National Institute for Health and Clinical Excellence (NICE). 2008.Guide to the methods of technology appraisal. London:NICE.
Neumann P, Tunis S. 2010. Medicare and medical technology — the growing demand for relevant outcomes.NEJM362:377-9.
NICE. 2001.Guidance on the use of temozolomide for the treatment of recurrent malignant glioma (brain cancer). London:NICE.
NICE. 2002.Guidance on the use of imatinib for chronic myeloid leukaemia. London:NICE.
NICE. 2003a.Guidance on the use of photodynamic therapy for age-related macular degeneration. London:NICE.
NICE. 2003b.Rituximab for aggressive non-Hodgkin’s lymphoma. London: NICE.
NICE. 2004.Clinical guideline CG 15- Type 1 diabetes diagnosis and management of type 1 diabetes in children and young people. London:NICE.
NICE. 2005.Clinical guideline CG24- The diagnosis and treatment of lung cancer. London:NICE. NICE. 2009.Sunitinib for the first-line treatment of advanced and/or metastatic renal cell carcinoma. London: NICE.
NICE. 2010.Lung cancer (non-small-cell, first line) - gefitinib: appraisal consultation document. London:NICE.
Phillips Z, Claxton C, Palmer S. 2008. The half-life of truth? what is the appropriate time horizons for research decisions?Medical Decision Making28:287-99.
Pickin M, Cooper C, Chater T, O'Hagan A, Abrams K, Cooper N, Boggild M, Palace J, Ebers G, Chilcott J, Tappenden P, Nicholl J. 2009. The multiple sclerosis risk sharing scheme monitoring study- early results and lessons for the future.BMC Neurology9.
Pollack A. 2007.Pricing pills by the results. InNew York Times. New York.
Pollack A. 2009.Drug deals tie prices to how well patients doInNew York Times. New York.
Rutten F, Uyl-de Groot C, Vulto A. 2009. Innovative payment systems for medicines in Europe.EJHP Practice15:60-2.
Schluessmann E, Diel P, Aghayev E, Zwieg T, Moulin P, Roder C. 2009. SWISSspine: a nationwide registry for health technology assessment of lumbar disc prostheses.European Spine Journal 18:851-61.
Sparrowhawk K. 2007. NICE shares risk with the drug industry.World Pharmaceutical News3291:6. Taylor R, Drummond M, Sakeld G, Sullivan S. 2004. Inclusion of cost effectiveness in licensing requirements of new drugs: the fourth hurdle.BMJ329:972-5.
Thomson D. 2008. Position statement on “risk sharing” schemes in oncology. British Oncology Pharmacy Association.
Towse A, Garrison L. 2010. Can't get no satisfaction? Will pay for performance help?: Towards an economic framework for understanding performance-based risk-sharing agreements for innovative medical products.Pharmacoeconomics28:93-102.
Tunis S, Whicher D. 2009. The national oncologic PET registry: lessons learned for coverage with evidence development.Journal of the American College of Radiology6:360-5.
U.S. Food and Drug Administration. 2009. U.S. Food and Drug Administration. Available at
http://www.fda.gov/(accessed 16/12/2009).
Wagstaff, A. 2009. Health rationing in Europe: can cancer get a fair hearing?Cancer World30. Wellpoint National Pharmacy and Therapeutics Committee. 2008. Health technology assessment guidelines. Drug submission guidelines for re-evaluation of products, indications and formulations. Available at https://www.wellpointnextrx.com/shared/noapplication/f1/s0/t0/pw_ad080614.pdf.
Whalen J. 2007.Europe's drug insurers try pay-for-performance. InWall Street Journal.