Investigation of moisture condition and Autoclam sensitivity on air
permeability measurements for both normal concrete and high
performance concrete
K. Yang
a,b,⇑, P.A.M. Basheer
a, B. Magee
a, Bai Y
a,c aSchool of Planning, Architecture and Civil Engineering, Queen’s University Belfast, UK b
College of Material Science and Engineering, Chongqing University, China c
Department of Civil, Environmental and Geomatic Engineering, University College London, England, UK
h i g h l i g h t s
We study variations of relative humidity and electrical resistance after drying and conditioning.
We investigate influences of moisture content and distribution on results of the Autoclam air permeability. We examine the sensitivity of the Autoclam air test to measure permeability of HPCs.
Drying in an oven at 50°C and 35% RH for 14 days can eliminate the effect of moisture variation on the Autoclam air test. The Autoclam air test is unable to differentiate the differences between HPCs, but the BS-EN water penetration test does.
a r t i c l e
i n f o
Article history:
Received 2 December 2012
Received in revised form 22 May 2013 Accepted 17 June 2013
Available online 28 July 2013
Keywords:
In situ air permeability test High performance concrete Relative humidity Resistance
Water penetration test
a b s t r a c t
While on site measurement of air permeability provides a useful approach for assessing the likely long term durability of concrete structures, no existing test method is capable of effectively determining the relative permeability of high performance concrete (HPC). Lack of instrument sensitivity and the influence of concrete moisture are proposed as two key reasons for this phenomenon. With limited sys-tematic research carried out in this area to date, the aim if this study was to investigate the influence of instrument sensitivity and moisture condition on air permeability measurements for both normal con-crete and HPC.
To achieve a range of moisture conditions, samples were dried initially for between one and 5 weeks and then sealed in polythene sheeting and stored in an oven at 50°C to internally distribute moisture evenly. Moisture distribution was determined throughout using relative humidity probe and electrical resistance measurements. Concrete air permeability was subsequently measured using standardised air permeability (Autoclam) and water penetration (BS EN: 12390-8) tests to assess differences between the HPCs tested in this study.
It was found that for both normal and high performance concrete, the influence of moisture on Auto-clam air permeability results could be eliminated by pre-drying (50 ± 1°C, RH 35%) specimens for 3 weeks. While drying for 5 weeks alone was found not to result in uniform internal moisture distribu-tions, this state was achieved by exposing specimens to a further 3 weeks of sealed pre-conditioning at 50 ± 1°C. While the Autoclam test was not able to accurately identify relative HPC quality due to low sensitivity at associated performance levels, an effective preconditioning procedure to obtain reliable air permeability of HPC concretes was identified.
Ó2013 The Authors. Published by Elsevier Ltd.
1. Introduction
Use of high-performance concrete (HPC) is an established ap-proach to enhancing the durability of reinforced and pre-stressed concrete structures[1,2].
However, with performance levels of HPC typically based on laboratory-based testing[1], the long term, in service performance of concrete structures is largely dependent on contributing factors
0950-0618Ó2013 The Authors. Published by Elsevier Ltd.
http://dx.doi.org/10.1016/j.conbuildmat.2013.06.087
⇑Corresponding author at: College of Material Science and Engineering, Chon-gqing University, China. Tel.: +86 023 65127326.
E-mail addresses:[email protected],[email protected](K. Yang).
Contents lists available atSciVerse ScienceDirect
Construction and Building Materials
j o u r n a l h o m e p a g e : w w w . e l s e v i e r . c o m / l o c a t e / c o n b u i l d m a t
Open access under CC BY license.
such as construction quality. Against this background, an ability to undertake accurate in situ quality assessment of HPC is very important.
Most concrete durability problems are directly related to the in-gress of various agin-gressive substances, such as Cl , SO24 and CO2
[3,4]and numerous techniques have been developed to measure related permeation properties in order to assess/predict structural durability[5,6]. Although water permeability tests are suitable for in situ performance assessment, air permeability tests have gradu-ally become popular due to their simplicity, short test durations and lack of physical/chemical interaction during measurements
[5,7].
While many researchers[8–10]have undertaken HPC air per-meability assessments using available in situ techniques, reported results have not been conclusive. As air permeability is affected by concrete’s pore structure and moisture condition, one explanation for this is the influence of moisture. As there is no standard pre-conditioning regime for field methods, most in situ experiments are carried out under site-specific moisture conditions. Without appropriate preconditioning methods, the influence of moisture is likely to be a significant cause of variable and leads to non-reli-able test results. A secondary cause of HPC result variability is likely to be low levels of instrument sensitivity, as most systems currently on the market were designed to measure the permeabil-ity properties of normal concrete[11,12]. As HPC permeability lev-els are typically low, relative performance differences become difficult to detect.
Against this background, the aim of this study is to propose a suitable pre-conditioning regime for air permeability tests and to assess the ability of the Autoclam test to identify relative HPC per-formance levels. In order to achieve this aim, concrete specimens were dried and conditioned before moisture conditions were examined using relative humidity and electrical resistance mea-surements. Air permeability was measured using the Autoclam test method at different moisture conditions. In addition, standard water penetration laboratory-based testing was carried out to examine relative HPC permeability and to enable comparisons with Autoclam air testing results.
2. Experiment programme
2.1. Materials and concrete mixes
Based on previous experimental work undertaken at Queen’s University[8,13], two HPCs and one normal concrete were considered as part of this study. The mix compositions are reported inTable 1.
With a water/binder ratio of 0.68, the reference, normal concrete contained Portland cement as a binder material only. Similarly, the first HPC considered (la-belled HPC1-PC) contained Portland cement only but at a water/binder ratio of 0.30. Typical for HPCs[1], the second HPC considered contained a ternary binary
blend of Portland cement, micro silica (MS) and pulverised fuel ash (PFA). The water/binder ratio in this case was 0.3. In all cases the cement used was type CEM-II confirming to BS EN 197: 2000[14]. The PFA, conforming to BS EN 450: 2005[15], was sourced from Kilroot Power station in Northern Ireland and the MS in slurry form, conforming to BS-EN 13263-1: 2009[16], from Elkem. A poly-carboxylic acid-based polymer superplasticiser, commercially available as Chem-crete HP3, was additionally used for the HPC mixes to maintain a constant slump range.
The fine aggregate was medium graded natural sand and the coarse aggregate both 10 and 20 mm crushed basalt used in equal proportions. The moisture condi-tion of the aggregates was controlled by pre-drying in an oven at 105 ± 5°C for 24 h followed by cooling to 20 ± 1°C for one day before mixing.
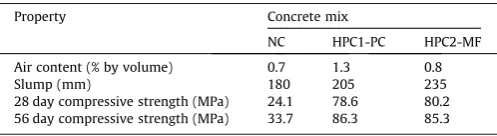
Each concrete mix was tested for air content[17], slump[18]and compressive strength[19], the results of which are shown inTable 2. The disparity between the normal concrete and HPC is evidenced by the variation in 28-day compressive strength, which was approximately 24 N/mm2
for mix NC and 80 N/mm2
for both HPC mixes.
2.2. Specimen preparation and testing
For each concrete mix, fifteen 230230100 mm slabs were manufactured for both moisture-conditioning and air permeability testing, and 100 mm cube specimens for compressive strength testing. The slab specimens contained pre-formed cavities at depths of 10, 20, 30 and 40 mm and embedded four pairs of stainless steel electrodes for testing relative humidity and electrical resistance
(seeFig. 1). The cavities were sealed by rubber plugs to ensure that the reading
in the hole is not affected by the ambient conditions.
Concrete mixing was undertaken in accordance with BS 1881, Part 125: 2005
[image:2.595.313.562.85.153.2][20] and the fresh concrete was assessed for consistence (slump test) and air content. Concrete was compacted in moulds in two layers using a vibrating table, covered with wet hessian and placed in a constant temperature room (18 ± 2°C).
Table 1
Concrete mix proportions.
Constituents Concrete mix
Normal concrete (NC) HPC1 (PC) HPC2 (MF) PCa
(kg/m3
) 375 485 352
Microsilica (kg/m3
) 0 0 36
PFA (kg/m3
) 0 0 97
Sand (kg/m3
) 625 689 652
Coarse aggregate (kg/m3
) 1136 1150 1150 Water (kg/m3) 256 145 145
Superplasticiserb(%) 0 1.3 1.5
Water/binder ratio 0.68 0.30 0.25
a
PC was CEM II contained 85 ± 0.5% Portland cement clinker and 15 ± 0.5% limestone powder.
b
[image:2.595.317.556.147.424.2]Polycarboxylic acid based polymer superplasticiser, as percentage of binder content.
Table 2
General properties of concrete in this work.
Property Concrete mix
NC HPC1-PC HPC2-MF Air content (% by volume) 0.7 1.3 0.8 Slump (mm) 180 205 235 28 day compressive strength (MPa) 24.1 78.6 80.2 56 day compressive strength (MPa) 33.7 86.3 85.3
Autoclam base ring Rubber bung
Preformed hole (40 mm) Preformed hole (20 mm) 30mm 20mm electrodes Diameter of the
hole: 20 mm
(a) The sectional view of the specimen
Autoclam base ring
Drying shrinkage tube Exposed length (20 mm)
Drying shrinkage tube Preformed hole
(30 mm) Preformed hole
(10 mm)
(b) The sectional view of the specimen
[image:2.595.42.294.615.716.2]All specimens were de-moulded after 24 h and placed in a constant tempera-ture water bath (20 ± 1°C). Cube specimens were removed after 28 and 56 days and tested for compressive strength. Slab specimens were removed after three days, wrapped in polythene sheets and relocated to a constant temperature room (20 ± 1°C) for 90 days to remove any influence of hydration on subsequent test re-sults. After this 90 day period, slab sides were painted with three coats of an epoxy paint to prohibit moisture transport. Following recommended procedures the slabs were then saturated by incremental immersion[13,21], involving exposure of half their thickness to water to allow both water absorption and air removal. After 24 h a further quarter of the specimen depth was exposed to water before complete immersion after 48 h.
At the end of the saturation period, initial electrical resistance measurements were taken and slabs were placed in a drying cabinet at a temperature of 50 ± 1°C and relative humidity of 35%. Five different drying periods of 7, 14, 21, 28 and 35 days were considered, after which three slabs for each mix were removed from the oven, wrapped in polythene sheet and cooled to room temper-ature (around 20°C) for 1 day. Air permeability, relative humidity and electrical resistance measurements were then taken. The slabs were then conditioned by being wrapped in polythene sheet and place back into the drying cabinet (50 ± 1°C) to encourage uniform internal moisture distribution. By the end of 2 weeks of this conditioning regime, the sealed specimens were transferred to a testing laboratory (20 ± 1°C) and re-tested for air permeability, relative humidity and resistance.
[image:3.595.35.546.87.316.2] [image:3.595.225.546.90.572.2]After carrying out the last set of Autoclam air permeability tests, three 100 mm diameter cores were cut from the specimens and side surfaces coated with epoxy resin to prevent any lateral flow of air during testing. The samples were then satu-rated by incremental immersion as described above and then tested for water pen-etration in accordance with BS EN 12390-8: 2000[22]. The curing, preparation, drying/conditioning and testing regime for the slab specimens is summarised in
Table 3.
2.3. Test methods
2.3.1. Relative humidity (RH)
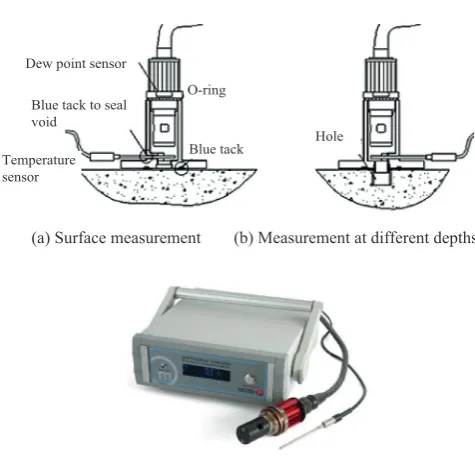
A commercially available, chilled mirror dew-point probe was used to measure RH. The test arrangement for RH measurements followed procedures developed previously by Basheer and Nolan[23]and involved testing at the surface and at depths of 10, 20, 30 and 40 mm within preformed cavities (seeFig. 2). Following recommendations, stable results were obtained after one hour. Each RH value plot-ted inFigs. 6 and 7is the average of two separate measurements.
2.3.2. Electrical resistance
As variation of electrical resistance is capable of representing the movement and distribution of moisture in concrete[24], measurements between electrodes embedded at 10, 20, 30 and 40 mm below the surface (seeFig. 1) were recorded using a TINSLEY resistance meter (Fig. 3). The average of two measurements was reported.
2.3.3. Autoclam air permeability
The Autoclam permeability system was developed by Queen’s University Belfast to measure the sorptivity, air permeability and water permeability of concrete cov-er on site[12,25]In this study a standard base ring with an internal diameter of 50 mm was used to isolate a test area on the surface of the concrete blocks, before the instrument was pressurized manually using a syringe attached to the base of the testing system (seeFig. 4). At the desired pressure of 0.5 bar, the test com-menced automatically and pressure decrease monitored every minute for 15 min. The natural logarithm of air pressure was plotted against time, with the slope of the last five data points reported as the air permeability index (API) in ln(bar)/min.
2.3.4. BS-EN water penetration
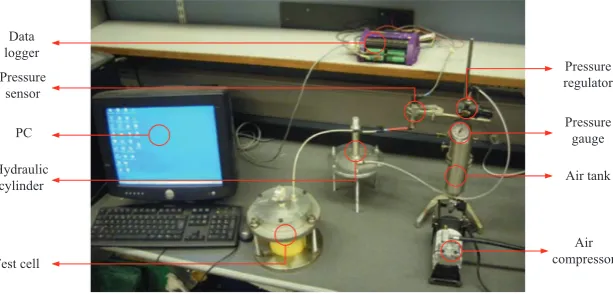
[image:3.595.306.544.331.564.2]Water permeability coefficients were determined using the water penetration test according to BS EN: 12390-8: 2000[22](seeFig. 5). Once the test arrangement was pressurized with air to 8.5–9 bar, the hydraulic cylinder was opened and a constant test pressure of 7.3 bar was applied for three days. At the end of the test,
Table 3
Slab specimen curing, preparation, drying/conditioning and testing regime.
Curing regime/specimen preparation Comments Sample curing and
preparation
Specimens de-moulded
3 days 20 ± 1°C Constant temperature water bath Initial curing period 90 days 20 ± 1°C Wrapped in polythene sheet and located in a
constant temperature room
Intended to remove influence of hydration on subsequent test results
3 days Sides painted with epoxy paint and specimens saturated by incremental immersion
Sample preparation to prohibit future moisture transport
Testing: Electrical resistance Initial moisture profiling.
Drying 1,2, 3, 4 or 5 weeks
50 ± 1°C RH 35% Drying cabinet. Assessment of drying time on performance 1 day 20°C Wrapped in polythene and cooled to room
temperature.
Pre-testing conditioning
Testing: Relative humidity, electrical resistance and air permeability Main testing programme Conditioning 2 weeks 50 ± 1°C Wrapped in polythene sheet placed in drying
cabinet
Undertaken to achieve uniform moisture distribution
1 day 20°C Wrapped in polythene and cooled to room temperature
Pre-testing conditioning
Testing: Relative humidity, electrical resistance and air permeability Main testing programme Sample preparation 3 days 100 mm diameter
cores extracted
Sample preparation Sides painted with epoxy paint and specimens saturated by incremental immersion.
Testing: Water permeability Confirmation testing
Dew point sensor
O-ring Blue tack to seal
void
Blue tack Temperature
sensor
Hole
(a) Surface measurement (b) Measurement at different depths
(c) Chilled mirror dew-point probe used in this study
specimens were split open and the depth of water penetration measured. Three 100 mm diameter cores were extracted from the slab specimens and tested for each concrete mix.
3. Results and discussion
3.1. RH after drying and conditioning
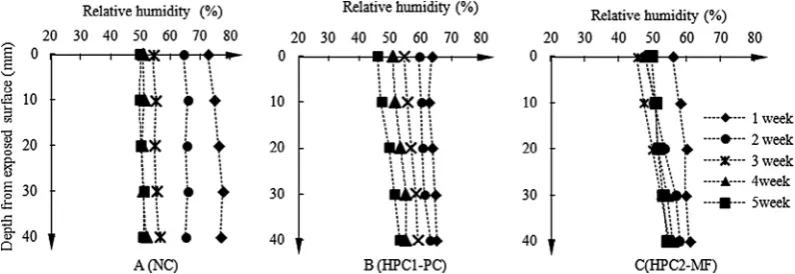
RH results at different depths from the exposed surface after drying for periods of 1–5 weeks are shown inFig. 6. As anticipated, RH values generally decreased with increasing periods of drying
[21]. It was also found that near-surface RH values were lower in comparison to interior results, meaning that drying conditions caused the development of moisture gradients. Fig. 6 also
highlights that the two HPCs considered had lower (on average 42%) RH values than the normal control concrete (around 60%) after 1 week of drying. This difference is most likely reflecting the fact that a fully saturated state is frequently difficult to reach for HPC[26,27], despite having used the incremental immersion method. As the control concrete inherently comprised relatively larger pores, it is likely that its moisture content was higher at the start of drying, thereby explaining its higher RH values.
Fig. 6additionally reveals that between 2 and 5 weeks of drying, the reduction of RH was around 5% slower for the HPC relative to the control. This can be explained by the combined effects of water vapour transport under different RH ranges and the different char-acteristics of the pore structures. For HPC, finer and less connected pore structures make moisture transport slower[1]. Furthermore, most of the HPC’s RH readings were below 70%, indicating that most of the coarse capillaries were empty [26]. Research shows that further drying might have caused the removal of adsorbed moisture and some interlayer moisture when the RH was lower than 65%[28]. The behaviour of adsorbed moisture is quite differ-ent from free capillary moisture due to its high viscosity, with more energy required for its removal from the solid surface; a pro-cess which is very slow. As a result, drying rates of the HPC were lower at low RH values.
In agreement with previous research[13,29,30],Fig. 6also high-lighted that RH gradients existed even after 5 weeks of drying, sug-gesting that the drying regime used was not sufficient to establish equilibrium moisture conditions. In order to re-distribute moisture in this study, slabs were subsequently wrapped in a polythene sheeting and relocated into an oven at 50 ± 1°C for 14 days. The resulting relationships between RH at different depths from the ex-posed surface are re-plotted in Fig. 7, which shows that this ap-proach effectively removed RH gradients almost entirely. It was also noted that, after 4 weeks of drying, there was no significant difference in RH for the normal concrete, but the moisture distribu-tion was slightly different with each drying period for the HPC. As air permeability is not expected to vary when the RH of the con-crete is between 40% and 60%[31], it was susequently decided that the drying and conditioning procedures proposed were applicable to HPC prior to undertaking air permeability measurements.
3.2. Electrical resistance after drying and conditioning
[image:4.595.56.284.68.220.2]Electrical resistance ratios (Rt/Ri40) for each depth after drying are plotted in Fig. 8.Rt/Ri40is regarded as the relative change of resistance, withRi40the resistance value at 40 mm from the ex-posed surface after immersion for 72 h andRtthe resistance value at each recording depth after different drying periods.
[image:4.595.54.283.266.391.2]Fig. 3.Electrical resistance measurement using a resistance meter.
Fig. 4.The autoclam permeability system and syringe for applying air pressure.
Pressure regulator
Pressure gauge
Air tank
Air compressor Data
logger
Pressure sensor
Hydraulic cylinder
[image:4.595.151.458.592.739.2]Test cell PC
As expected, electrical resistance ratios generally increased with increasing drying periods, with more marked changes noted closer to specimen surfaces. This trend is attributable to the in-creased loss of moisture in this region as evidenced by the RH val-ues plotted inFig. 6.
Furthermore, minor increases in resistance ratio were noted during the first two weeks of drying, followed by more significant increases thereafter. As such, it can be inferred that prolonged dry-ing causes a loss of moisture connectivity within capillary pores. This trend is the converse of that noted for the RH results plotted inFig. 6. It has already been explained that during the drying pro-cess only free capillary water was lost initially, whilst adsorbed water was removed at the later stages of drying. When adsorbed moisture is lost, electrical current has to pass through the solid
phases of hydration, which have much higher resistivity. Therefore, the removal of adsorbed moisture could be considered as the rea-son for the sharp increases noted in electrical resistance[21,32].
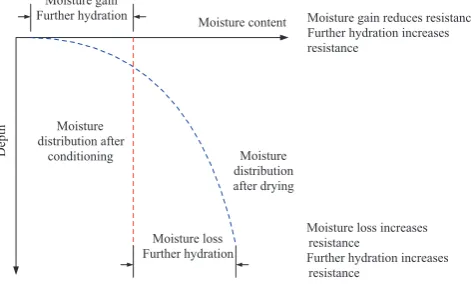
[image:5.595.92.491.66.219.2] [image:5.595.92.490.266.403.2]Fig. 9displays the variation of resistance ratio after both drying and conditioning specimens. Clearly, while conditioning decreased resistance ratio gradients, they could not be removed entirely. This behaviour shows an obvious contrast withFig. 6. It is believed due to the combined effects of moisture redistribution and further hydration on resistance, whereas RH measurements only represent moisture distribution and is not significantly affected by further hydration. The effective redistribution of moisture during the pre-conditioning stage is illustrated inFig. 10, which also shows mois-ture distributions after drying and conditioning. It is known that as hydration progresses, electrical resistance ratios generally increase Fig. 6.Relative humidity results at different depths after drying (50 ± 1°C, RH 35%) for different periods (1–5 weeks).
[image:5.595.92.491.444.578.2]Fig. 7.Relative humidity at different depths after drying (50 ± 1°C, RH 35%) for different periods (1–5 weeks) and conditioning (wrapped in polythene, 50°C) for 2 weeks.
[30], whereas the internal RH depends on the extent of redistribu-tion of moisture inside the concrete relative to the surface. During drying, internal moisture moves towards the surface where there
are significant moisture losses due to evaporation with associated reductions in the degree of hydration. The combined effect is to in-crease the resistance ratio at the near surface, which inin-creases with depth from the surface as depicted inFig. 8. However, two opposing effects exist during the conditioning process in the near surface re-gion; namely moisture gain and further hydration. During redistri-bution, free moisture increases near the surface due to its transport from inner regions to the near surface region, but potentially with no further improvements in the degree of hydration at this stage. As a result, the resistance ratio near the surface shows a combined reduction. On the other hand, resistance ratios at deeper levels after conditioning show greater values (as inFig. 10) as further hydration occurs at these depths, although there would be some loss of mois-ture during redistribution.
3.3. Influence of drying on reliability of Autoclam air permeability tests
Autoclam air permeability testing was used to investigate effects of moisture gradient and its suitability for ranking HPC per-formance was assessed. Fig. 11, which plots the effect of drying 10
20
30
40
1 10 100 1000
Depth from exposed surface (mm)
Resistance ratio (Rt/Ri40)
A (NC)
10
20
30
40
1 10 100 1000
Depth from exposed surface (mm)
B (HPC1-PC)
10
20
30
40
1 10 100 1000
Depth from exposed surface (mm)
C(HPC2-MF)
1w dry 1w con
2w dry 2w con
3w dry 3w con
4w dry 4w con
[image:6.595.149.458.68.517.2]5w dry 5w con
Fig. 9.Comparison of variation of resistance ratio after drying (50 ± 1°C, RH 35%) for different periods (1–5 weeks) and conditioning (wrapped in polythene, 50°C) for 2 weeks.
Depth
Moisture content
Moisture distribution after drying Moisture
distribution after conditioning Moisture gain Further hydration
Moisture loss Further hydration
Moisture gain reduces resistance Further hydration increases resistance
Moisture loss increases resistance
Further hydration increases resistance
[image:6.595.50.286.556.701.2]time on API, shows no obvious differences between normal con-crete and HPC prior to oven drying (i.e. at drying time of zero weeks). This implies that the effect of moisture content on air per-meability dominates over effect of concrete type. As such, and in line with previous research [13,21,22], this study confirms the inappropriateness of classifying concrete air permeability when the effect of moisture content has not been addressed.
[image:7.595.308.549.69.205.2] [image:7.595.64.250.554.723.2]Fig. 11also illustrates a sharp rise in API for normal concrete after 2 weeks of drying, with comparatively small increases there-after. For normal concrete, 2 weeks of drying resulted in RH values around 70% at 40 mm (the effective test depth for Autoclam). This means that most pores were free from capillary water in this re-gion and hence the effect of moisture on API has been eliminated
[12,32,33]. In the case of HPC, however, there were no significant changes in API beyond 1 week of drying. Indeed, API values for HPC had almost no variation before 3 weeks of drying and only minor increases thereafter. Correspondingly, all of the RH values of HPC above 40 mm (seeFig. 6) were around 50%. This implies that the influence of moisture on API is relatively small[22,31].
The relationship between API after specimen drying and condi-tioning is shown inFig. 12, which clearly illustrates lower values after conditioning. Both moisture redistribution and further hydra-tion are considered to be the reasons for this slight decrease in API after conditioning[13]. However, the influence is small for con-cretes dried beyond 3 weeks, illustrating that any effect of mois-ture redistribution on API was found to rely on the amount of
free moisture available in specimens. For normal concrete with rel-atively high free moisture contents, redistribution can reduce API significantly due to the increase in near-surface moisture content. This effect was found to decrease when concretes were dried for 2 weeks. In the case of HPC, it was found that the reduction of API was insignificant at all drying conditions.
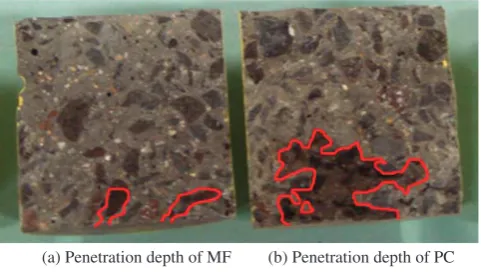
It is evident that API values for the two HPCs were very similar, even after a drying period of 5 weeks which has effectively re-moved any influence of moisture. Possible explanations for this phenomenon are that, firstly, no permeability differences existed between the two HPCs and, secondly, that the test method was not sufficiently sensitivity to distinguish any potential differences. The standard BS-EN laboratory water penetration test was per-formed to clarify this point as shown inFig. 13. From this Fig. it can be clearly seen that the penetration depth of HPC mix MF (average 13.6 mm) was appreciably lower than that of mix PC (average 35.7 mm), suggesting that significant permeability differences did exist between the two mixes.
From these findings it may be concluded that while the conven-tional Autoclam air permeability test is suitable for assessing nor-mal concrete performance, it is not sufficiently sensitive to detect relative HPC performance levels. This finding is perhaps not sur-prising given that the test method was developed primarily for testing normal concrete[12,33,34].
3.4. General discussion
It is generally accepted[35–37]that concrete drying regimes have the potential to damage the material’s microstructure. Numerous researches have reported, for example, that pore struc-tures will not maintain stability under high temperature
[5,12,38,39]. As such, this aspect was examined in this study using analytical methods and through comparisons with relevant infor-mation in the literature. Potential material damage was checked by studying the behaviour of moisture transport under different RH ranges.
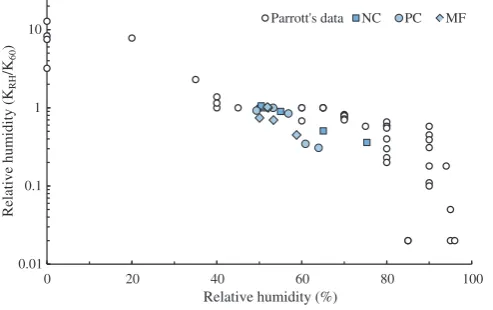
As RH reaches 65%, most capillaries contain no free moisture and adsorbed moisture loss commences, albeit with minimal effect on gel structure. Once RH is below 40%, however, interlayer mois-ture loss will occur[40], resulting in the collapse of fine pores and the formation of coarse pores. This can generate micro-cracking in the paste matrix and lead to more connected flow paths[12,36]. The influence of RH on air permeability has been previously exam-ined by Parrott[31], who plotted permeability as a function of RH, relative to permeability at 60% RH (KRH/K60). Three performance re-gions were identified from this work as follows:
(1) At RH between 100% and 60%, the influence of moisture on permeability is significant and examinations of air perme-ability in this range should be avoided.
Fig. 11.Effect of drying on air permeability index (API).
Fig. 12.Relationship of air permeability index (API) after drying (50 ± 1°C, RH 35%) for different periods (1–5 weeks) and conditioning (wrapped in polythene, 50°C) for 2 weeks.
(a) Penetration depth of MF (b) Penetration depth of PC
(2) At RH between 60% and 40%, air permeability measurements are generally constant, reflecting the fact that moisture effects have been removed.
(3) At RH between 40% and 0%, drying becomes aggressive and the microstructure of the paste matrix is significantly chan-ged, particularly below RH 20%. As such, pre-conditioning regimes should avoid drying concrete below this point.
The results from the current study are compared to Parrott’s data as shown inFig. 14, which illustrates very similar trends. As all RH values were maintained above 40% in the study reported in this paper, it may be concluded that the moisture condition in the gels was not significantly affected by the drying regime and, as such, no significant damage occurred in the gel phases.
4. Conclusions
Based on analysis of data obtained, the following conclusions have been drawn:
(i) After 28 days of drying, no significant difference in RH values was observed between the three different concretes tested, albeit that initial rates of moisture loss differed. Results fur-ther suggest that moisture gradients are effectively removed for all mixes after sealed conditioning for 2 weeks.
(ii) Gradients of electrical resistance after moisture redistribu-tion persist, which is not necessarily due to moisture distri-butions, but most likely caused by porosity gradients and variations in degree of hydration.
(iii) While the two HPCs examined exhibited different perme-ability based on the results of the BS-EN water penetration test, the conventional Autoclam air permeability test with a 50 mm diameter base ring was not able to distinguish these differences. This suggests that the sensitivity of this method merits improvement at the performance levels typ-ical for HPC.
(iv) It was concluded that for normal concrete, 14 days of drying was sufficient to negate effects of moisture gradients on API, due to removal of free moisture near the concrete surface. For HPC, the values of API are unable to clarify the influence of moisture due to the non-sufficient sensitivity of the conven-tional Autoclam, but the values of RH indicate that 3 weeks of drying are enough to remove capillary moisture within HPC.
Acknowledgements
The authors gratefully acknowledge the financial support pro-vided by both the Engineering and Physical Sciences Research
Council and Queen’s University Belfast for carrying out the investi-gation reported in this paper. The work was carried out at Queen’s University Belfast and facilities provided by the School of Planning, Architecture and Civil Engineering at Queen’s are gratefully acknowledged.
References
[1]Aïtcin PC. High performance concrete. Taylor & Francis; 1998.
[2]Neville AM. Properties of concrete. 4th ed. John Wiley&Sons; 1996.
[3]Mehta PK, Monteiro PJM. Concrete: microstructure, properties, and materials.
3rd ed. McGraw Hill; 2006.
[4]Basheer L, Kropp J, Cleland DC. Assessment of the durability of concrete from
its permeation properties: a review. Construct Build Mater 2001;15:93–103.
[5] Basheer PAM. Permeation analysis. In: Ramachandran VS, Beaudoin JJ, editors. Handbook of analytical techniques in concrete science and technology: principles, techniques and applications; 2001. p. 658–27.
[6]Bungey J, Millard SG, Grantham M. Testing of concrete in structures. 4th
ed. Spon Press; 2006.
[7]Abbas A, Carcasses M, Ollivier JP. Gas permeability of concrete in relation to its
degree of saturation. Mater Struct 1999;32:3–8.
[8]Elahi A, Basheer PAM, Nanukuttan SV, Khan QUZ. Mechanical and durability
properties of high performance concretes containing supplementary
cementitious materials. Construct Build Mater 2010;24(3):292–9.
[9]Romer M. Effect of moisture and concrete composition on the Torrent
permeability measurement. Mater Struct 2005;38(279):541–7.
[10] Jacobs F, Hunkeler F. Non destructive testing of the concrete cover–evaluation of permeability test data. In: International RILEM workshop, performance based evaluation and indicators for concrete durability. Madrid 2006. pp. 1–8.
[11]Torrent RT. A two-chamber vacuum cell for measuring the coefficient of
permeability to air of the concrete cover on site. Mater Struct 1992;25:358–65.
[12] Basheer PAM. ‘CLAM’ permeability tests for assessing the durability of concrete. PhD thesis, Belfast, Queen’s University Belfast; 1991. p. 438. [13] Russell DP. Influence of environmental conditions and material properties on
carbonation in concrete. PhD thesis, Belfast, Queen’s University Belfast; 1999. p. 335.
[14] BS-EN:197–1. Cement. Composition, specifications and conformity criteria for common cements. BSI; 2000. p. 52.
[15] BS-EN:450. Fly ash for concrete-part 1: definition, specifications and conformity criteria. BSI; 2005. p. 36.
[16] BS-EN:13263-1. Silica fume for concrete. Definitions, requirements and conformity criteria. BSI; 2009. p. 28.
[17] BS-EN:12350. Testing fresh concrete. Part 7: Air content. Pressure method, BSI; 2009. p. 24.
[18] BS-EN:12350. Testing fresh concrete. Part 2: Slump test, BSI; 2009. P. 9. [19] BS-EN:12390. Testing hardened concrete. Part 3: Compressive strength of test
specimens, BSI; 2009. p. 19.
[20] BS1881-125. Methods for mixing and sampling fresh concrete in the laboratory. BSI; 1986. p. 10.
[21] Nolan EA. Influence of near surface moisture gradients in concrete on ‘Autoclam’ permeation measurements. PhD thesis, Belfast, Queen’s University Belfast; 1996. p. 342.
[22] BS-EN12390. Testing hardened concrete. Part 8: Depth of penetration of water under pressure. BSI; 2000. p. 10.
[23]Basheer PAM, Nolan EA. Near-surface moisture gradients and in situ
permeation tests. Construct Build Mater 2001;15:105–14.
[24]McCarter W, Ezirim H, Emerson M. Absorption of water and chloride into
concrete. Mag Concr Res 1992;44:31–47.
[25]Basheer PAM, Long AE, Montgomery FR. The autoclam – a new test for
permeability, concrete. J Concr Soc 1994:27–9.
[26]Baroghe-Bouny V, Mainguy M, Lassabatere T, Coussy I. Characterization and
identification of equilibrium and transfer moisture properties for ordinary and
high-performance cementitious materials. Cem Concr Res 1999;29:1225–38.
[27]Persson B. Self-desiccation and its importance in concrete technology. Mater
Struct 1997;30:293–305.
[28]Baroghel-bouny V. Water vapour sorption experiments on hardened
cementitious materials Part I: essential tool for analysis of hygral behaviour
and its relation to pore structure. Cem Concr Res 2007;37(3):414–37.
[29]Burlion N. Induced anisotropic permeability due to drying of concrete. Cem
Concr Res 2003;33(5):679–87.
[30] McCarter W, Chrisp T, Butler A, Basheer PAM. Near–surface sensors for
condition monitoring of cover-zone concrete. Construct Build Mater
2001;15:115–24.
[31]Parrott LJ. Moisture conditioning and transport properties of concrete test
specimens. Mater Struct 1994;27:460–8.
[32]Rajabipour F, Weiss J, Shane JD, Mason TO, Shah SP. Procedure to interpret
electrical conductivity measurements in cover concrete during rewetting. J
Mater Civ Eng 2005;17:586–694.
[33] Arbaoui T. Finite Element Calibration of the CLAM. MSc thesis, Belfast, Queen’s University Belfast; 1988. p. 103
[34]Basheer PAM, Montgomery FR, Long AE. ‘CLAM’ tests for measuring in-situ
permeation properties of concrete. Nondestruct Test Eval 1995;12:53–73.
[35]Detwiler RJ, Powers LJ, Jakobsen UH, Ahmed WU, Scrivener KL, Kjellsen KO.
Preparing specimens for microscopy. Concr Int 2001;23:50–8.
0.01 0.1 1 10
0 20 40 60 80 100
Relative humidity (K
RH
/K
60
)
Relative humidity (%)
[image:8.595.47.294.69.224.2]Parrott's data NC PC MF
[36]Dhir RK, Hewlett PC, Chan YN. Near surface characteristics of concrete intrinsic
permeability. Mag Concr Res 1989;41:87–97.
[37]Wong HS, Buenfeld NR, Zobel M, Zimmerman RW. Influence of the interfacial
transition zone and microcracking on the diffusivity, permeability and
sorptivity of cement-based materials after drying. Mag Concr Res
2009;61(8):571–89.
[38]Farage M, Sercombe J, Galle C. Rehydration and microstructure of cement paste
after heating at temperatures up to 300°C. Cem Concr Res 2003;33(7):1047–56.
[39]Galle C, Sercombe J. Permeability and pore structure evolution of silico
calcareous and hematite high strength concretes submitted to high
temperatures. Mater Struct 2001;34:619–28.