Copyright © 2000, American Society for Microbiology. All Rights Reserved.
Patterns of Changes in Human Immunodeficiency Virus Type 1
V3 Sequence Populations Late in Infection
JULIE A. E. NELSON,1,2FRE´DE´RIC BARIBAUD,3TERRI EDWARDS,3ANDRONALD SWANSTROM1,2*
UNC Center for AIDS Research1and Department of Biochemistry and Biophysics,2University of North Carolina at
Chapel Hill, Chapel Hill, North Carolina 27599, and Department of Pathology and Laboratory Medicine,
University of Pennsylvania, Philadelphia, Pennsylvania 191043
Received 1 December 1999/Accepted 13 June 2000
We have used a V3-specific heteroduplex tracking assay (V3-HTA) with probes from two different human immunodeficiency virus type 1 (HIV-1) subtypes to examine the extent and pace of HIV-1 evolution late in infection. Twenty-four subjects with advanced HIV-1 infection (CD4ⴙT-cell count, <100/l) and stable viral
loads were studied using blood plasma samples collected over a study period of approximately 9 months, during which time most of the subjects were treated with reverse transcriptase inhibitors. The V3-HTA patterns from the first and last time points were evaluated initially to determine the amounts of change in V3 sequence populations, which were primarily changes in abundance in preexisting sequence populations. Three of the 24 subjects had major changes (greater than 50% total change in the relative abundance of the sequence populations), 11 subjects had intermediate changes (10 to 50% total change), and 10 subjects had minimal changes (less than 10% total change). The average total amount of change was between two- and threefold greater in subjects with X4-like variants, although there was no correlation between average viral load and the presence of X4-like variants. V3-HTA patterns in monthly samples from 11 of the subjects were also compared. In two subjects, the amount of change exceeded 40% in a 1-month period. Overall, the pace of change in V3 populations varied between subjects and was not constant within a subject over time. Sequence analysis of the V3 variants showed that R5-like variants (not containing any X4-associated substitutions) continued to be maintained in three subjects in the presence of X4-like variants, indicating that X4 variants do not always outgrow R5 variants. The coreceptor usage of the V3 sequences from two subjects was determined using a cell fusion assay. One subject had an X4 variant that was maintained at a low level for at least 9 months, during which time the predominant variants were R5X4 (dualtropic), while in the second subject the reverse situation was observed. One of the dualtropic variants had a novel sequence motif in V3, suggesting another evolutionary pathway to altered tropism. These studies begin to probe the complexities and pace of V3 evolution in vivo, revealing dynamic patterns of change among multiple V3 sequence variants in a subset of subjects.
The human immunodeficiency virus type 1 (HIV-1) genome has the capacity to undergo extensive evolution in vivo (15a, 31). The most dramatic evidence for the potential of this evo-lution is seen with the introduction of external selective pres-sure, i.e., antiviral drug therapy and the development of resis-tance to antiretroviral drugs. HIV-1 can also evolve over time to use different cell surface coreceptors. Virus that is transmit-ted typically uses only CCR5 as a coreceptor for entry into CD4⫹T cells (R5 variants) (30, 38), but later in infection virus
may evolve to use CXCR4 (X4 variants) (2, 8) or possibly other coreceptors (7, 11). These changes in tropism typically involve sequence changes in the V3 region of the viral Env protein.
Before the discovery of chemokine receptors as coreceptors for HIV-1 entry into CD4⫹T cells, macrophage tropism and
syncytium induction (SI) in MT-2 cells were common tests for the tropism of HIV-1 isolates. Macrophage tropism is associ-ated with CCR5 usage, while the SI phenotype is associassoci-ated with CXCR4 usage, although exceptions have been described (15, 33). A continuum of phenotypes exists for both tropism and coreceptor usage, with one example being the existence of viruses that can use both CCR5 and CXCR4 (R5X4; dualtro-pism). Schuitemaker et al. found that the in vitro phenotypes of viral isolates changed over time, going from
macrophage-tropic non-SI (NSI) to T-cell-macrophage-tropic NSI to T-cell-macrophage-tropic SI (30). They also found that once the SI viruses emerged they dominated in abundance. SI viruses are thought to appear just before a rapid CD4⫹T-cell loss in 50% of infected individuals,
although this value is based on a small number of subjects (35). SI variants actually may emerge in every infected person but may be transiently present in some individuals (31). In contrast to the dynamic evolution of V3 variants with altered tropism late in infection, the overall evolution ofenvappears to de-crease in late-stage infection (10).
We have used sequence variability in the region of theenv
gene encoding V3, as measured by a V3-specific heteroduplex tracking assay (V3-HTA), to examine the extent and pace of changes in the sequence and abundance of V3 populations in 24 HIV-1-infected subjects late in infection. V3-HTA was de-veloped to detect clustered mutations in V3 that are associated with the SI phenotype (24), which in turn is associated with a change in coreceptor usage to CXCR4 (34). We detected ma-jor changes in virus populations in 3 of the subjects in the current study (13%) and intermediate changes in 11 subjects (46%) over approximately 9 months and over a period when viral RNA loads were stable. Analysis of monthly samples from 11 of the subjects showed that the amount of change between time points varied widely between and within subjects. The greatest degree of change between consecutive time points occurred in subjects with X4-like variants, with the largest change being greater than 40% total virus population change within just 1 month. We also observed that minor populations
* Corresponding author. Mailing address: 22-006 Lineberger Cancer Center, CB#7295, University of North Carolina at Chapel Hill, Chapel Hill, NC 27599. Phone: (919) 966-5710. Fax: (919) 966-8212. E-mail: [email protected].
8494
on November 9, 2019 by guest
http://jvi.asm.org/
and 4 weeks, and every month thereafter. HIV-1 RNA quantitation was done using an Amplicor kit (Roche, Somerville, N.J.) (3).
RNA extraction and RT-PCR.Viral RNA was extracted from 140l of plasma using a QIAamp viral RNA extraction kit (Qiagen, Valencia, Calif.). Reverse transcription (RT)-PCR was performed as described previously (24) with minor modifications. Briefly, 20-l RT reaction mixtures consisted of 5l of the viral RNA-containing eluate from the QIAamp column, 1⫻ Expand HF buffer (Boehringer Mannheim Biochemicals, Indianapolis, Ind.), 2.5 mM MgCl2, 0.5 mM each deoxynucleoside triphosphate, 15 pmol of primer V3R5, and 12 U of avian myeloblastosis virus reverse transcriptase (Boehringer). RT reactions were carried out at 42 to 45°C for 30 min, and then the enzyme was inactivated at 99°C for 2 min. Thirty microliters of PCR mixture (1⫻Expand HF buffer, 2.5 mM MgCl2, 15 pmol of primer V3L4, 2.6 U of Expand HF enzyme mix [Boehringer]) was then added to each RT reaction mixture. PCR was carried out in a Robo-cycler 40 (Stratagene, La Jolla, Calif.) with the following program: 1 cycle of 95°C for 2 min 45 s, 52°C for 45 s, and 72°C for 1 min and 40 cycles of 95°C for 45 s, 52°C for 45 s, and 72°C for 1 min. One extra minute was added to the 72°C step after every 10 cycles.
V3-HTA.V3-HTA with the subtype B probe was performed as described by Nelson et al. (24). The subtype C probe was constructed by amplifying the V3 sequence from plasmid D516-11 (27), which was derived from an HIV-1-infected man from Malawi. The V3 sequence was amplified using primers V3L4 and V3R5 (24) to produce a 141-bp fragment that was cloned using a pT7Blue-3 Perfectly Blunt cloning kit (Novagen, Madison, Wis.). The upstreamEcoRI restriction site was destroyed by filling in with the Klenow fragment of DNA polymerase I (New England Biolabs, Beverly, Mass.) and religation, producing plasmid pJN33. The subtype C probe was labeled by first digesting 1.5g of plasmid pJN33 withEcoRI. The probe was labeled by filling in theEcoRI overhangs of the linearized plasmid in a reaction mixture containing 25Ci of [␣-35S]dATP (1,250 Ci/mmol; NEN Life Science Products, Boston, Mass.) and 1.5 U of the Klenow fragment for 15 min at room temperature. The enzymes were inactivated at 70°C for 10 min. The labeled probe was then released from the vector by digestion withBamHI. Excess radioactive nucleotide was removed using a MicroSpin G-50 column (Amersham Pharmacia Biotech, Arlington Heights, Ill.), and the volume was adjusted to 100l. Heteroduplex reactions using the subtype C probe were carried out as described for the subtype B probe (24). Dried gels were exposed to phosphorimaging screens for quantitation of the relative abundance of the bands in each sample using ImageQuant 3.3 software (Molecular Dynamics, Sunnyvale, Calif.); alternatively, autoradiograms were scanned for quantitation using NIH Image 1.62 software. The percent total change between two time points was calculated as
⌺兩A1⫺A2兩⫹兩B1⫺B2兩⫹...⫹兩X1⫺X2兩
2
whereAandBare the relative abundances of bands A and B at time 1 or time 2. Absolute values of the differences were used so that total change reflected both increases and decreases in abundance. The sum of the differences was halved because decreases in the abundance of one band resulted in increases in the abundance of the other bands in a sample; therefore, the maximum amount of change between two time points was 100%.
Sequence analysis.RT-PCR products of interest were purified using a QIA-quick PCR purification kit (Qiagen) and cloned using the pT7Blue-3 Perfectly Blunt cloning kit. Individual clones either were directly amplified by colony PCR using primers V3L4 and V3R5 or were first prepared using a QIAprep spin miniprep kit (Qiagen) and then amplified using primers V3L4 and V3R5. The PCR products were then screened by V3-HTA with the appropriate probe. Plasmids identified through colony PCR were prepared using the QIAprep miniprep kit before sequencing. Plasmids were sequenced either with T7 Seque-nase 2.0 (Amersham Pharmacia) or by ABI dye terminator sequencing (Perkin-Elmer Corp., Foster City, Calif.).
Recombinant env construction and coreceptor usage determination. The cloned V3 sequences from subject 1133 were reamplified using primers MLU
MUT (5⬘-TGTAGAAATTAATTGTACGCGTCCC-3⬘) and XBAMUT (5⬘-GT
TCTAGAGTGTTTTCCCATTTTGCTCTACTAATGTTAC-3⬘) in 50-l PCR
mixtures containing 1⫻Qiagen PCR buffer, 2.5 mM MgCl2, 200 M each deoxynucleoside triphosphate, 5 pmol of each primer, 1.5 U of QiagenTaq polymerase, and 10 ng of plasmid DNA. PCR was performed in a Robocycler 40 with the following program: an initial cycle of 95°C for 2 min 45 s, 43°C for 45 s, and 72°C for 1 min and 24 cycles of 95°C for 45 s, 43°C for 45 s, and 72°C for 1
min. Each PCR product was digested withMluI andXbaI and ligated into the pYE2envexpression clone. Plasmid pYE2 contains the YU-2envgene (20, 21) in vector pCRUni3.1 (Invitrogen);MluI andXbaI restriction sites flanking V3 have been added by site-directed mutagenesis (17). Cell-cell fusion assays were performed as described previously (28). Briefly, effector QT6 cells were infected with recombinant vaccinia virus expressing T7 polymerase and transfected with 30g of a recombinantenvexpression plasmid. Target QT6 cells were trans-fected with a CD4 expression plasmid, a coreceptor expression plasmid, and a luciferase reporter plasmid driven by the T7 promoter. After overnight expres-sion, the effector cells were added to the target cells to allow cell fuexpres-sion, and luciferase activity was quantified 7.5 h after cell mixing.
Nucleotide sequence accession numbers.The V3 sequences described here have been deposited in GenBank under accession numbers AF092638 to AF092653 and AF155884 to AF155906.
RESULTS
V3-HTA analysis using probes from subtypes B and C re-veals population shifts in a majority of late-stage infections.A cohort of 24 participants in the placebo arm of a ritonavir clinical trial (3) were studied by examining plasma samples collected at approximately 1-month intervals over an average of 240 days (range, 196 to 312 days). The subjects were chosen for study because they had relatively stable RNA levels throughout the trial (variation of less than 1.2 log10; Table 1). These subjects continued their pretrial reverse transcriptase inhibitor therapy during the study. All of the subjects studied had CD4⫹T-cell counts of less than 100/l as a criterion for
participation in the trial, and the median baseline CD4⫹T-cell
1027 5.71 5.55–5.84 16 C N
1029 5.11 4.70–5.47 5 C N
1034 5.55 5.29–5.87 48 B N
1036 5.21 4.80–5.48 17 B Y
1049 4.91 4.28–5.40 1 C N
1052 5.87 5.77–6.01 19 C Y
1053 5.75 5.60–6.02 10e C N
1060 4.70 4.31–5.02 1 C N
1063 5.40 5.24–5.56 2 C N
1064 4.40 4.14–4.54 7 C N
1066 4.27 3.96–4.54 34 B Y
1067 5.34 5.10–5.81 7 C N
1073 5.36 5.12–5.52 7 C N
1114 5.09 4.91–5.33 19 C N
1116 4.87 4.59–5.39 11 C N
1124 5.67 5.14–6.21 7 B Y
1133 5.23 4.81–5.58 53 B Y
1146 5.91 5.73–6.13 0 C Y
1151 5.08 4.70–5.53 6 C N
aLog10RNA levels.
bGeometric mean of all samples taken for the indicated patient during the
course of the study (between 8 and 12 samples per patient).
cRange of log10RNA levels measured for the indicated patient during the
course of the study.
dPresence of X4-associated genotype in any of the V3 sequences determined
(22). N, no; Y, yes. Cloned RT-PCR products were sequenced for most of the subjects with multiple bands, and bulk RT-PCR products were sequenced for subjects with a single dominant band or two equal bands that did not change over time (subjects 1064, 1067, and 1146).
eThe change in V3 populations in this subject was coincident with a change in
reverse transcriptase inhibitor therapy (addition of lamivudine at day 184).
on November 9, 2019 by guest
http://jvi.asm.org/
[image:2.612.312.549.92.345.2]count for these 24 subjects was 34/l. The short time intervals of sampling in this trial offered the possibility of detecting rapid shifts in virus populations.
V3-HTA (24) was performed using RT-PCR products gen-erated from plasma-derived viral RNA for all 24 participants at times corresponding to the beginning and end of the clinical trial. For subjects who were switched to ritonavir during the trial, the time point of the switch was used as the last time point for this study. The probe for V3-HTA represented the subtype B consensus sequence. Each RNA sample was used for two separate RT-PCR amplifications, and both RT-PCR products were analyzed for reproducibility by V3-HTA to document sufficient template sampling; faint bands that were not seen in the duplicate RT-PCRs were not counted as separate popula-tions. The results of one set of these analyses are shown in Fig. 1. Sixteen (67%) of the subjects (1012, 1018, 1021, 1024, 1027, 1034, 1036, 1052, 1063, 1064, 1067, 1073, 1114, 1124, 1133, and 1146) had multiple discrete populations of virus at the begin-ning of the study, defined as multiple bands in V3-HTA.
To determine whether V3 population changes occurred in the subjects in whom changes were not apparent visually with the subtype B consensus probe, we reexamined the RT-PCR products from 17 of the subjects using a probe cloned from a person infected with subtype C HIV-1 (27). This intersubtype probe has several clusters of mismatches with the subtype B consensus probe (Fig. 2A) that make the probe more sensitive to smaller sequence changes, including those that might appear among evolving R5 genotypes. Five of the subtype C V3-HTA patterns showed a larger number of discrete populations than had been seen with the subtype B probe, demonstrating that the subtype C probe was able to reveal additional variants (Fig. 2B).
[image:3.612.61.547.74.181.2]To quantify the changes in the virus populations over time, the relative percentage of each band in each sample was de-termined by phosphorimaging or densitometry, and the total amount of change in the relative abundance of the sequence populations was calculated for each subject. The percentages of total change in virus populations, as reflected in changes in
FIG. 1. V3-HTA analyses with the subtype B probe of the RT-PCR products from all 24 subjects. Only the bottom portions of the gels are shown. Day 1 was the start of the trial. The arrows on the left indicate the positions of the single-stranded probe (top) and the probe homoduplex (bottom). The bracket on the left indicates the range where heteroduplexes migrate.
FIG. 2. (A) Comparison of the sequences of the subtype B and C probes used for V3-HTA analyses. The subtype B probe sequence is from the JR-FL molecular clone (16), while the subtype C probe sequence is from an HIV-1-infected man from Malawi (27). Vertical lines indicate identity. (B) V3-HTA analyses with the subtype C probe of the RT-PCR products from 17 subjects who did not show changes with the subtype B probe. Labeling is the same as in Fig. 1.
on November 9, 2019 by guest
http://jvi.asm.org/
[image:3.612.63.539.553.700.2]discrete V3-HTA bands, are shown in Table 1. Three subjects had major changes (defined as greater than 50% total change with either probe), 11 subjects had intermediate changes (be-tween 10 and 50% total change), and 10 subjects had minimal changes (less than 10% total change) over the course of the trial. Overall, more than half of the subjects had easily detect-able shifts in their virus populations, as defined by shifts in V3 sequence population abundance. This result probably still rep-resents an underestimate of the amount of sequence change, since neither probe is able to detect all single nucleotide dif-ferences.
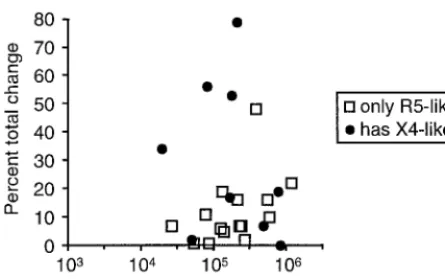
Subjects with X4-like variants have more dynamic virus populations.To determine whether there was a difference in the amount of change between subjects with and without X4-like variants, the percent total change (Table 1) was plotted against genotype and virus load (Fig. 3). Sequences were de-termined from cloned RT-PCR products for many samples and from the bulk RT-PCR products for most of the subjects for whom complete time courses were not determined (data not shown). These sequences were used to determine whether X4-like variants were present (Table 1). Sequences were iden-tified as X4-like if they had at least one basic amino acid substitution at a relevant position or at least two other X4-associated substitutions, as described by Milich et al. (22). Mixed sequence peaks in the sample from subject 1146 had the X4-associated substitutions 9S, 11R, and 23A, while the other two subjects with mixed sequence peaks, 1064 and 1067, had no X4-associated substitutions. In several cases, the sequences were not determined for the faint bands with X4-associated mobility in V3-HTA, so the number of subjects with X4-like variants likely is underestimated. Overall, the subjects with X4-like variants had more total change between the first and last time points than did subjects without X4-like variants, 29.7 and 11.9% average total changes, respectively (P⫽0.04; two-tailed Student’sttest). As a group, about half of the subjects with X4-like variant sequences had a greater than 30% change over the 9-month time period, while only one of the R5 vari-ants showed a greater than 30% change (Fig. 3). There was no difference, however, in average viral loads between subjects with and without X4-like variants (P⫽0.94).
Analysis of monthly samples reveals a different pace of change for each subject.For 10 of the subjects who showed substantial population changes between the first and last time points with the subtype B or C probe, the intervening monthly samples were analyzed by V3-HTA to define more narrowly the time period over which the population changes occurred. The intervening samples from subject 1124 were also analyzed;
minor sequence differences (mostly synonymous mutations) were seen among the multiple variants detected with the sub-type C probe (data not shown).
As shown in Fig. 4A, the shifts in V3 populations in subjects 1024 and 1133 were between X4-like sequences. Subject 1124 had fluctuations back and forth between an R5-like variant and an X4-like variant. The significant shift for subject 1012 was between the related R5-like variants 1 and 2, while the X4-like variants 3 and 4 remained relatively stable over time. Subjects 1036 and 1066 also had both R5-like and X4-like variants, while subject 1034 had only R5-like variants. Subjects 1004, 1114, 1029, and 1027, who were analyzed with the subtype C probe, had only R5-like variants (data not shown).
To determine the magnitude of change in the subjects for whom time course V3-HTA analyses were done, the relative abundance of each band or population was quantified after phosphorimaging for each sample and plotted in Fig. 4B. The amount of change between each pair of consecutive time points was also calculated to quantify the amount of change that occurred, especially in subjects with multiple variants (Fig. 4C). The relative abundance of variants and the amount of change between each pair of samples are not shown for the subjects analyzed with the subtype C probe; in general, V3 population changes detected with the subtype C probe were small. Overall, changes in V3 populations occurred at different rates between subjects and at different rates within a subject over time. Subjects 1024, 1124, and 1012 had at least a 30% change between one pair of consecutive time points and alter-nating periods of relative stability and instability. The greatest change in subject 1024 occurred when there was a switch in dominance from variant 1 to variant 4 between days 30 and 86. Subject 1124 had more than a 40% change between days 199 and 234, when variant 2 lost its dominance. Subject 1012 had more than a 40% change between days 58 and 85, when variant 1 became dominant. Of note, all three of these subjects had X4-like variants.
Five of the subjects (1133, 1036, 1066, 1034, and 1004) had smaller amounts of change over time, with a maximum 16 to 23% change between consecutive time points (Fig. 4C; data not shown for subject 1004). All types of genotypic mixtures (X4-like only, X4-like plus R5-like, and R5-like only) were observed in this group, with more moderate instability. Sub-jects 1133 and 1034 had 53 and 48% total change between the beginning and the end of the trial, respectively, because of the loss of variant 1 in each case (Fig. 4A and B); however, the accumulation of these changes over time was slow. The last three subjects, 1027, 1029, and 1114 (data not shown), had a maximum 5% change between time points, indicating that shifts in their V3 populations were slight. These three subjects had only R5-like variants.
Five subjects had changes in their reverse transcriptase in-hibitor therapy during the study. Therapy changes for subjects 1124 and 1034 are noted in Fig. 4B and C. None of the changes resulted in changes in viral RNA load of greater than 0.5 log (data not shown). In most cases, the switch in therapy did not seem to affect significantly the amount of change in V3
popu-FIG. 3. Percent total change in V3 sequence abundance between the first and last time points versus the average viral load for each subject.
on November 9, 2019 by guest
http://jvi.asm.org/
[image:4.612.63.286.71.210.2]on November 9, 2019 by guest
http://jvi.asm.org/
subjects starting potent ritonavir therapy suggests that the pop-ulations are often disrupted by the genetic bottleneck of resis-tance development, followed by reestablishment of the preex-isting V3 populations (W. Resch, J. A. E. Nelson, and R. Swanstrom, unpublished data).
Rare unusual variants can persist.A few of the subjects who showed changes with the subtype B probe had variants with divergent sequences that persisted at low levels throughout the period of study. Variant 3 from subject 1133 was maintained at 2 to 7% of the total and appeared to be largely unaffected by the population dynamics between the other two variants that were present (Fig. 4B). All three variants present in subject 1133 had X4 characteristics, but variant 3 differed from the other two variants at 14 out of 27 amino acid positions. Subject 1012 had two related variants (3 and 4) that were maintained at lower levels than the other variants, even though the se-quence changes at positions 8, 9, and 25 suggest evolution toward X4 usage (Fig. 4A). The rare variants in this subject differed from the more abundant variants at 10 out of 27 amino acid positions. A third subject, 1066, started with a variant with a four-amino-acid deletion, and later a second variant with a sequence very similar to the subtype B consensus sequence was detected (Fig. 4A), with no deletion and five additional amino acid changes. The presence of such highly divergent sequences in each of these subjects raises the possibility that these sub-jects harbor viruses that represent either superinfection or extensive evolution, perhaps to use a novel coreceptor or by sequestration in an isolated tissue. The presence of the corre-sponding bands in multiple samples from each of these subjects argues against fortuitous experimental contamination as the source of these unusual variants.
In a first attempt to explore the biological basis of these multiple V3 populations, the V3 variants from subjects 1133 and 1066 were tested for coreceptor usage to determine whether the highly divergent sequences also had divergent functions. The V3 sequences were placed into theenv gene from the R5 molecular clone YU-2 (19, 20). The recombinant
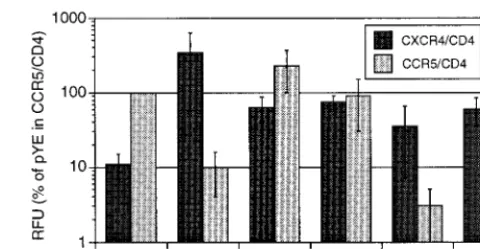
envgenes were expressed from an expression vector and tested for CCR5 or CXCR4 usage by a cell-cell fusion assay (28). For subject 1133, variants 1 and 2 used both coreceptors, while variant 3 was able to use only CXCR4 (Fig. 5). Therefore, subject 1133 harbored two dominant, related R5X4 variants, one of which was gradually lost over time, and a minor, highly divergent X4 variant that persisted. As expected, variant 2 from subject 1066 used only CXCR4 but, surprisingly, variant
1 used both coreceptors. The unexpected coreceptor usage of these divergent variants underscores the need for further anal-ysis of the V3 determinants of coreceptor usage. For variant 1 from subject 1066, several of the substitutions that diverge from the consensus sequence (5S and 27T) were previously identified as NSI-like because they appear predominantly in the absence of basic amino acid substitutions (22). The obser-vation that these substitutions may contribute to altered tro-pism to include CXCR4 (Fig. 5) suggests an alternative evo-lutionary pathway to CXCR4 tropism that does not include basic amino acid substitutions.
DISCUSSION
We have observed for a group of 24 subjects with advanced HIV-1 infection that in a majority of them, the viral sequence encoding V3 exists as multiple sequence populations. In addi-tion, a majority had detectable shifts in the abundance of the preexisting V3-defined virus populations; 3 had major changes and 11 had intermediate changes in their virus populations over an average of 9 months. These results likely are an un-derestimate of the amount of sequence change in the V3 re-gions of these subjects, since the probes used for V3-HTA were not sensitive to all nucleotide changes. The pace of evolution of V3 in 11 of the subjects varied between and within subjects, with the greatest amount of change between consecutive monthly time points occurring in subjects with X4-like geno-types. Two subjects had a greater than 40% total change over just 1 month.
The subjects in this study were being treated with reverse transcriptase inhibitor therapy that appeared to be subopti-mally effective, as evidenced by the high viral loads in each subject. In studies ofenvevolution during treatment with an-tiretroviral therapy, only highly effective treatment, i.e., with protease inhibitors, has been observed to disturb V3
popula-FIG. 5. Cell-cell fusion assay results for usage of CCR5 and CXCR4, aver-aged over three replicate experiments. Relative fluorescence units (RFU) are given as the percentage of RFU from pYE with CCR5 and CD4. pYE is the control YU-2envexpression clone; sequences of the V3 inserts for the 1133 and 1066 clones are the same as those shown in Fig. 4A. Data are means and standard errors of the means.
FIG. 4. (A) V3-HTA time courses for seven subjects with V3 population changes detected with the subtype B probe. Only the heteroduplex regions of the gels are shown, and the different variants are numbered starting from the bottom. The deduced amino acid sequences corresponding to the heteroduplexes are shown, with the full sequence given for the fastest migrating band. Positions 11 and 25 of V3 are indicated, and substitutions that are X4-like or associated with X4 viruses are underlined (22). Asterisks represent synonymous substitutions; dots represent deletions. Overall for these seven subjects, there were 64 coding changes and 10 noncoding changes when each of a subject’s sequences was compared with the sequence with the fastest heteroduplex mobility from that subject. (B) Relative abundance of each variant determined after phosphorimaging of the V3-HTA gels and plotted against time. Symbols are the same in all graphs (squares, variant 1; circles, variant 2; triangles, variant 3; diamonds, variant 4). Open symbols represent X4-like sequences; closed symbols represent R5-like sequences. Broken lines indicate the time of changes in reverse transcriptase inhibitor therapy for subjects 1124 and 1034 (3TC, lamivudine; d4T, stavudine). (C) Amount of change between consecutive time points plotted against time. The amount of change was calculated after phosphorimaging of the V3-HTA gel and relative quantitation of the bands in each sample.
on November 9, 2019 by guest
http://jvi.asm.org/
[image:6.612.311.551.71.195.2]tions. Nijhuis et al. found evidence of a genetic bottleneck for V3 in subjects who were treated with and developed resistance to ritonavir (25). Delwart et al. showed that there were rapid and dramatic changes in V3 to V5 during the development of resistance to ritonavir or nelfinavir, although the changes were usually transient (9). However, for two groups of subjects on zidovudine (AZT), there was no obvious effect on the evolu-tion of V3 while the virus was developing resistance, presum-ably because of the weak therapeutic effect of AZT in those subjects (18, 32). In a third study with AZT, transient changes in V3 were seen (37). Therefore, some of the changes that were seen in the V3 populations in the subjects in the current study could have been due to selective pressure on thepolgene by the inhibitors, but more likely the majority of the changes that we observed reflected changing selective pressure on the virus. Most of the variability in the V3 region, at least for subtype B HIV-1, is linked to changes in coreceptor usage from CCR5 to CXCR4 (6, 21, 22). In fact, in the absence of this type of change, V3 is no more variable than the conserved regions of
env (27). The small amount of V3 variability found in R5 sequences is usually not detected by V3-HTA with a probe from the same subtype, since clustered mutations are necessary for changes in heteroduplex mobility. SI variants and, by ex-tension, R5X4 and X4 variants evolve late in the disease course, and their appearance coincides with a rapid decline in CD4⫹T-cell numbers (8, 35, 36). These variants can be
de-tected biologically by growth in transformed T-cell lines or infection of cells expressing CXCR4 (1, 12) or genetically through the extensive sequence evolution in the V3 region that accompanies the change in tropism (13, 21, 24). Virus with the SI phenotype typically becomes the predominant virus that can be cultured from infected peripheral blood lymphocytes (30). However, our results suggest a more complex view of the coreceptor switch phenomenon, showing that even after V3 variants that have X4 characteristics have evolved, R5-like variants can be maintained as the predominant population (e.g., subject 1036). We also found that in subject 1133, an X4 variant was maintained at a low level, while the two dominant species were R5X4. Somewhat surprisingly, we detected no new appearances of X4-like variants among the 24 late-stage infections, precluding any insights into the initial evolution of variants of tropism. We did not find X4-like variants in 15 of the 24 subjects even late in infection, in contrast to the results of Shankarappa et al. (31), although we examined only a 9-month period of time and the X4-like variants could have been lost prior to this trial.
From the results presented here, it appears that ongoing evolution of virus populations can be dynamic even in late-stage infection, leading to significant changes in HIV-1 popu-lations. There are several possible sources for the selective forces that may drive these population shifts.
First, adaptation to CXCR4 usage may be an ongoing pro-cess, with evolution of variants that have a better affinity for the alternative coreceptor. Direct competition between variants for infection of susceptible cells may also play a role, where the variant that is able to use most efficiently the number and type of available coreceptors will reproduce in larger numbers for the next round of replication.
A related selective pressure relevant to late infection may be changes in total cell population; as the number of CD4⫹cells
decreases, cells that are specifically infected by a variant may be lost, so that the variant also is lost. Compartmentalization of cells may also contribute to the differential growth of variants. A concentration of cells expressing specific coreceptors or at a specific activation stage may provide a better environment for the growth of certain variants.
Second, antibody and/or cytotoxic T-lymphocyte (CTL) se-lection may be involved, since V3 can be a target of neutral-ization (14) and CTL recognition (29). However, the sensitivity of primary isolates to neutralization by polyclonal sera is not determined by their coreceptor usage (5, 23), suggesting that V3 does not become a target of neutralization after evolution to use a different coreceptor. CTL selection is also unlikely because V3 is highly conserved during the early part of infec-tion, when CTL selection is strongest, and most of the V3 variability is associated with changes in coreceptor usage.
A third type of selective pressure that we have not examined here is the effect of genetic bottlenecks on other regions of the genome that are under strong selective pressure, especially other regions of the envgene. For example, there may be a temporal link between changes in V3 and a previously identi-fied site in C4 that is frequently changed with the coreceptor switch (4, 22). We have also found evidence for temporal linkage between changes in V1 or V2 and V3 in two of the subjects included in this study (subjects 1124 and 1133; K. M. McGrath and R. Swanstrom, unpublished data).
The sum of these, and perhaps other, selective pressures results in the coexistence of multiple V3 sequence populations that can undergo significant and sporadic shifts, even at a time when the circulating CD4⫹T-cell numbers are low and viral
load is constant. Changes in the presence and abundance of the V3 sequence populations over time can be modeled to deter-mine the relative fitness of each variant within the host at a particular time. For instance, variant 2 of subject 1034 has a relative fitness of 1.05 over variant 1 during the first 114 days of the study (assuming a generation time of 2 days [26]). Over-all, the range of relative fitness values for pairs of variants inferred from the changes in abundance seen in Fig. 4 was 1.00 to 1.07, although most of the values could be calculated only with a subset of the time points, in which there was a unidi-rectional change in the abundance of a sequence population.
A few of the subjects examined here (1133, 1012, and 1066) showed persistence of a low-abundance variant that had a sequence quite different from those of the other variants found in those subjects. For subjects 1133 and 1012, these rare V3 sequences had X4-associated features that might be expected to have allowed them to become the dominant members of the population (30). The minor variant from subject 1133, in fact, was X4, while the dominant variants were both R5X4. How-ever, these rare variants were maintained for many months at low levels. In the third case, subject 1066, an R5X4 variant was the one that appeared and/or persisted, despite the fact that the more abundant variant was X4. Each of these low-abun-dance variants could represent dual infections with variants that are equally durable or superinfection with a virus able to establish a concurrent infection. Alternatively, they could be products of the high rate of evolution, which could result in minor variants that are selected for specific niches of suscep-tible cells in the body. An initial example of the potential for biological complexity comes from variant 1 in subject 1066, which was dualtropic but had none of the basic amino acid substitutions typically associated with tropism for CXCR4. A deeper understanding of the origin of these rare variants can be obtained by examining the sequences flanking the V3 region and by extensively examining the coreceptor preference of these stable, low-abundance variants.
ACKNOWLEDGMENTS
We thank Dale Kempf, Amy Potthoff, and Eugene Sun of Abbott Laboratories for providing the plasma samples from subjects in study M94-247. We also thank Terri Smith, Noah Hoffman, and Sumathy Arunachalam for technical assistance. The pYU-2 plasmid was obtained
on November 9, 2019 by guest
http://jvi.asm.org/
man, and E. M. Fenyo.1986. Replicative properties of human immunode-ficiency virus from patients with varying severity of HIV infection. Lancet
ii:660–662.
2.Berger, E. A., R. W. Doms, E.-M. Fenyo, B. T. M. Korber, D. R. Littman, J. P. Moore, Q. J. Sattentau, H. Schuitemaker, J. Sodroski, and R. A. Weiss.1998. A new classification for HIV-1. Nature391:240.
3.Cameron, D. W., M. Heath-Chiozzi, S. Danner, C. Cohen, S. Kravcik, C. Maurath, E. Sun, D. Henry, R. Rode, A. Potthoff, and J. Leonard.1998. Randomised placebo-controlled trial of ritonavir in advanced HIV-1 disease. Lancet351:543–549.
4.Carrillo, A., and L. Ratner.1996. Human immunodeficiency virus type 1 tropism for T-lymphoid cell lines: role of the V3 loop and C4 envelope determinants. J. Virol.70:1301–1309.
5.Cecilia, D., V. N. KewalRamani, J. O’Leary, B. Volsky, P. Nyambi, S. Burda, S. Xu, D. R. Littman, and S. Zolla-Pazner.1998. Neutralization profiles of primary human immunodeficiency virus type 1 isolates in the context of coreceptor usage. J. Virol.72:6988–6996.
6.Chesebro, B., K. Wehrly, J. Nishio, and S. Perryman.1992. Macrophage-tropic human immunodeficiency virus isolates from different patients exhibit unusual V3 envelope sequence homogeneity in comparison with T-cell-tropic isolates: definition of critical amino acids involved in cell tropism. J. Virol.66:6547–6554.
7.Choe, H., M. Farzan, Y. Sun, N. Sullivan, B. Rollins, P. D. Ponath, L. Wu, C. R. Mackay, G. LaRosa, W. Newman, N. Gerard, C. Gerard, and J. Sodroski.1996. The beta-chemokine receptors CCR3 and CCR5 facilitate infection by primary HIV-1 isolates. Cell85:1135–1148.
8.Connor, R. I., K. E. Sheridan, D. Ceradini, S. Choe, and N. R. Landau.1997. Change in coreceptor use correlates with disease progression in HIV-1-infected individuals. J. Exp. Med.185:621–628.
9.Delwart, E. L., H. Pan, A. Neumann, and M. Markowitz.1998. Rapid, transient changes at theenvlocus of plasma human immunodeficiency virus type 1 populations during the emergence of protease inhibitor resistance. J. Virol.72:2416–2421.
10. Delwart, E. L., H. Pan, H. W. Sheppard, D. Wolpert, A. U. Neumann, B. Korber, and J. I. Mullins.1997. Slower evolution of human immunodefi-ciency virus type 1 quasispecies during progression to AIDS. J. Virol.71:
7498–7508.
11. Doranz, B. J., J. Rucker, Y. Yi, R. J. Smyth, M. Samson, S. C. Peiper, M. Parmentier, R. G. Collman, and R. W. Doms.1996. A dual-tropic primary HIV-1 isolate that uses fusin and the beta-chemokine receptors CKR-5, CKR-3, and CKR-2b as fusion cofactors. Cell85:1149–1158.
12. Feng, Y., C. C. Broder, P. E. Kennedy, and E. A. Berger.1996. HIV-1 entry cofactor: functional cDNA cloning of a seven-transmembrane, G protein-coupled receptor. Science272:872–877.
13. Fouchier, R. A. M., M. Groenink, N. A. Kootstra, M. Tersmette, H. G. Huisman, F. Miedema, and H. Schuitemaker.1992. Phenotype-associated sequence variation in the third variable domain of the HIV-1 gp120 mole-cule. J. Virol.66:3183–3187.
14. Javaherian, K., A. J. Langlois, C. McDanal, K. L. Ross, L. I. Eckler, C. L. Jellis, A. T. Profy, J. R. Rusche, D. P. Bolognesi, S. D. Putney, and T. J. Matthews.1989. Principal neutralizing domain of the human immunodefi-ciency virus type 1 envelope protein. Proc. Natl. Acad. Sci. USA86:6768– 6772.
15. Jolly, P. E.1997. Replicative characteristics of primary isolates of the human immunodeficiency virus type 1 in peripheral blood mononuclear cells, pri-mary macrophages and CD4⫹transformed T-cell lines. Cell. Mol. Biol.
43:1057–1065.
15a.Korber, B., M. Muldoon, J. Theiler, F. Gao, R. Gupta, A. Lapedes, B. H. Hahn, S. Wolinsky, and T. Bhattacharya.2000. Timing the ancestor of the HIV-1 pandemic strains. Science288:1789–1796.
16. Koyanagi, Y., S. Miles, R. T. Mitsuyasu, J. E. Merrill, H. V. Vinters, and I. S. Y. Chen.1987. Dual infection of the central nervous system by AIDS viruses with distinct cellular tropisms. Science236:819–822.
17. Kunkel, T. A.1985. Rapid and efficient site-specific mutagenesis without phenotypic selection. Proc. Natl. Acad. Sci. USA82:488–492.
18. Leigh Brown, A. J., and A. Cleland.1996. Independent evolution of theenv andpolgenes of HIV-1 during zidovudine therapy. AIDS10:1067–1073. 19. Li, Y., H. Hui, C. J. Burgess, R. W. Price, P. M. Sharp, B. H. Hahn, and
G. M. Shaw.1992. Complete nucleotide sequence, genome organization, and biological properties of human immunodeficiency virus type 1 in vivo:
evi-23.
Hoxie, J. P. Moore, and D. P. Bolognesi.1998. Evidence that antibody-mediated neutralization of human immunodeficiency virus type 1 by sera from infected individuals is independent of coreceptor usage. J. Virol.72:
1886–1893.
24. Nelson, J. A. E., S. A. Fiscus, and R. Swanstrom.1997. Evolutionary variants of the human immunodeficiency virus type 1 V3 region characterized by using a heteroduplex tracking assay. J. Virol.71:8750–8758.
25. Nijhuis, M., C. A. Boucher, P. Schipper, T. Leitner, R. Schuurman, and J. Albert.1998. Stochastic processes strongly influence HIV-1 evolution during suboptimal protease-inhibitor therapy. Proc. Natl. Acad. Sci. USA95:14441– 14446.
26. Perelson, A. S., A. U. Neumann, M. Markowitz, J. M. Leonard, and D. D. Ho.
1996. HIV-1 dynamics in vivo: virion clearance rate, infected cell life-span, and viral generation time. Science271:1582–1586.
27. Ping, L.-H., J. A. E. Nelson, I. F. Hoffman, J. Schock, S. L. Lamers, M. Goodman, P. Vernazza, P. Kazembe, M. Maida, D. Zimba, M. M. Goodenow, J. J. Eron, Jr., S. A. Fiscus, M. S. Cohen, and R. Swanstrom.1999. Char-acterization of V3 sequence heterogeneity in subtype C human immunode-ficiency virus type 1 isolates from Malawi: underrepresentation of X4 vari-ants. J. Virol.73:6271–6281.
28. Rucker, J., B. J. Doranz, A. L. Edinger, D. Long, J. F. Berson, and R. W. Doms.1997. Cell-cell fusion assay to study role of chemokine receptors in human immunodeficiency virus type 1 entry. Methods Enzymol.288:118– 133.
29. Safrit, J. T., A. Y. Lee, C. A. Andrews, and R. A. Koup.1994. A region of the third variable loop of HIV-1 gp120 is recognized by HLA-B7-restricted CTLs from two acute seroconversion patients. J. Immunol.153:3822–3830. 30. Schuitemaker, H., M. Koot, N. A. Kootstra, M. W. Dercksen, R. E. Y. de Goede, R. P. van Steenwijk, J. M. A. Lange, J. K. M. Eeftink Schattenkerk, F. Miedema, and M. Tersmette.1992. Biological phenotype of human im-munodeficiency virus type 1 clones at different stages of infection: progres-sion of disease is associated with a shift from monocytotropic to T-cell-tropic virus populations. J. Virol.66:1354–1360.
31. Shankarappa, R., J. B. Margolick, S. J. Gange, A. G. Rodrigo, D. Upchurch, H. Farzadegan, P. Gupta, C. R. Rinaldo, G. H. Learn, X. He, X.-L. Huang, and J. I. Mullins.1999. Consistent viral evolutionary changes associated with the progression of human immunodeficiency virus type 1 infection. J. Virol.
73:10489–10502.
32. Sheehy, N., U. Desselberger, H. Whitwell, and J. K. Ball.1996. Concurrent evolution of regions of the envelope and polymerase genes of human im-munodeficiency virus type 1 during zidovudine (AZT) therapy. J. Gen. Virol.
77:1071–1081.
33. Simmons, G., D. Wilkinson, J. D. Reeves, M. T. Dittmar, S. Beddows, J. Weber, G. Carnegie, U. Desselberger, P. W. Gray, R. A. Weiss, and P. R. Clapham.1996. Primary, syncytium-inducing human immunodeficiency virus type 1 isolates are dual-tropic and most can use either Lestr or CCR5 as coreceptors for virus entry. J. Virol.70:8355–8360.
34. Speck, R. F., K. Wehrly, E. J. Platt, R. E. Atchison, I. F. Charo, D. Kabat, B. Chesebro, and M. A. Goldsmith.1997. Selective employment of chemokine receptors as human immunodeficiency virus type 1 coreceptors determined by individual amino acids within the envelope V3 loop. J. Virol.71:7136– 7139.
35. Tersmette, M., R. A. Gruters, F. de Wolf, R. E. Y. de Goede, J. M. A. Lange, P. T. Schellekens, J. Goudsmit, H. G. Huisman, and F. Miedema.1989. Evidence for a role of virulent human immunodeficiency virus (HIV) vari-ants in the pathogenesis of acquired immunodeficiency syndrome: studies on sequential HIV isolates. J. Virol.63:2118–2125.
36. Tersmette, M., J. M. A. Lange, R. E. Y. de Goede, F. de Wolf, J. K. M. Eeftink-Schattenkerk, P. T. A. Schellekens, R. A. Coutinho, J. G. Huisman, J. Goudsmit, and F. Miedema.1989. Association between biological prop-erties of human immunodeficiency virus variants and risk for AIDS mortal-ity. Lanceti:983–985.
37. Zhang, Y. M., S. C. Dawson, D. Landsman, H. C. Lane, and N. P. Salzman.
1994. Persistence of four related human immunodeficiency virus subtypes during the course of zidovudine therapy: relationship between virion RNA and proviral DNA. J. Virol.68:425–432.
38. Zhu, T., H. Mo, N. Wang, D. S. Nam, Y. Cao, R. A. Koup, and D. D. Ho.1993. Genotypic and phenotypic characterization of HIV-1 patients with primary infection. Science.261:1179–1181.