DIAG
SPLE
INVA
THE TA
NOSTIC
EEN SIZE
ASIVE M
COLL
DISSER
MEDIC
AMILNA
C
C UTILIT
E AND P
MARKER
LATERA
RTATIO
CAL GAS
BRA
AUG
ADU DR.M
HENNA
TY OF V
PLATELE
RS OF P
ALS IN C
ON SUBM
DM
STROEN
ANCH- 1
GUST 20
MGR ME
AI , TAMI
VENOUS
ET COU
PORTO S
CIRRHOT
MITTED
NTEROL
1V
011
EDICAL
ILNADU
S AMMO
UNT AS N
C
C
E
E
R
R
T
T
I
I
F
F
I
I
C
C
A
A
T
T
E
E
This is to certify that this dissertation entitled “DIAGNOSTIC “ UTILITY OF VENOUS AMMONIA, SPLEEN SIZE AND
PLATELET COUNT AS NON INVASIVE MARKERS OF PORTO
SYSTEMIC COLLATERALS IN CIRRHOTICS”, submitted by
S.BABU KUMAR to the faculty of Medical Gastroenterology, The
Tamilnadu Dr.MGR Medical University, Guindy, Chennai-600032, in partial fulfillment of the requirement for the award of DM Degree, Branch IV (Medical Gastroenterology) is a bonafide work carried out by him under my direct supervision and guidance.
P
Prrooff..DDrr..SS..JJeeeevvaannKKuummaarr,,MM..DD..,,DD..MM DDrr..SS..GGeeeetthhaallaakksshhmmii,,MMDD..,,PPhhDD
Professor and HOD, Dean,
Department of Digestive Health and Diseases, Kilpauk Medical College, Govt. Peripheral Hospital, Annanagar, Kilpauk, Chennai. Attached to Kilpauk Medical college, Chennai.
DIAGNOSTIC UTILITY OF VENOUS AMMONIA ,
SPLEEN SIZE AND PLATELET COUNT AS NON
INVASIVE MARKERS OF PORTO SYSTEMIC
A
A
C
C
K
K
N
N
O
O
W
W
L
L
E
E
D
D
G
G
E
E
M
M
E
E
N
N
T
T
S
S
I am greatly indebted to my guide DDrr..SS..JJeeeevvaannKKuummaarr,,MM..DD.,D.M., . Professor of Medical Gastroenterology, Department of Digestive Health and Diseases, Govt. Kilpauk Medical College, Chennai, for giving a chance to undertake this dissertation work under his guidance. Also I express my deep sense of gratitude for his encouragement, directions, periodical discussions, rigorous reviews and precious suggestions for shaping my dissertation. I also thank him for giving me the permission to do this dissertation in Govt. Peripheral Hospital, Anna nagar, Chennai-102.
I express my gratitude to DDrr..TT..PPuuggaazzhheennddhhii,,MM..DD..,D.M., Associate Professor, Department of Digestive Health and Diseases, Govt. Kilpauk Medical College, for his kind encouragement and review of my work, besides providing me with all the required facilities.
I am very much thankful to DDrr..JJ..RReevvaatthhyy,, MM..DD.., Prof & HOD, , Department of Biochemistry, who has guided me a lot in doing this dissertation.
I am extremely thankful to DDrr..RR..BBaallaammuurraallii,, MM..DD..,, DD..MM.., , Dr.G.Ramkumar, MM..DD..,, DD..MM.., , Dr.S.Chitra, MM..DD..,, DD..MM..,, and Dr.K.Muthukumaran, MM..DD..,, DD..MM..,, Assistant Professors in the Department of Digestive Health and Diseases, who have guided me a lot.
I am thankful to my colleagues DDrr.. A.A.CChheezzhhiiaann,, MM..DD..,, DrDr.. P
P..SSuubbrraammaanniiaann,, M.M.DD..,, DDrr.. D.D.SSaassii AnAnaanndd M.M.DD..,, DrDr.. T.T.AArruunn MM..DD..,, DDrr.. P
P..JJaaggaaddeessaann M.M.DD.,., DDrr.. B.B.PPrraakkaasshh ShShaannkkaarr MM..DD..,, DrDr.. R.R.SSeenntthhiill kukummaarr M
M..DD.,., DrDr.. A.A.RR..AAkkiilalannddeesswwaarrii M.M.DD..,, DDrr.. J.J.JJaayyaakkuummaarr M.M.DD..,, DrDr..RR..PPooppppyy R
Reejjooiicece M.M.DD..,, DrDr.. GG.S.Saatthyhyaa M.M.DD..,, DrDr..AA..SSeenntthhiill vavaddiivuvu MM..DD..,, and D
Drr..RR..VViinnootth h KKuummaarr,, MM..DD..,, who have helped me a lot in this dissertation.
I thank all the referring institutions and doctors for their trust and
timely referral of needy patients to our department. I thank all the patients who have ungrudgingly lent themselves to undergo this study, without which this study would not have seen the light of the day.
I also thank all the paramedical staffs of Govt. Peripheral Hospital, Anna nagar, who have helped me in doing this dissertation work.
C
C
O
O
N
N
T
T
E
E
N
N
T
T
S
S
Chapter 1: Introduction……… 1
Chapter 2: Review of Literature ……..……….…….. 6
Chapter 3: Aim of the study..……….……….27
Chapter 4: Materials and methods……….……… 28
Chapter 5: Results and statistical analysis………. 34
Chapter 6: Discussion……… 45
Chapter 7: Conclusion ……….………. 62
Bibliography
Appendix
INTRODUCTION
Portal hypertension is defined as portal pressure gradient of more
than 6 mm Hg. The hypertensive portal vein is decompressed by diverting
up to 90% of the portal flow through portasystemic collaterals back to the
heart resulting in enlargement of these vessels. These vessels are
commonly located at the gastro esophageal junction where they lie
subjacent to the mucosa and present as gastric and esophageal varices.
Duodenum , rectum , retroperitoneum are the other important sites where
significant collaterals form due to portal hypertension. However, due to
their higher resistance and increased portal venous inflow, these collaterals
are unable to decrease the hypertension.
Demonstration of the existence and extent of portosystemic
collaterals is important in the management of patients with portal
hypertension. The reported prevalence of esophageal varices in cirrhotic
patients is variable with figures ranging between 24% and 80%, with a
mean of about 60% 1: The prevalence of varices seems to be related to the
degree of liver dysfunction, 30% for compensated patients and of 60% for
decompensated patients 2 ,3. Because of this variability, it has been
recommended that all patients with cirrhosis should be evaluated by
The risk of developing varices in patients who’s initial endoscopy
is negative for varices is about 5- 8 % per year 6,8
. The rate of increase of
variceal size from small to large is not well defined. Those with small
varices tend to develop large varices by about 45% in 2 years time(9,10).
Variceal hemorrhage occurs in 25 to 40 percent of patients with
cirrhosis which accounts for 10–30% of all cases of upper gastrointestinal
bleeding . (11) .The annual incidence of variceal bleed in a non bleeder is
about 4% 12, 13 . Survivors of an episode of active bleeding have a 70
percent risk of recurrent hemorrhage within one year of the bleeding
episode 14
The mortality resulting from any bleeding episode may range from
< 10% in well compensated cirrhotic patients with Child–Pugh grade A to
> 70% in those in the advanced Child–Pugh C cirrhotic stage.(15- 18) .The
risk of re-bleeding is high, reaching 80% within 1 year .In view of the
relatively high rate of bleeding from esophageal varices and the high
associated mortality, an important goal of management of patients with
cirrhosis is the primary prevention of variceal hemorrhage.
There are several medical and surgical modalities available for
achieving either by decreasing portal hypertension (eg, beta blockers,
surgical portal decompression, or transjugular intrahepatic shunt.), or by
directly treating the varices themselves (eg, variceal ligation). Beta
blockers are effective in primary prevension of variceal bleed but this
Randomized trials and meta-analyses show that beta-blockers reduce the
number of bleeding events when used as primary prevention in esophageal
varices.19. However this treatment is not free from side effects.(20, 21).
The current recommendations are that follow-up endoscopy should
be performed at 2 to 3-year intervals in compensated patients with no
varices and at 1- to 2-year intervals in compensated patients with small
varices.22, 23
Once large varices have developed, there is no need for further
follow-up endoscopy; at this stage the patients should be treated to prevent
bleeding. The prevalence of large varices is only about 9- 36% in non
bleeders. These recommendations imply a considerable burden of
endoscopies and related costs; they require that patients repeatedly undergo
an unpleasant procedure, even though up to 50% of them may still not have
Therefore, these guidelines might not be ideal for clinical practice.
This inference is supported by recent studies from the United States and
Italysuggesting that the guidelines are not being fully adopted. 25, 26 .
Moreover, the guidelines were based largely on studies of patients with
cirrhosis due to viral hepatitis or alcohol abuse; accordingly, it is unclear to
what extent the guidelines may apply to patients with other causes of portal
hypertension.
To reduce the number of unnecessary endoscopies in patients with
cirrhosis but without varices, several studies have evaluated possible
noninvasive markers of esophageal varices in patients with
cirrhosis.27-33
. The conclusion from most of these studies is that by
selecting patients for endoscopic screening based on a few laboratory
and/or ultrasonographic variables , usually the platelet count and the
diameter of the portal vein , an appreciable number of endoscopies may be
avoided, while keeping the rate of undiagnosed varices, which are at risk
of bleeding, acceptably low . However, the predictive accuracy of such
noninvasive markers is still considered to be unsatisfactory, and none of
them has been recommended for use in clinical practice so far.34
esophageal varices and large spontaneous porto systemic shunt
presence. 30
Studies combining venous ammonia and other non invasive
predictors on Indian patients are limited . Such predictive factors may be
expected to vary in different populations because of differences in the
etiologies of liver cirrhosis, severity of liver disease. Therefore this study
was conducted to evaluate the utility of blood ammonia, spleen size and
platelet count as a predictor of esophageal varices and large spontaneous
porto systemic shunt presence.
LITERATURE REVIEW
PORTAL HYPERTENSION
The natural history of cirrhosis can be divided into a preclinical
phase and a subsequent clinical phase. The preclinical phase is usually
prolonged over several years; once clinical events such as the development
of ascites, encephalopathy, and variceal bleeding occur, the remaining
course of the disease is much shorter and usually fatal. Portal hypertension
is crucial in the transition from the preclinical to the clinical phase of
cirrhosis ; it is a contributive mechanism of ascites and encephalopathy
and a direct cause of variceal bleeding and bleeding-related death.
Portal hypertension in cirrhosis is determined by an increase in both
intrahepatic vascular resistance and portal venous inflow. Intrahepatic
vascular resistance is caused by the architectural distortion of the liver
resulting from fibrosis and by increased sinusoidal tone. Portal venous
inflow results from a combination of an hyper dynamic circulatory state
and increased plasma volume. In response to the increased portal pressure,
collateral circulation develops by the opening of preexisting vascular
channels and possibly by neoformation of vessels. From a clinical
vessels: they tend to increase in size with the increase of portal pressure
and rupture when wall tension exceeds a critical value.
Knowledge of the natural history of portal hypertension may help in
making important decisions about the diagnosis, monitoring and follow-up,
and treatment of patients with this condition.
Portal hypertension is classified accoding to the localization of the
flow resistance as pre hepatic , intra hepatic and post hepatic blocks. The
intra hepatic form is sub divided as presinusoidal , sinusoidal and post
sinusoidal portal hypertension
NON – PARENCHYMATOUS PORTAL HYPERTENSION
1. PREHEPATIC PORTAL HYPERTENSION 2. INTRAHEPATIC PORTAL HYPERTENSION A. PRESINUSOIDAL
PARENCHYMATOUS PORTAL HYPERTENSION B. SINUSOIDAL
C. POST SINUSOIDAL BLOCK
ESOPHAGEAL VARICES
Bleeding from ruptured esophagogastric varices is the most severe
complication of cirrhosis and is the cause of death in about one third of
cirrhotic patients. Varices form when the HVPG exceeds 10 mm Hg and
usually do not bleed unless the hepatic venous pressure gradient (HVPG)
exceeds 12 mm Hg 45. Gastroesophageal varices have two main inflows,
the first is the left gastric or coronary vein. The other major route of inflow
is the splenic hilus, through the short gastric veins.
Four distinct zones of venous drainage at the gastroesophageal
junction are particularly relevant to the formation of esophageal varices.
The gastric zone, which extends for 2 to 3 cm below the gastroesophageal
junction, comprises veins that are longitudinal and located in the
submucosa and lamina propria. They come together at the upper end of the
cardia of the stomach and drain into short gastric and left gastric veins. The
palisade zone extends 2 to 3 cm proximal to the gastric zone into the lower
esophagus. The perforating veins in the palisade zone do not communicate
with periesophageal veins in the distal esophagus. The palisade zone is the
dominant watershed area between the portal and systemic circulations.
More proximal to the palisade zone in the esophagus is the perforating
longitudinal and are termed perforating veins because they connect the
veins in the esophageal submucosa and the external veins.
The truncal zone, the longest zone, is approximately 10 cm in length, located proximally to the perforating zone in the esophagus, and usually
characterized by four longitudinal veins in the lamina propria. Veins in the
palisade zone in the esophagus are most prone to bleeding because no
perforating veins at this level connect the veins in the submucosa with the
periesophageal veins. Varices in the truncal zone are unlikely to bleed.
The periesophageal veins drain into the azygous system, and as a result, an
increase in azygous blood flow is a hallmark of portal hypertension.
GASTRIC VARICES
The fundus of the stomach drains through short gastric veins into the
splenic vein. In the presence of portal hypertension, varices may therefore
form in the fundus of the stomach. Splenic vein thrombosis usually results
in isolated gastric fundal varices. Because of the proximity of the splenic
vein to the renal vein, spontaneous splenorenal shunts may develop and
are more common in patients with gastric varices than in those with
esophageal varices.The overall prevalence of gastric varices varies among
Gastric varices are classified according to sarin et al. 47 About 70%
of the patients with gastric varices GOV 1, 21% had GOV 2, 6.7% had
IGV 1 and 1.4% had IGV 2. Gastric varices are significantly more
common in cirrhotic patients with a history of variceal bleeding than in
those who have not bled, perhaps indicating that gastric varices develop at
a more advanced stage of portal hypertension.Hemodynamic studies in
patients with large gastric varices have demonstrated a lower portal
pressure, large gastrorenal shunts, and less risk of hemorrhage but a
somewhat greater likelihood of portosystemic encephalopathy. The overall
incidence of bleeding from gastric varices is between 3% and 30%.47.
Varices involving the fundus, were the cause of bleeding in 67% of
all patients bleeding from gastric varices. Gastric varices tended to bleed
less frequently but more severely than esophageal varices.
PORTAL HYPERTENSIVE GASTROPATHY
Portal hypertensive gastropathy (PHG) is a collective term that
defines an array of diffuse macroscopic lesions observed in the gastric
mucosa of patients with portal hypertension. A classification of this entity
has been developed and its reproducibility has been thoroughly evaluated
pattern is present) and a severe form (when multiple red signs or
black-brown spots are present).
The prevalence of PHG in reported series is extremely variable (7%–
98%), The prevalence was relatively low (56%) in patients with a new
diagnosis of cirrhosis, higher (75%) in patients with a previous diagnosis
of cirrhosis and no prior bleeding, and even higher (91%) in patients with
a previous variceal bleeding episode with current or prior sclerotherapy.
Thus, PHG shows a strong correlation with the duration of cirrhosis
and the severity of portal hypertension, whereas the correlation with the
degree of liver dysfunction is weak. The endoscopic appearance of PHG is
stable in some patients and varies with time in most, showing steady
deterioration or sustained improvement in about one fifth of the patients
each, and fluctuations, with transition from mild to severe and vice-versa
on sequential endoscopies, in about one fourth of patients. Bleeding from
PHG can be acute or chronic. Endoscopically verified acute bleeding from
PHG occurs in 2.5% of patients and chronic bleeding occurs in 12% of
GASTRIC ANTRAL VASCULAR ECTASIA (GAVE)
GAVE ,also known as watermelon stomach is characterised by red
patches or spots in either a diffuse or linear array in the antrum of the
stomach , which can result in significant blood loss and leads to chronic
iron deficiency anemia Its etiology is unclear. Vasoactive substances may
play an important role in the etiology of vascular ectasia. Neuroendocrine
cells containing vasoactive intestinal peptide and 5-hydroxtryptamine have
been found close to the vessels in the lamina propria of resected specimens
from GAVE patients .So, these mediators may be responsible for the
vasodilatation and thus the propensity to bleed .GAVE in cirrhotic patients
may be explained by the shunting of blood and altered metabolism of
vasoactive substances in the presence of liver disease GAVE have several
disease association as primary biliary cirrhosis , connective tissue disease
etc. More than 70% of patients with GAVE syndrome do not have
cirrhosis or portal hypertension .
In the setting of cirrhosis, GAVE syndrome can be difficult to
differentiate from PHG. Both conditions are diagnosed endoscopically as
collections of discrete red spots of ectatic vessels arranged in stripes along
the antral rugal folds; however, the red spots of PHG appear in a
GAVE is normal . Histologically , vascular ectasia in GAVE are seen in
the mucosa associated with fibrin thrombi ,fibrohylinosis and spindle cell
proliferation.
PORTAL HYPERTENSIVE INTESTINAL VASCULOPATHY
Portal hypertensive colopathy was defined endoscopically in patients
with vascular ectasia, redness and blue vein .Vascular ectasia was further
classified into two types: type 1, solitary vascular ectasia ; and type 2,
diffuse vascular ectasia. As Child-Pugh class worsens and platelet count
decreases, the prevalence of portal hypertensive colopathy increases in
patients with liver cirrhosis. Colonoscopic examination is needed in these
patients, especially those with worsening Child-Pugh class and decreasing
platelet count, to prevent complications, such as lower gastrointestinal
bleeding.
PORTAL HYPERTENSIVE ENTEROPATHY (PHE)
PHE is part of the spectrum of congestive gastroenteropathy .Its
incidence doesn't correlate with the Child-Pugh score or with prior
sclerotherapy. Circulating hormonal vasodilators from intestinal origin
such as glucagon and nitric oxide elevate portal venous pressure
The important histologic features in the portal hypertensive patients
include edema of the lamina propria, fibromuscular proliferation, a
decreased villous/crypt ratio, and thickened muscularis mucosae.
The clinical implication of these changes is the increased chance of occult gastrointestinal blood loss. PHE is usually asymptomatic; massive hemorrhage has only rarely been described. The spectrum of portal
hypertensive enteropathy varies from protein loosing enteropathy,altered
intestinal motility, bacterial overgrowth and malabsorption and intestinal
lymphagiectasia.
CLINICAL FEATURES OF PORTAL HYPERTENSION
SYMPTOMS
Hematemesis or melena (gastroesophageal variceal bleeding or
bleeding from portal gastropathy) Mental status changes such as lethargy,
increased irritability, and altered sleep patterns (presence of portosystemic
encephalopathy)
Increasing abdominal girth (ascites formation)
Abdominal pain and fever (spontaneous bacterial peritonitis [SBP], which also presents without symptoms)
Physical examination
The signs of portosystemic collateral formation include the following:
Dilated veins in the anterior abdominal wall (umbilical epigastric vein shunts)
Venous pattern on the flanks (portal-parietal peritoneal shunting)
Caput medusa (tortuous collaterals around the umbilicus)
RECTAL HEMORRHOIDS
Ascites - Shifting dullness and fluid wave (if significant amount of ascitic fluid is present)
Paraumbilical hernia Venous hum
Signs of liver disease include the following: Ascites
Jaundice
Spider angiomas Gynecomastia
Dupuytren contracture Muscle wasting
Palmar erythema Asterixis
Hepatomegaly
Signs of hyperdynamic circulatory state include the following: Bounding pulses
Warm, well-perfused extremities Arterial hypotension
INVESTIGATION OF PORTAL HYPERTENSION
BLOOD INVESTIGATIONS
Liver function tests – to assess severity of the liver disease; reversal of albumin : globulin ratio indicates decompensation.
Prothrombin time - assess coagulation abnormality
Viral hepatitis serologies
Platelet count - value of < 150000/mm3 indicates thrombocytopenia.
Antinuclear antibody, antimitochondrial antibody, antismooth muscle antibody
Iron indices
Alpha1-antitrypsin deficiency
IMAGING STUDIES
ULTRASONOGRAPHY
Ultrasound examination of the liver with Doppler study of the
vessels has been used widely to assess patients with portal hypertension.
Features suggestive of portal hypertension on ultrasonography include
splenomegaly, portosystemic collateral vessels, reversal of the direction of
flow in the portal vein (hepatofugal flow) , portal vein diameter greater
than 11 mm and the absence of respiratory variations in the splenic and
mesenteric veins.
Ultrasound examination can detect thrombosis of the portal vein,
which appears as nonvisualization or cavernous transformation of the
portal vein; the latter finding indicates an extensive collateral network in
place of the portal vein. Splenic vein thrombosis also can be demonstrated.
PORTAL VEIN DOPPLER
Portal blood flow can be measured by Doppler ultrasonography,
which is the easiest research method for detecting postprandial increases
in splanchnic blood flow. Although Doppler ultrasonography is clinically
useful in the initial evaluation of portal hypertension, the technique is not
hypertension. Pulsed Doppler Ultrasound was used to analyze hepatic
artery wave forms near the porta hepatis.
The Resistive Index (RI) = [pcak systolic frequency shift (A) –
minimum diastolic frequency shift (B)] / [peak systolic frequency shift (A)]
has been calculated from this information. Using a cut off of greater than
0.77 this index has a sensitivity, specificity and overall accuracy of 68%,
70% and 69% respectively. portal blood flow velocity was found to
correlate only with the presence and size of esophageal varices. The
Congestion Index of the portal vein (derived from the ratio between the
cross-sectional area of the portal vein and the mean velocity of portal
flow) was significantly different in most clinical, biochemical and
endoscopic subgroups and was correlated with liver function, presence and
size of varices, and presence and degree of red signs.conjetion index of
>0.1 are associated with portal hypertension with sensitivity and
specificity of about 95%.
BARIUM STUDIES
Oesophageal varices appears as filling defects with a smooth contour
in the lower third of the esophagus. Uphill and downhill varices can be
gastropathyhad thickened gastric folds, which had a mean thickness of
10mm. The thickened folds had a nodular appearance withundulating
contours and indistinct borders which is somewhat different fromthose of
gastric varices, which classically appear as multiplerounded submucosal
nodules or as serpentine folds in the gastricfundus.
COMPUTED TOMOGRAPHY
Computed tomography (CT) is useful for demonstrating many
features of portal hypertension, including abnormal configuration of the
liver, ascites, splenomegaly, and collateral vessels .Detection of varices
may be an emerging indication for CT. Diagnosis of fundal varices by
multidetector row CT (MDCT) is at least as accurate as endoscopic
ultrasonography. CT is especially helpful in distinguishing submucosal
from perigastric fundal varices and is considered a less invasive alternative
to conventional angiographic portography in assessing portosystemic
collaterals. At present, however, CT is not a recommended screening
method for detecting large esophageal varices, but it may be a
cost-effective method of screening for varices and preferred to endoscopy by
MAGNETIC RESONANCE IMAGING
Gadolinium-enhanced magnetic resonance imaging can be used to
measure and azygous blood flow, which is increased in patients with portal
hypertension. MRI provides excellent detail of the vascular structures of
the liver and can detect portal venous thrombosis and spleen stiffness in
patients with portal hypertension, but the role of MRI in the assessment of
portal hypertension requires further study. MRI can accurately assess the
stiffness of even fatty livers.
ENDOSCOPIC ULTRASONOGRAPHY
Endoscopic ultrasound examination using radial or linear array ech
endoscopes or endoscopic ultrasound mini-probes passed through the
working channel of a diagnostic endoscope has been applied as an
investigational tool in the evaluation of patients with varices. Cross-
sectional area of varices to identify patients at increased risk of bleeding,
size of and flow in the left gastric vein, azygous vein, and paraesophageal
collaterals; changes after endoscopic therapy; and recurrence of esophageal
varices following variceal ligation all can be assessed by
endosonography. Endosonography can be combined with endoscopic
measurement of transmural variceal pressure to allow estimation of
TRANSIENT ELASTOGRAPHY (FibroScan)
FibroScan (Transient Elastography) is a new device used to measure
the elasticity or stiffness of the liver – the stiffer the liver, the more severe
the hepatic fibrosis (scarring). It’s extremely good at picking up mild or
minimal disease, and very good at diagnosing cirrhosis, with 90-95%
accurate positive predictive value, FibroScan also has other limitations
that people wanting to undergo a FibroScan should be aware of; its
inability to get an effective reading in patients with significant liver
inflammation for those who have a pacemaker, or its inability to diagnose
moderate fibrosis accurately, and its ineffectiveness in patients who are
obese should all be noted.
ESOPHAGO GASTRO DUODENOSCOPY
Upper gastrointestinal endoscopy is the most commonly used
method to detect varices. Endoscopic grading of esophageal varices is
subjective. Various criteria have been used to try to standardize the
reporting of esophageal varices. The best known of these criteria are those
compiled by the Japanese Research Society for Portal Hypertension. The
descriptors include red color signs, color of the varix, form (size) of the
markings, which are longitudinal whip-like marks on the varix; cherry-red
spots, which usually are 2 to 3 mm or less in diameter; hematocystic spots,
which are blood-filled blisters 4 mm or greater in diameter; and diffuse
redness. The color of the varix can be white or blue. The form of the varix
at endoscopy is described most commonly.
Esophageal varices may be small and straight (grade I); tortuous and occupying less than one third of the esophageal lumen (grade II); or large
and occupying more than one third of the esophageal lumen (grade III).
Varices can be in the lower third, middle third, or upper third of the
esophagus. Of all of the aforementioned descriptors, the size of the varices
in the lower third of the esophagus is the most important. The size of the
varices in the lower third of the esophagus is determined during
withdrawal of the endoscope . Small varices, that is, those occupying less
than one third of the lumen, are less than 5 mm in diameter, whereas large
varices are greater than 5 mm in diameter.
Patients with large esophageal varices, Child (or Child-Pugh) class C
cirrhosis (see later), and red color signs on varices have the highest risk of
variceal bleeding within 1 year. Prophylactic treatment to prevent variceal
bleeding is recommended in all patients with large esophageal varices
ARTERIOGRAPHY
Injection of contrast medium into the speen either percutaneously or
by laparoscopy ensures access to collaterals if radiological interventions
are planned. Indirect splenoportography , hepatic vein phlebography,
indirect mesentricoportography , transjugular and transhepatic
splenoportography, umbilical vein portography are the some of the
radiologic methods by which the collaterals can be ascertained.
MEASUREMENT OF PORTAL PRESSURE
Portal pressure can me measured either by direct or by indirect
methods. Direct methods are invasive , cumbersome and rarely used.
HVPG measurement , splenic pulp pressure measurement, variceal
pressure , are the indirect methods. HVPG measurement is currently used
to assess portal pressure.
The HVPG is the difference between the wedged hepatic venous
pressure (WHVP) and free hepatic vein pressure (FHVP). It has been
validated as the best predictor for the development of complications of
Measurement of the HVPG requires passage of a catheter into the
hepatic vein under radiologic guidance until the catheter can be passed no
further, that is, until the catheter has been “wedged” in the hepatic vein.
The catheter can be passed into the hepatic vein through the femoral vein
or using a transjugular venous approach. HVPG is not effective for
detecting presinusoidal causes of portal hypertension. HVPG is accurate
for detecting only sinusoidal and postsinusoidal causes of portal
hypertension.
The HVPG is measured at least three times to demonstrate that the
values are reproducible. Measurement of the HVPG has been proposed for
the following indications: (1) to monitor portal pressure in patients taking
drugs used to prevent variceal bleeding; (2) as a prognostic marker (3) as
an end- point in trials using pharmacologic agents for the treatment of
portal hypertension; (4) to assess the risk of hepatic resection in patients
with cirrhosis; and (5) to delineate the cause of portal hypertension .
HVPG monitoring is not done routinely in clinical practice because no
controlled trials have yet demonstrated its usefulness.
The development of gastroesophageal varices requires a portal
pressure gradient of at least 10 mm Hg. Furthermore, a portal pressure
bleed; other local factors that increase variceal wall tension also are
needed(77)
because all patients with a portal pressure gradient of greater
than 12 mm Hg do not necessarily bleed.
Factors that influence variceal wall tension can be viewed
in the context of the law of Laplace: T= PR / W
where T is variceal wall tension, P is the transmural pressure
gradient between the variceal lumen and esophageal lumen, r is the
variceal radius, and w is the variceal wall thickness. When the variceal
wall thins and the varix increases in diameter and pressure, the tolerated
wall tension is exceeded and the varix will rupture. These physiologic
observations are manifested clinically by the observation that patients with
larger varices (r) in sites of limited soft tissue support (w), with elevated
portal pressure (P), tend to be at greatest risk for variceal rupture from
variceal wall tension (T) that becomes excessive. One notable site in
which soft tissue support is limited is at the gastroesophageal junction.
The lack of tissue support and high vessel density may contribute to the
greater frequency of bleeding from varices at the gastroesophageal
The law of Laplace also has implications for the relevance of
pharmacologic therapies aimed at reducing portal pressure. Reductions in
portal pressure will reduce the variceal transmural pressure gradient,
thereby reducing the risk that variceal wall tension will become excessive
and varices will rupture. Clinically, a reduction in the hepatic venous
pressure gradient to less than 12 mm Hg almost negates the risk of variceal
hemorrhage. The changes in portal pressure and local variceal factors,
however, are dynamic and influenced by a number of physiologic (an
increase in intra-abdominal pressure, meal-induced increases in portal
pressure), diurnal (circadian changes in portal pressure), and
pathophysiologic (acute alcohol use) factors, and portal pressure and
esophageal variceal pressure may vary at different times.
AIM AND OBJECTIVES OF THE STUDY
1. To investigate the diagnostic utility of venous ammonia levels,
spleen size and platelet count as non-invasive markers of esophageal
varices.
2. To correlate these markers with endoscopy findings, ultra sound
features and Child- Pugh classification as indices of shunt presence.
3. To evaluate non – invasive markers in predicting large esophageal
varices.
4. To evaluate non – invasive markers in predicting Gastric varices
METHODS
The study included consecutive patients with liver cirrhosis
admitted in our institution (Department of Digestive Health and Diseases ,
Government Peripheral Hospital , Anna nagar , Chennai -102 ) which is a
major tertiary care centre for liver diseases . Ethical Committee approval
was obtained for this study design. Patients were included in this study
after their willingness to undergo necessary investigations . Informed
written consent was taken before the enrolment in this study.The period of
study is from December 2008 to January 2011.
Inclusion criteria :
1.Cirrhosis with portal hypertension
EXCLUSION CRITERIA :
1. Previous history of EST / EVL / Porto systemic shunt surgery
2. Patients on drugs as a primary prophylaxis for varices
3. Past history of variceal bleeding
4. Hepato cellular carcinoma , detected by ultrasound
5. Severe co-morbid illness precluding upper GI scopy
6. History of drug usage which increases blood ammonia level
8. Acute or chronic renal failure
CLINICAL EVALUATION:
In all the patients, the diagnosis of cirrhosis with portal
hypertension was established by detailed clinical (spider nevi,
organomegaly) etiological (significant alcohol intake , blood transfusion,
tattooing, high risk behaviour etc.) , radiological (portal vein, spleen size)
Ascites was graded as none, mild (detectable only on ultrasound),
moderate (visible moderate symmetrical abdominal distension) or severe
(marked abdominal distension)38 . Hepatic encephalopathy was graded
from grade 0 to IV, as per west Heaven criteria.
BLOOD INVESTIGATIONS :
Includes haemoglobin , WBC count , platelet count , prothrombin
time , bilirubin (total , direct, indirect ), total protein albumin and globulin ,
alanine amino transferase , aspartate amino transferase, HBsAg and
Anti HCV. Tests for auto immune liver disease, haemochromatosis and
ULTRASOUND ABDOMEN :
The non-invasive assessment of liver cirrhosis was performed to all
patients by radiologists on the basis of US/US-doppler examinations
(coarse echo-texture, nodularity presence, increased caudate/right lobe
ratio, hypertrophy of the left lobe, characterized by a rounded inferior
marginal edge, )
Spleen measurements of Spleen Longitudinal Diameter (SLD) were
performed by postero-lateral scanning with the probe footprint aligned
along an intercostals space to provide a longitudinal view of the spleen.
The patients were asked to breathe slowly, taking long breaths – as varying
degrees of inspiration and expiration are needed to optimize splenic
visualization – and to roll on the right side to some extent to aid
visualization. At this point, the maximum length, i.e., the optically greatest
overall longitudinal dimension obtained from one of the two poles was
recorded. Given the high variability in detecting spleen measurements, an
US value ≥ 110 mm was chosen to correspond to splenomegaly.
ASCITES PRESENCE
When a patient is in a supine position, free fluid tends to accumulate
in the pelvis due to the effects of gravity. These areas were carefully
assessed. Small quantities were sought for around the liver or spleen
surface and in the Morrison's pouch. 26
PORTAL VEIN DOPPLER
Umbilical vein patency, i.e. diameter ≥ 3 mm, was easily detected
within the echogenic ligamentum teres hepatis and was confirmed by color
Doppler US. SRS was detected by the same method. The direction of blood
flow in the collateral vein was also analyzed in each patient. The Doppler
angle used to examine the portal vein was less than 50° in all examinations.
Portal vein enlargement with decreased flow velocity, absence of a
normal doppler waveform, hepatofugal flow). No evidence of
hepatocellular carcinoma at the first hepatic decompensation was detected.
Renal insufficiency was properly excluded.
ENDOSCOPIC FEATURES
ESOPHAGEAL VARICES
Esophageal varices were graded according to paquet grading system.
small varices (paquet’s grade I,II ), large varices ( paquet’s
grade III , IV).40
PORTAL HYPERTENSIVE GASTROPATHY
PHG was assessed according to the NIEC classification .41
Mosaic-like pattern was characterized by the presence of small, polygonal areas
surrounded by a whitish-yellow depressed border. Red-point lesions were
small, flat, lesions (1 mm in diameter). Cherry-red spots were
red-coloured, round lesions, slightly protruding into the lumen of the stomach,
(2 mm in diameter). Black- brown spots were irregularly shaped flat spots,
black or brown, persistently present after washing.
Ano-rectal varices and Portal Hypertensive Colopathy
For ethical reasons, only patients who presented with a history of
hematochezia at entry underwent colonoscopy to track ano-rectal varices
to differentiate from haemorroides.Portal hypertensive colopathy was
defined endoscopically in patients withvascular ectasia (solitary or
Hepatic encephalopathy grade
Hepatic encephalopathy was graded based on the level of consciousness, intellectual functions, behaviour and neuromuscular functions according to West Haven (W-H) criteria .W-H grade 0 encephalopathy was ascertained as previously described. 42,43.
Venous ammonia concentration
Venous ammonia levels were quantified according to enzymatic
determination with glutamate dehydrogenase using rapid and
interference-free photometry (340 nm), and were expressed as µ mol / L.Due to reasons
of safety, blood was kept chilled and immediately sent to the laboratory
STATISTICAL ANALYSIS
The chi square was used to look for significance of each variables in
predicting esophageal , gastric and other large porto systemic collaterals.
When confronted with the question of how accurate a parameter was in
identifying portosystemic collateral veins presence, the discrimination
with relative cut-off or criterion was evaluated using .Sensitivity (true
positive rate), specificity (true negative rate) were also weighted for the
same purpose. Optimal cut-off was considered the threshold value with the
best specificity/sensitivity.
To predict the presence of portosystemic collateral veins, hepatic
decompesation and ascites presence the logistic regression (Enter Method)
was employed utilizing as independent variables US values for SLD,
platelets count and blood NH4 concentrations. The same tool was carried
out to predict the large (II and III grade) EV presence by NH4
RESULTS
Patient characteristics
A total of 61 patients were included in the study. Of those,
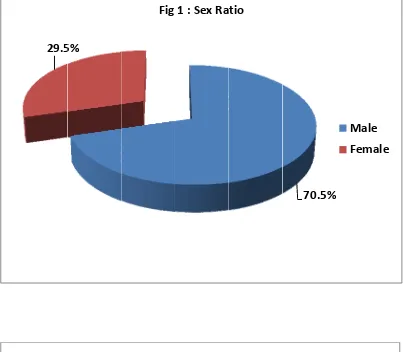
43(70.5%) were male and 18 were female (29.5%). The symptom patient
duration in half of the patients falls between 90 – 180 days . Ascites was
clinically present in 77% of patients. Pedal edema was present in 44% of
patients. About 37 patients had jaundice at presentation. Spleen was
palpable in 44 % of patients.
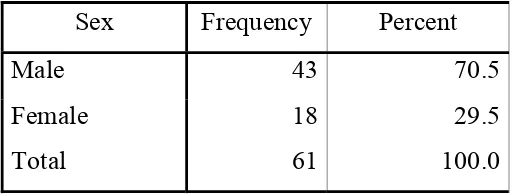
[image:42.612.191.448.487.584.2]The demographic and clinical characteristics of the patients are presented in Table 1.
TABLE 1 : DEMOGRAPHIC CHARECTERISTICS OF STUDY
PATIENTS
Sex Frequency Percent
Male 43 70.5
TABLE 2 : FREQUENCY OF ASCITES IN STUDY POPULATION
ASCITES Frequency Percent Absent 14 23.0 Present 47 77.0
Total 61 100.0
TABLE 3 : PALPABLE SPLEEN
Spleen Frequency Percent
0 34 55.7
1 27 44.3
Total 61 100.0
0 – present ; 1- absent
The majority of the patients were Child-Pugh class C , 29 (47.5%).
Patients with child A and B constitutes 14 (23%) & 18 (29.5%)
respectively. Ascites was found in 77 % of the patients by ultrasonography
[image:43.612.173.468.284.393.2]TABLE 4 : CHILD PUGH CLASS IN STUDY POPULATION
CTP SCORE Frequency Percent
A 14 23.0
B 18 29.5
C 29 47.5
Total 61 100.0
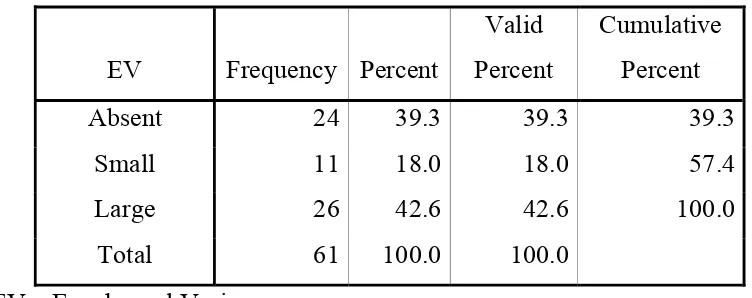
Esophageal varices were present in 37 patients of which 11 had
small varices (18%) and 26 (42.6%) had large varices . Gastric varices
was present only in 9 patients.
TABLE 5 : FREQUENCY OF ESOPHAGEAL VARICES IN STUDY
GROUP
EV Frequency Percent
Valid Percent
Cumulative Percent
Absent 24 39.3 39.3 39.3 Small 11 18.0 18.0 57.4 Large 26 42.6 42.6 100.0
[image:44.612.124.500.411.560.2]TABLE 6 : FREQUENCY OF GASTRIC VARICES
Gastric Varices Frequency Percent
Valid Percent
Cumulative Percent Absent 55 90.2 90.2 90.2 Present 6 9.8 9.8 100.0 Total 61 100.0 100.0
20 patients had (32.8%) portal hypertensive gastropathy along with
esophageal varices
TABLE 7 : FREQUENCY OF PORTAL HYPERTENSIVE
GASTROPATHY
PHG Frequency Percent
Valid Percent
Cumulative Percent Absent 41 67.2 67.2 67.2
Present 20 32.8 32.8 100.0 Total 61 100.0 100.0
Large spontaneous porto systemic shunts were detected by color dopper in
[image:45.612.125.507.378.507.2]TABLE 8 : FREQUENCY OF LARGE SPONTANEOUS SHUNTS
(LSS)
LSS Frequency Percent Absent 51 83.6 Present 10 16.3 Total 61 100.0
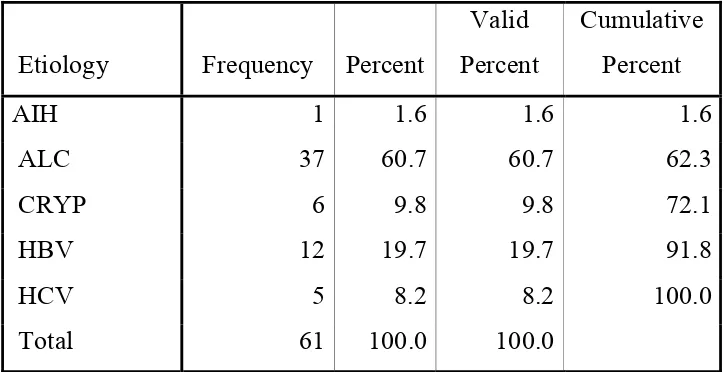
The majority of patients in this study were belong to alcoholic
cirrhosis which constitutes of about 60.7%. , which is followed by
Hepatitis B , 19.7%
TABLE 9: ETIOLGY OF CIRRHOSIS
Etiology Frequency Percent
Valid Percent
Cumulative Percent
AIH 1 1.6 1.6 1.6
ALC 37 60.7 60.7 62.3
CRYP 6 9.8 9.8 72.1
HBV 12 19.7 19.7 91.8
HCV 5 8.2 8.2 100.0
Total 61 100.0 100.0
Variables associated with the presence of oesophageal varices on
univariate analysis Eleven variables considered relevant to the presence of
oesophageal varices were tested using univariate analysis. Results are
[image:46.612.138.500.383.569.2]TABLE 10 : DESCRIPTIVE STATISTICS OF VARIABLES
ASSOCIATED WITH PRESENCE OF ESOPHAGEAL VARICES
Variables N Minimum Maximum Mean Std. Deviation (DD) DISEASE
DURATION 61 20 240 85.98 46.982
Platelets 61 70000 415000 168049.18 78614.974
Bilirubin 61 .8 11.2 2.495 1.6767
SAAG 61 .9 1.6 1.231 .1478
PLT/SLD RATIO 61 236.92 3365.38 1367.5889 739.54224 SPLEEN SIZE 61 9.0 26.0 13.264 3.3378 (PV ) PORTAL
VEIN DIAMETER 61 8 18 12.26 2.352
(SV) SPLENIC
VEIN DIAMETER 61 7 12 8.54 1.478
Coloumn 61 1 4 3.03 .983
Length 61 1 12 8.02 2.102
NH4 61 38 108 72.49 19.607
PLD/SLD – Platelet- Spleen ratio
Univariate analysis revealed that platelet count, spleen width, portal
diameter CTP grade were significantly associated with the presence of
VARIABLES PREDICTING PRESENCE OF ESOPHAGEAL
VARICES (EV)
Platelet count of 1,50,000 /mm3 was considered as
thrombocytopenia and it correlate well with the presence of esophageal
varices.
TABLE 11 : PLATELET COUNT PREDICTING EV
Platelets GRADE
Total small large
<1,50,000 7 20 27
> 1,50,000 17 17 34
Total 24 37 61
P values 0.05
A Platelet / spleen ratio of about 909 was chosen as a cut off value
TABLE 12 : PLATELET/ SPLEEN RATIO PREDICTS EV
PLD/SLD EV
Total small large
<<909 21 17 38
>909 3 20 23
Total 24 37 61
P value .001
Spleen size is another important predictor of esophageal varices.
Spleen size of more than 11cms was chosen as acut off value.
TABLE 13 : Spleen size as a predictor of EV
SPLEEN GRADE
Total small large
>11 cm 9 30 39
<11 cm 15 7 22
Total 24 37 61
[image:49.612.185.450.404.529.2]TABLE 14 : Portal vein size size correlating with EV presence
Portal vein
Grade Total
Absent Small Large < 11 mm 19 7 11 37 >11 mm 5 4 15 24 P- value 0.02
TABLE 15 : CTP grade correlates with the presence of varices.
EV
CTP Total
A B C
Absent Count 9 6 9 24 Small Count 2 7 2 11 Large Count 3 5 18 26
P value 0.006
[image:50.612.138.499.331.457.2]TABLE 16 : VENOUS AMMONIA LEVEL
NH3 EV TOTAL
present Absent
>35mmol 33 17 50
<35 mmol 4 7 11
Total 24 37 61
P value < 0.05
Data showing Association of non Invasive markers with collaterals other then EV
Variable GV (P value)
(LSS) P value
PHG (P value)
NH4 0.7 0.4 0.1
Spleen size 0.2 0.2 0.1 Platelet count 0.04 0.02 0.02
The above data shows only platelet count has got association with collaterals other then EV
DISCUSSION
With the growing number of chronic liver disease in the world , the
likelyhood of patients undergoing variceal screeing by endoscopy will
also increase. Non invasive screening for identifying patients with high
risk varices will definetly of help by means of reducing the cost and
improve patient’s tolerability Studies conducted on non invasive predictor
of varices (Table -17) lack uniformity in their structure . The conclusion
from most of these studies is that by selecting patients for endoscopic
screening based on a few laboratory and/or ultrasonographic variables
(usually the platelet count and the diameter of the portal vein), an
appreciable number of endoscopies may be avoided, while keeping the rate
of undiagnosed varices, which are at risk of bleeding, acceptably low
.However, the predictive accuracy of such noninvasive markers is still
considered to be unsatisfactory, and none of them has been recommended
for use in clinical practice so far.45
Practice guidelines for the treatment of portal hypertension
recommended endoscopic screening of patients with cirrhosis for varices,
and treatment of patients with medium or large varices to prevent
procedure, even though up to 50% of them may still not have developed
esophageal varices 10 years after the diagnosis of cirrhosis.
Cirrhosis is the most advanced form of liver disease and variceal
hemorrhage is one of its lethal complications. Over half of the patients
with cirrhosis will develop varices. The risk of bleeding once OV formed
is 20% to 35% within 2 years.49
The reported mortality rate from first
episode of variceal bleeding is 17% to 57%. Of those who survive the
initial episode of bleeding and who do not receive active treatment, the
risk of recurrent bleeding is approximately 66% and usually occurs within
6 months of the initial bleeding episode.(50)
Because cirrhotic patients with large esophageal varices are at a high
risk for bleeding, preventive efforts have concentrated on identifying
cirrhotic patients with large varices. 51
In 1997, The American Collage
of Gastroenterology (ACG) recommended screening endoscopy for cases
with established cirrhosis who were candidates for medical therapy 52
.
AASLD recommended screening endoscopy for varices and to be in
particular routine in child class B and C patients, but in child class A to be
limited to patients with evidence of portal hypertension53
It was estimated that 100 screening endoscopy need to be preformed
to prevent 1-2 cases of variceal bleeding .Therefore, identification of
identifying patients at greatest risk is important to improve the yield and
cost- effectiveness of endoscopic screening.
Bleeding occurs in significant proportion of patients with severe
PHG which accounts for most non variceal bleeding episodes in patients
with cirrhosis and portal hypertension. PHG bleeding is a serious
complication, which is usually chronic and insidious but occasionally
massive and life – threatening54 .Overt hemorrhage from the gastric
mucosa occurred in 60% of patients with severe PHG with a cumulative
risk of bleeding of 75% over a 5 –year follow –up period 55
In the present study, the parameters linked to portal hypertension (platelet count, portal vein diameter, splenic diameter and platelet count/spleen ratio), were associated with the presence of esophageal varices. The issue of identifying patients with EV at risk of bleeding by non invasive means is relevant and has been addressed in several recent studies 67,
but only few Indian studies compared the above parameters as a
prediction of gastric varices and other large porto systemic collaterals.
This study is an attempt to achieve this goal
Commenting on the results, our data in cirrhotic patients support a
good association between blood NH4 levels and EV presence. The blood
fact, the collection, handling, storage, and analysis of blood samples are all potential sources of error. Recommendations has to be made on the
collection and processing of blood samples, for it is bystandardization and
rigid adherence to these techniques that the reliability of the test results
will be improved.
Our data in this study agree with the body of present knowledge.
When comparing the performance of blood ammonia with the PLTs/SLD
ratio (56) the only marker contextually studied, we found a not so much
dissimilar reliability. The advantages of the PLTs/SLD ratio are evident
because they do not suffer from external confounding factors. The
disadvantages are consistent with the fact that thrombocytemia is sometime
related to the auto-antibodies presence that turns out in falsely low count of
PLTs. Indeed, the opposite, falsely high count of PLTs, could be detected
in patients suffering from liver cirrhosis with hepatocarcinoma.
The key point is not whether to recommend endoscopy or not but
when to undergo it. Decision about the optimal intervals for surveillance
mainly to detect large varices depends on what proportion of patients that
bleeds before starting prophylactic treatment we are willing to accept.
In determining portal hypertension,mechanisms potentially
reversible are involved, i.e., contractility of sinusoidallining cells, systemic
mediators of arteriolar resistance, production ofendothelins or nitric oxide,
and swelling of hepatocytes 57 However, other irreversible factors such as
tissue fibrosis and regeneration increase resistance in the sinusoids and
terminal portal venules, playing a key role. Even though PHG is
recognized as a clinical entity associated to portal hypertension, its
significance has not yet been elucidated 30
Our observation that blood NH4 levels predicted both ascites and
collaterals presence is intriguing, reinforcing the concept of a common
origin. Data from long follow-up of patients suffering from compensated
cirrhosis B show that poor hepatic reserve and severity of portal
hypertension significantly correlate 59 At the same manner, measurements
of portal pressure provide unique prognostic information for predicting
portal hypertensive-related bleeding and mortality in patients with
alcoholic cirrhosis 60
also in patients without clear presence of EV (31)
High values of blood NH4 are important because they point out an
incoming liver decompesation; in fact, less blood reaches the liver,
pathophysiological route to decompress the hypertensive portal system.
Despite this, the vascular resistance of the collateral bed is still greater than
the resistance of the liver, and portal pressure does not decrease 62 .What is
more, ammonium compounds increase vascular tone by causing influx of
extracellular calcium through the voltage-dependent calcium channel and
intracellular alkalinisation 63
While determining indirect evidence of portosystemic shunts
presence, some laboratory parameters have already been proposed, i.e.,
Serum Bile Acids (SBA) and Indocyanine Green Clearance (IGC). Both
are reliable, butblood ammonia level is a higher sensitive and specific
parameter 64
Colonoscopy was not offered to any patient as none of the patients
have symptoms of portal hypertensive colopathy. Although detection of
other portosystemic collaterals besides EV improves the specificity of
NH4, it is barely important in clinical practice as prophylactic remedies are
not warranted.
Platelet count
Thrombocytopenia in patients with cirrhosis has historically been
suggest that platelet count may predict the presence of EV in patients with
cirrhosis . However, the discriminating threshold for the presence of
varices varies widely, ranging between 68,000 and 160,000/mm3 65 . The
sensitivities for thrombocytopenia fluctuate from 62% to 100%, and the
specificities range from 18% to 77% 66 .Our data suggest that the
multivariate analysis failed to show any significant difference between
thrombocytopenia and the risk of EV. In addition, platelet count might not
be an ideal predictor of the presence of EV in HBV-related cirrhosis. A
possible explanation is that other factors, such as suppressive effects of
viruses on bone marrow and antibody-mediated destruction of platelets,
may play a more important role in HBV-related cirrhosis than that in
alcohol cirrhosis, in addition to decreased thrombopoeitin
and interleukin-11 67 .
STUDIES ON PLATELET COUNT
According to Zaman et al , Platelet count <88,000 was the only
parameter identified by univariate/multivariate analysis (p < 0.05) as
associated with the presence of large esophageal varices68
Thomopoulous et al in his study , Seventeen variables considered
were present in 92 patients (50%), and large varices in 33 patients
(17.9%).69
Factors independently associated with the presence of large
oesophageal varices on multivariate analysis were platelet count, size of
spleen and presence of ascites by ultrasound.
In Chalasani et at70 , a study on three hundred and fourty patients ,
the prevalence of large esophageal varices was 20%. On multivariate
analysis, splenomegaly ,detected by computed tomographic scan (odds
ratio: 4.3; 95% confidence interval: 1.6-11.5) or by physical examination
(odds ratio: 2.0; 95% confidence interval: 1.1-3.8), and low platelet count
were independent predictors of large esophageal varices. On the basis of
these variables, cirrhotics were stratified into high- and low-risk groups for
the presence of large esophageal varices. Patients with a platelet count of
> 88,000/mm3 (median value) and no splenomegaly by physical
examination had a risk of large esophageal varices of 7.2%. Those with
splenomegaly or platelet count < 88,000/mm3 had a risk of large
SPLENOMEGALY
Splenomegaly is recognized as one of the diagnostic signs of
cirrhosis and portal hypertension. Our data showed that spleen width
measured by ultrasonography was an independent predictor for the
presence of varices.
Dib N, et al71 identified non invasive diagnosis of large esophageal
varices because of prognostic and economic issues. Indirect echographic
markers of portal hypertension and esophageal varices (ascites, portal vein
diameter > or = 13 mm, spleen length, maximal and mean velocimetry of
portal vein flow, respectively < 20 cm/s and < 12 cm/s) could be useful.
Among this parameters, spleen length is an independent predictive marker
of esophageal varices
In Sharma et al 72 study, 101 patients (median age 45; range 15-74
years; 87 male; Child-Pugh class: A 18, B 31, C 52), 46 had LEVx. On
univariate analysis, five variables were significantly associated with the
presence of LEVx.
These included pallor (P = 0.026), palpable spleen (P = 0.009),
platelet count (P < 0.002), total leukocyte count (P < 0.0004) and liver
parameters, namely low platelet count and presence of palpable spleen,
were found to be independent predictors of the presence of LEVx.
In Jeon sw et al study 73 variables associated with the presence of
esophageal varices on univariate analysis were serum albumin, total
bilirubin, prothrombin time and platelet count ( P < 0.05). On multivariate
analysis, independent variables were platelet count (odds ratio (OR) 0.922;
95% confidence interval (CI), 0.86-0.99), diameter of spleen (OR 5.4;
95% CI, 1.63-17.88) and platelet count/spleen diameter ratio (OR 1.007;
95% CI, 1.01-1.02). The optimal critical value for the diameter of spleen
was 11 cm. The sensitivity and specificity with this value were 84% and
63%, respectively
Platelet count/ spleen ratio
With the best cut-off value of 909 , the platelet count/spleen width
ratio yielded a low diagnostic accuracy of 60.3%, which suggests that it is
In a study conducted by Schwarzenberger et al 74 of the 137
patients with 87 (63.5%) men and a mean age of 56 years, seventy-six
(55%) patients had esophageal varices.Using a platelet count/spleen
diameter ratio with a cut-off value of 909, yielded a negative predictive
value of only 73% and a positive predictive value of 74%.
Giannini E et al 75 conducted a study in 121 patients,
ultrasonographic measurement of spleen bipolar diameter. Platelet
count/spleen diameter ratio were calculated for all patients. The prevalence
rates of OV were 61% and 58% in the first and second groups of patients,
respectively.the platelet count/spleen diameter ratio was the only parameter
which was independently associated with the presence of OV in a
multivariate analysis. A platelet count/spleen diameter ratio cut off value
of 909 had 100% negative predictive value for a diagnosis of OV. This
result was reproduced in the second group of patients as well as in patients
with compensated disease. In a cost-benefit analysis, screening cirrhotic
patients according to the "platelet count/spleen diameter ratio strategy"
In Baig WW et al 76 study, the platelet count to spleen diameter
ratio had the highest accuracy among the three parameters. By applying
receiver operating characteristic curves, a platelet count to spleen diameter
ratio cut-off value of 1014 was obtained, which gave positive and negative
predictive values of 95.4% and 95.1%, respectively.
In Zaman et al study77 , A total of 218 cirrhotic patients underwent
screening endoscopy for EV. Platelet count/spleen diameter ratio was
assessed in all patients and its diagnostic accuracy was calculated.
Prevalence of EV was 54.1%. The platelet count/spleen diameter ratio had
86.0% (95% CI, 80.7- 90.4%) diagnostic accuracy for EV, which was
significantly greater as compared with either accuracy of platelet count
alone (83.6%, 95% CI 78.0- 88.3%, P= 0.038) or spleen diameter alone
(80.2%, 95% CI 74.3-85.3%, P= 0.018). The 909 cutoff had 91.5%
sensitivity (95% CI 85.0-95.9%), 67.0% specificity (95% CI 56.9-76.1%),
76.6% positive predictive value, 87.0% negative predictive value, 2.77
positive likelihood ratio, and 0.13 negative likelihood ratio for the
diagnosis of EV. Accuracy of the platelet count/spleen diameter ratio was
Studies on other non invasive markers
According to Bressler B et al 78 , a total of 235 patients with chronic
liver disease, including 79 patients with PBC,7 patients with PSC , 104
patients with chronic viral hepatitis, and 45 with non-alcoholic cirrhosis of
differing aetiologies, oesophageal varices were detected in 26 (30%) of the
PBC/PSC group, 38 (37%) of the viral hepatitis group, and 21 (47%) of the
"other" group. Applying multiple logistic regression analysis to the data in
the group with PBC/PSC, platelets <200,000/mm3 (odds ratio (OR) 5.85
(95% confidence interval (CI) 1.79-19.23)), albumin <40 g/l (OR 6.02
(95% CI 1.78-20.41)), and serum bilirubin >20 micromol/l (OR 3.66 (95%
CI 1.07-12.47)) were shown to be independent risk factors for oesophageal
varices. The study conclude patients with a platelet count <200,000/mm3,
an albumin level <40 g/l, and a bilirubin level >20 micromol/l should be
screened for oesophageal varices.
Ng fh79 on prediction of esophageal varices conclude that
Endoscopic screening for EGV was not necessary until
thrombocytopenia or ascites occurred. In their study, ninety-two
patients were recruited. From all patients studied, the size of palpable
spleen, liver chemistry value, platelet count, prothrombin time, diameter of
ascites were the significant independent predictors for high-grade EGV
(concordance rate 0.83). The optimal critical value for the platelet count
was 150 x 10(9)/L. Of patients without thrombocytopenia and ascites, 37%
had low-grade EGV but none had high-grade EGV, whereas 38 and 35%
of patients with thrombocytopenia or ascites had low and high-grade EGV,
respectively. Therefore, this predictive model for high-grade varices had a
positive and negative predictive value of 35 and 100%, respectively.
In Madhotra et al study80 , independent predictors of large varices
were thrombocytopenia ( p = 0.02) and splenomegaly ( p = 0.04) seen
using imaging. A platelet count of less than 68,000/mm 3 had the highest
discriminative value for large EV with a sensitivity of 71% and a
specificity of 73%. Splenomegaly had sensitivity and specificity of 75%
and 58%, respectively None of the parameters , namely platelet count ,
spleen size , platelet /spleen size ratio and venous ammonia level correlate
with the presence of gastric varices. Similarly none of these parameters
CONCLUSION
1. Identifying high ammonia levels in cirrhotic patients is a good non invasive marker of esophageal varices
2. Among the non invasive markers studied, only platelet count predicts Gastric varices, portal hypertensive gastropathy and large spontaneous shunts.
3. Spleen size & portal vein size are sonographic markers of large esophageal varices
4. Simple platelet / spleen ratio is a useful predictor of large esophageal varices
5. Non invasive predictors are safe, acceptable, patient friendly method of identifying esophageal varices
Figure


Outline
Related documents
ABSTRACT : Aiming at the poor dynamic performance and low navigation precision of traditional fading Kalman filter in BDS dynamic positioning, an improved fading
Anti-inflammatory effects of the preparation were studied according to the below methods: S.Salamon– burn induced inflammation of the skin, caused by hot water (80 0 C) in white
The effect of delayed spawning caused by suturing female genital papilla on fertilization, hatching and embryo mortality rates as well as the occurrence of larval
The objective of this study was to develop Fourier transform infrared (FTIR) spectroscopy in combination with multivariate calibration of partial least square (PLS) and
Base induced degradation was performed by adding 1 ml of 0.1N sodium hydroxide NaOH to volumetric flask containing 1 ml of Boceprevir standard solution 10000 μg/ml.. The volume was
The pre- dicted key breaching parameters (i.e., final breach size, fail- ure time, and peak outflow rate) considering the variations in the soil erodibility along depth agree well
Our results show that the rats via IP injection at a dose of mercury from 0.25 mg / kg, causes a diminition in phagocytic activity after 48 hours of injection and
The present study was conducted to examine the growth and variability in area, production and yield of wheat crop in all provinces (i.e. Khyber Pakhtunkhwa,
