Responsiveness in Patients with BK Polyomavirus-Positive Prostate
Cancer or Benign Prostatic Hyperplasia
Giovanni Sais,aStephen Wyler,bTvrtko Hudolin,b* Irina Banzola,aChantal Mengus,bLukas Bubendorf,cPeter J. Wild,d Hans H. Hirsch,eTullio Sulser,aGiulio C. Spagnoli,band Maurizio Provenzanoa
Oncology Research Unit, Division of Urology and Division of Surgical Research, University of Zurich and University Hospital, Zurich, Switzerlanda; Institute of Surgical Research and Hospital Management and Department of Biomedicine, University Hospital, Basel, Switzerlandb; Department of Pathology, University Hospital, Basel, Switzerlandc; Department of Pathology, University Hospital, Zurich, Switzerlandd; and Transplantation Virology, Institute for Medical Microbiology, University of Basel, Basel, Switzerlande
The role of the polyomavirus BK (BKV) large tumor antigen (L-Tag) as a target of immune response in patients with prostate
cancer (PCa) has not been investigated thus far. In this study, we comparatively analyzed humoral and cellular L-Tag-specific
responsiveness in age-matched patients bearing PCa or benign prostatic hyperplasia, expressing or not expressing BKV
L-Tag-specific sequences in their tissue specimens, and in non-age-matched healthy individuals. Furthermore, results from patients
with PCa were correlated to 5-year follow-up clinical data focusing on evidence of biochemical recurrence (BR) after surgery
(prostate specific antigen level of
>
0.2 ng/ml). In peripheral blood mononuclear cells (PBMC) from patients with PCa with
evi-dence of BR and BKV L-Tag-positive tumors, stimulation with peptides derived from the BKV L-Tag but not those derived from
Epstein-Barr virus, influenza virus, or cytomegalovirus induced a peculiar cytokine gene expression profile, characterized by
high expression of interleukin-10 (IL-10) and transforming growth factor

1 and low expression of gamma interferon genes.
This pattern was confirmed by protein secretion data and correlated with high levels of anti-BKV L-Tag IgG. Furthermore, in
PBMC from these PCa-bearing patients, L-Tag-derived peptides significantly expanded an IL-10-secreting CD4
ⴙCD25
ⴙ(high)CD127
ⴚFoxP3
ⴙT cell population with an effector memory phenotype (CD103
ⴙ) capable of inhibiting proliferation of
autolo-gous anti-CD3/CD28-triggered CD4
ⴙCD25
ⴚT cells. Collectively, our findings indicate that potentially tolerogenic features of
L-Tag-specific immune response are significantly associated with tumor progression in patients with BKV
ⴙPCa.
P
rostate cancer (PCa) represents the first leading cause of
can-cer morbidity and the third of cancan-cer death in men in
devel-oped countries, with a worldwide incidence rate of 14% of total
newly diagnosed malignancies and a worldwide total cancer
mor-tality rate of 6% (
29
). A contemporary model of PCa induction
and progression should include the analysis of the contribution of
inflammation to the development of preneoplastic or neoplastic
lesions (
24
). Indeed, proliferative inflammatory atrophy (PIA) of
the prostate has recently gained importance as potential precursor
of prostatic intraepithelial neoplasia (PIN) and overt PCa (
14
,
15
).
This is due particularly to the prevalence of PIA in the peripheral
zone of the organ, where histological transition between PIA and
PIN usually occurs (
42
).
The low rate of mutations detected in tumor suppressor genes
pRB1 and p53 in primary PCa cells (
16
) has suggested a possible
role of inflammatory agents ubiquitous in the urinary tract with
unique oncogenic functions, that is, of sequestering wild-type
products of tumor suppressor genes. Polyomaviruses’ main
regu-latory proteins, large tumor antigens (L-Tag), interfere with
wt-p53 binding to cellular DNA during virus infection (
4
), thereby
impairing p53 control on cell growth activity and possibly leading
to oncogenic transformation in nonpermissive cells (
6
). As such,
the human urotheliotrophic polyomavirus BK (BKV) has been
suggested to prominently associate with the development of
cancer (
26
,
27
) and, in particular, of urinary tract malignancies
(
3
,
12
,
54
).
There is a continuing debate on BKV expression in overt
can-cers (
1
,
5
). However, the possibility of “hit-and-run” carcinogenic
mechanisms induced by BKV cannot be excluded (
13
).
Geneti-cally rearranged BKV variants (
22
,
45
), presumably difficult to
detect by commonly used assays, might exist in the urinary tract
and be responsible for neoplastic transformation in prostate cells
(i.e., URO-1) (
37
). Therefore, BKV has been indicated as a
poten-tial cofactor in the earliest stages of PCa (
13
).
Detection and expression of BKV L-Tag sequences in
preneo-plastic prostate tissues (
12
) have prompted us to investigate the
role of this viral antigen as a target of immune response. Thus, we
have addressed here the humoral and cellular responsiveness to
BKV L-Tag in patients with benign prostatic hyperplasia (BPH) or
newly diagnosed PCa, and we have correlated the viral and
immu-nological features with PCa status.
MATERIALS AND METHODS
Patients and clinical follow-up.A total of 110 consecutive patients diag-nosed for either PCa (n⫽60; prostate specific antigen [PSA] level of⬎4
Received12 January 2012 Accepted8 May 2012
Published ahead of print30 May 2012
Address correspondence to Maurizio Provenzano, [email protected].
* Present address: Tvrtko Hudolin, Department of Urology, Zagreb University Hospital Center, Zagreb, Croatia.
G.S. and S.W. contributed equally to this article.
Copyright © 2012, American Society for Microbiology. All Rights Reserved.
doi:10.1128/JVI.00005-12
on November 7, 2019 by guest
http://jvi.asm.org/
ng/ml and suspicious digital rectal examination and/or positive for early-diagnosed high-grade prostate intraepithelial neoplasm at biopsy) or be-nign prostate hyperplasia (BPH;n⫽50; urinary obstructive symptoms and acute urinary retention according to the international prostate symp-tom score) were enrolled in the study at the Department of Urology of the University Hospital of Basel, Switzerland, and at the Division of Urology of the University Hospital of Zurich, Switzerland, after obtaining in-formed consent, following approval by Cantonal Ethical Committees of Basel and Zurich. Five-year follow-up after surgery was completed for 48/60 PCa patients (80%). Timing of biochemical recurrence (BR⫹), with early censoring if only one or two values were available, was established at the first detectionⱖ0.2 ng of PSA/ml. BR⫺patients were those showing clearly negative PSA values (⬍0.04 ng/ml) during complete follow-up. The data were collected according to the American Society for Therapeu-tic Radiation and Oncology (ASTRO) criteria (23), considering both ac-tuarial and ASTRO-time analytical methods, since ASTRO censoring al-lowed us to define biochemical failure as three consecutive increases in PSA values in 3/48 PCa patients only.
Virus detection in tissue specimens.Specimens from tissues excised during surgical procedures were formalin fixed and paraffin embedded. DNA was extracted from three sections (thickness, 5 m) randomly picked within the tumor area (PCa) or within the atrophic-hyperplastic gland (BPH) using a QIAamp DNA minikit (Qiagen, Basel, Switzerland) according to the manufacturer’s instructions. Molecular detection of polyomavirus BK was performed by quantitative reverse transcription-PCR (qRT-transcription-PCR) using a TaqMan assay targeting L-Tag. The assay, named T3a, consists of a primer-probe set that was designed to reliably measure BKV L-Tag subtypes Ia, Ic, III, IV, and VI (25). PCR amplification was set up according to standard real-time PCR protocols, using a Corbett Life Science Rotor-Gene 3000 instrument (Corbett Life Science, Sydney, Aus-tralia). Standard curves for the quantification of BKV L-Tag were gener-ated using serial 10-fold dilutions of plasmid pBKV35-1 DNA (LGC Stan-dards Sarl, Molsheim, France). To correct for the variable amounts of DNA in individual tissue specimens, amplification of control gene aspar-toacylase was performed in each sample, as previously described (43). Patients were considered BKV L-Tag negative upon consecutive negative testing on all three randomly picked punches.
EIA for patient and donor serology.BKV-specific antibody detection was performed by enzyme immunoassay (EIA) with a glutathione
S-transferase (GST)-BKV fusion protein. The optical density at 492 nm (OD492) was measured using an automated plate reader (Tecan Group,
Ltd., Männedorf, Switzerland). Affinity-purified GST was run as a nega-tive control, and corresponding OD values were subtracted from GST-BKV L-Tag domain 1 and GST-GST-BKV VP1 specific signals. The cutoff was defined as two standard deviations above the mean values of negative controls. Therefore, all OD values of⬍0.04 were considered negative (7,33).
Peptides and peptide pools.The BKV L-Tag peptide pool was pro-vided by JPT Peptide Technology (Berlin, Germany). This PepMix con-tains a total of 170 15mer peptides spanning the entire antigen (691 amino acids, Swiss-Prot P14999) and tiled at an 11-amino-acid pace. Similarly, the negative control PepMix HIVgag peptide pool (123 peptides including the B gag motif) was also provided by JPT. As a positive control, a PepMix CEF (cytomegalovirus, Epstein-Barr virus, and influenza virus) pool of 23 8-11mer peptides recognized by CD8⫹T cells and presented by 11 class I HLA-A and HLA-B alleles (11) was used (JPT, Berlin Germany). Forin vitroexpansion and proliferation assays, both HIV peptide pool (see above) and the human cytomegalovirus promiscuous epitope pp65340-355
(41) (Princeton Biomolecules, Langhorne, PA) were used as controls.
Ex vivoinduction and detection of cytokine gene expression by qRT-PCR.Peripheral blood mononuclear cells (PBMC) isolated from venous blood by Ficoll-Hypaque density gradient centrifugation were re-suspended in RPMI medium supplemented with 100g of kanamycin/ ml, 10 mM HEPES, 1 mM sodium pyruvate, 1 mM GlutaMAX, and non-essential amino acids (all from Gibco, Paisley, Scotland) (complete
medium) and 5% human serum (Blutspendezentrum UniversitätsSpital, Basel, Switzerland), at a final concentration of 106cells/ml, plated in 96
U-bottom well plates (200l/well), and incubated for overnight resting. The cells were then stimulated with either a test (L-Tag) or a control (CEF, HIV) peptide pool (1g/ml) or phytohemagglutinin (PHA; 1g/ml) and harvested after 3 h for RNA extraction (RNeasy minikit protocol; Qiagen, Basel, Switzerland) and cDNA synthesis (Invitrogen, Carlsbad, CA). Quantitative gene amplification (i.e., qRT-PCR) was performed, as pre-viously described (40), by using an ABI Prism 7500 FAST sequence detec-tion system with a TaqMan Universal PCR master mix reagents kit and “on demand” sets of primers and probes for cytokine gene expression (gamma interferon [IFN-␥], interleukin-10 [IL-10], and transforming growth factor1 [TGF-1]; Applied Biosystems, Rotkreuz, Switzerland).
-Actin was used as endogenous reference gene, and normalized data were analyzed by the 2⫺⌬⌬CTmethod (34).
Cell cultures.Monocytes (CD14⫹) sorted from PBMC by using mag-netic beads (Miltenyi Biotech) were cultured from 5 to 7 days in RPMI complete medium supplemented with 10% fetal calf serum (Gibco), 0.004% -mercaptoethanol, recombinant human IL-4 (rhIL-4; 1,000 U/ml), and recombinant human granulocyte-macrophage colony-stimu-lating factor (50 ng/ml) to generate immature dendritic cells (iDCs). To induce maturation, iDCs were overnight exposed to 1g of lipopolysac-charide (Abortus Aequi; Sigma-Aldrich, St. Louis, MO)/ml. CD4⫹T cells positively sorted from PBMC by using magnetic beads were cultured in complete medium with 5% human serum in 24 flat-bottom well plates at a 106-cells/ml concentration in the presence of autologous irradiated
ma-ture dendritic cells (mDCs), previously pulsed for 2 h with peptide pools (10g/ml), either for priming (day 0) or restimulation (day 7). rhIL-2 (Hoffmann-La Roche, Basel, Switzerland) was added to cultures at 1, 1, and 5 ng/ml on days 3, 7, and 10, respectively.
Regulatory T cell cultures were established byex vivomagnetic sorting of CD4⫹C25⫹CD127⫺/dimsubset, as previously described (48). The cells
were subsequently stimulated with L-Tag peptide pool (5g/ml) or con-trol peptides, including HCMVpp65340-355and HIV peptide pool, in the presence of 10g of anti-CD28 (BD Bioscience, Allschwil, Switzer-land)/ml and 5 ng of rIL-2/ml. The cultures were similarly restimulated on day 7. IL-10-secreting regulatory T (Treg) cells were sorted on day 14 by cytokine secretion assay (Miltenyi Biotec). For suppression assays, CD4⫹ CD25⫹(high)CD127⫺, IL-10-secreting T cells were cultured in the upper
chamber of 24-transwell plates (BD Bioscience) with a double amount (0.5:1) of autologous CD4⫹CD25⫺T cells, stimulated with 1 mg of anti-CD3/CD28 (BD Bioscience)/ml seeded in the lower chamber, and cul-tured for 8 days. The CD4⫹CD25⫺T cell proliferation was measured by using cell proliferation reagent WST-1 (Roche Applied Science) accord-ing to the manufacturer’s instructions, and the absorbance was read at 450 nm with an enzyme-linked immunosorbent assay plate reader.
Regulatory T cell quantification by flow cytometry.CD4⫹T cells stimulated by peptide pools, as described above, were stained with anti-CD4-fluorescein isothiocyanate (FITC) and anti-CD25-allophycocyanin (APC) antibodies (BD Biosciences). Anti-FoxP3 PE antibodies and FoxP3 Fix/Perm buffer were used for intracellular staining according to the man-ufacturer’s protocol (eBioscience, Vienna, Austria). Separation into CD25 bright (CD25high) and CD25 dim (CD25low) cells was carried out
using a fluorescence cutoff defined in healthy donors. Anti-CD103 PerCP (eBioscience) and anti-IL-10 APC intracellular staining (BD Bioscience) was additionally carried out for the identification of IL-10-secreting acti-vated Treg cells. The data were acquired on a FACSCalibur flow cytometer equipped with CellQuest software (Becton Dickinson, San Jose, CA).
Cytokine measurement.A FlowCytomix sample kit (eBioscience) was used to measure IFN-␥, IL-10, and TGF-1 protein release in culture supernatants of peptide-stimulated T cells. Samples were run on a FACSCalibur flow cytometer equipped with CellQuest software (Becton Dickinson), analyzed with BMS FlowCytomix software (eBioscience), and referred to a standard curve for quantification.
on November 7, 2019 by guest
http://jvi.asm.org/
Statistical analysis.Statistical analysis was performed with GraphPad Prism (v5.1) and SAS/STAT (v9.1). The data were reported as means⫾ the standard deviations (SD) or mean⫾the standard errors (SE), with median values and ranges where appropriate. Distributions of categorical markers were analyzed by both2and Fisher exact tests. When comparing
groups following a normal distribution (Shapiro-Wilk test),ttests (either pooled or Cochran method) were used. An F test was used to calculate variance among groups of samples. If a non-normal distribution was in-dicated, nonparametric tests such as Mann-Whitney U tests and Spear-man’scorrelation analyses were used.Pvalues of⬍0.05 (95% confi-dence interval [CI]) were considered statistically significant.
RESULTS
Clinical profiles of patients.
The average age of patients enrolled
in the study (
n
⫽
110) was 64
⫾
7.7 years (range, 49 to 90 years) for
PCa (
n
⫽
60) and 67
⫾
7.4 years (range, 48 to 81 years) for
age-matched BPH (
n
⫽
50), respectively.
Of 60 PCa patients, 1 was diagnosed with clinical stage pT1b,
10 with pT2a, 2 with pT2b, the majority (
n
⫽
30; 51%) with
clinical stage pT2c, 4 with pT3a, and 3 with pT3b. Ten (17%)
patients had tumors whose stage at diagnosis could not be
as-sessed. Average serum PSA value was 17.4
⫾
36.2 ng/ml (median,
6.7 ng/ml; range, 1.6 to 206 ng/ml) in PCa patients before surgery
(
n
⫽
50, 83%) and 5.6
⫾
5.7 ng/ml (median, 3.9 ng/ml; range, 0.4
to 26 ng/ml) in BPH patients (
n
⫽
36, 72%). The Gleason score of
the tumor specimens (
n
⫽
55, 92%) ranged from 5 to 9 according
to immunohistochemical analysis (
Tables 1
and
2
).
L-Tag DNA detection in tissue specimens and BKV specific
humoral response.
The presence of polyomavirus BK was
ana-lyzed by BKV L-Tag DNA detection in surgically excised PCa (
n
⫽
43/60, 72%) and BPH (
n
⫽
38/50, 76%) specimens. Positive
sam-ples (hereafter referred to as BKV
⫹) were identified among both
PCa (mean
⫽
451.4 copies/10
5cells;
n
⫽
18/43, 42%) and BPH
(mean
⫽
391.5 copies/10
5cells;
n
⫽
12/38, 32%) with no
signifi-cant quantitative differences among groups of patients (
P
⫽
0.72)
(
Fig. 1A
). No significant association (
2) with cancer (
P
⫽
0.18) or
Gleason score (GS
⫹ⱖ
7;
P
⫽
0.82) was observed. However, high
PSA levels (PSA
ⱖ
4 ng/ml) were more frequently detectable in
sera from patients with BKV
⫹PCa (
P
⬍
0.05).
Humoral response against BKV VP1 and L-Tag was analyzed
in sera from patients with PCa and BPH. Upon sample
stratifica-tion based on BKV L-Tag DNA tissue testing, we noted that the
levels of L-Tag-specific IgG (OD) were significantly higher in
pa-tients bearing BKV
⫹than BKV
⫺PCa (
P
⫽
0.01), whereas they
were similarly low in patients with BKV
⫹or BKV
⫺BPH. In
con-trast, anti-VP1 IgG levels were similar in patients with PCa or
BPH, irrespective of their BKV molecular status (
Fig. 1B
). Overall,
detectable evidence of humoral responsiveness to L-Tag (OD
ⱖ
0.04) was observed in 17/18 (94%) patients with BKV
⫹PCa and in
7/12 (58%) patients with BKV
⫹BPH with a significant association
(
2) between BKV
⫹lesions and L-Tag IgG only in patients with
PCa (
P
⫽
0.005) (
Table 1
).
[image:3.585.298.544.87.626.2]Cytokine gene expression pattern in PBMC from patients
with PCa or BPH upon
ex vivo
BKV L-Tag peptide pool
stimu-lation.
Humoral response data, showing a high level of L-Tag IgG
response in patients bearing BKV
⫹PCa, prompted us to explore
cellular immune responsiveness to this antigen. Freshly isolated
PBMC from 60 patients with PCa and 50 age-matched patients
with BPH were
ex vivo
stimulated for 3 h with an L-Tag peptide
pool, and IFN-
␥
and IL-10 cytokine gene expression were used as
a readout. An HIV peptide pool with B gag motif was used as a
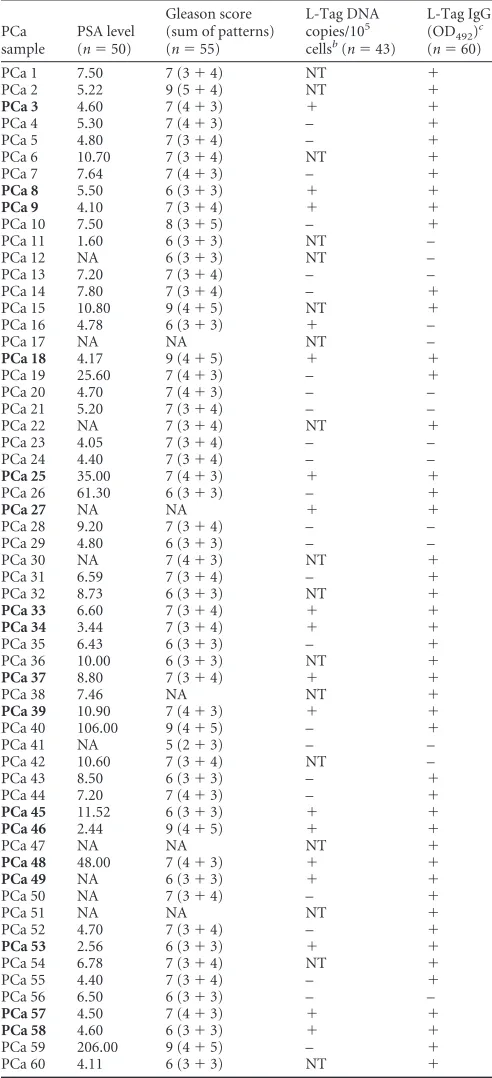
TABLE 1Patient PSA levels, Gleason score, L-Tag molecular testing results, and IgG serology for PCa samplesa
PCa sample
PSA level (n⫽50)
Gleason score (sum of patterns) (n⫽55)
L-Tag DNA copies/105 cellsb(n⫽43)
L-Tag IgG (OD492)
c
(n⫽60)
PCa 1 7.50 7 (3⫹4) NT ⫹
PCa 2 5.22 9 (5⫹4) NT ⫹
PCa 3 4.60 7 (4⫹3) ⫹ ⫹
PCa 4 5.30 7 (4⫹3) – ⫹
PCa 5 4.80 7 (3⫹4) – ⫹
PCa 6 10.70 7 (3⫹4) NT ⫹
PCa 7 7.64 7 (4⫹3) – ⫹
PCa 8 5.50 6 (3⫹3) ⫹ ⫹
PCa 9 4.10 7 (3⫹4) ⫹ ⫹
PCa 10 7.50 8 (3⫹5) – ⫹
PCa 11 1.60 6 (3⫹3) NT –
PCa 12 NA 6 (3⫹3) NT –
PCa 13 7.20 7 (3⫹4) – –
PCa 14 7.80 7 (3⫹4) – ⫹
PCa 15 10.80 9 (4⫹5) NT ⫹
PCa 16 4.78 6 (3⫹3) ⫹ –
PCa 17 NA NA NT –
PCa 18 4.17 9 (4⫹5) ⫹ ⫹
PCa 19 25.60 7 (4⫹3) – ⫹
PCa 20 4.70 7 (4⫹3) – –
PCa 21 5.20 7 (3⫹4) – –
PCa 22 NA 7 (3⫹4) NT ⫹
PCa 23 4.05 7 (3⫹4) – –
PCa 24 4.40 7 (3⫹4) – –
PCa 25 35.00 7 (4⫹3) ⫹ ⫹
PCa 26 61.30 6 (3⫹3) – ⫹
PCa 27 NA NA ⫹ ⫹
PCa 28 9.20 7 (3⫹4) – –
PCa 29 4.80 6 (3⫹3) – –
PCa 30 NA 7 (4⫹3) NT ⫹
PCa 31 6.59 7 (3⫹4) – ⫹
PCa 32 8.73 6 (3⫹3) NT ⫹
PCa 33 6.60 7 (3⫹4) ⫹ ⫹
PCa 34 3.44 7 (3⫹4) ⫹ ⫹
PCa 35 6.43 6 (3⫹3) – ⫹
PCa 36 10.00 6 (3⫹3) NT ⫹
PCa 37 8.80 7 (3⫹4) ⫹ ⫹
PCa 38 7.46 NA NT ⫹
PCa 39 10.90 7 (4⫹3) ⫹ ⫹
PCa 40 106.00 9 (4⫹5) – ⫹
PCa 41 NA 5 (2⫹3) – –
PCa 42 10.60 7 (3⫹4) NT –
PCa 43 8.50 6 (3⫹3) – ⫹
PCa 44 7.20 7 (4⫹3) – ⫹
PCa 45 11.52 6 (3⫹3) ⫹ ⫹
PCa 46 2.44 9 (4⫹5) ⫹ ⫹
PCa 47 NA NA NT ⫹
PCa 48 48.00 7 (4⫹3) ⫹ ⫹
PCa 49 NA 6 (3⫹3) ⫹ ⫹
PCa 50 NA 7 (3⫹4) – ⫹
PCa 51 NA NA NT ⫹
PCa 52 4.70 7 (3⫹4) – ⫹
PCa 53 2.56 6 (3⫹3) ⫹ ⫹
PCa 54 6.78 7 (3⫹4) NT ⫹
PCa 55 4.40 7 (3⫹4) – ⫹
PCa 56 6.50 6 (3⫹3) – –
PCa 57 4.50 7 (4⫹3) ⫹ ⫹
PCa 58 4.60 6 (3⫹3) ⫹ ⫹
PCa 59 206.00 9 (4⫹5) – ⫹
PCa 60 4.11 6 (3⫹3) NT ⫹
a
NA, not available; NT, not tested. For L-Tag BKV, the plus or minus indicates L-Tag DNA detection in tissue specimens that is above or below the cutoff (50 copies/105
cells), respectively. For Tag IgG, the plus or minus indicates IgG activity against L-Tag that is above or below the cutoff (OD492⬎0.04), respectively. Samples for patients
sharing L-Tag BKV⫹specimens and IgG⫹activity against L-Tag (IgGⱖ0.04:n⫽17/ 18,P⫽0.005 [2]) are indicated in boldface.
b
BKV⫹,n⫽18; BKV⫺,n⫽25. cIgGⱖ0.04,n⫽46; IgG⬍0.04,n⫽14.
on November 7, 2019 by guest
http://jvi.asm.org/
negative control to provide a baseline, allowing the calculation of
cytokine gene expression fold changes.
In L-Tag IgG-seronegative patients (PCa,
n
⫽
14; BPH,
n
⫽
12
[
Tables 1
and
2
]), regardless of underlying disease, L-Tag peptide
pool stimulated cytokine gene expression was usually low
(
Fig. 2A
). However, in L-Tag IgG
⫹patients with PCa (
n
⫽
46),
[image:4.585.298.541.71.402.2]L-Tag peptide pool induced a significantly higher IL-10 gene
ex-pression, (
P
⫽
0.03) but rather a decreased IFN-
␥
gene expression
(
P
⫽
0.04) compared to seronegative patients. In contrast, in
L-Tag IgG
⫹patients with BPH (
n
⫽
38), L-Tag peptide pool did not
induce significantly higher IFN-
␥
(
P
⫽
0.8) and IL-10 (
P
⫽
0.9)
gene expression compared to seronegative patients. Accordingly,
these tests also showed that the L-Tag peptide pool induced a
higher IL-10 than IFN-
␥
gene expression in L-Tag IgG
⫹patients
with PCa (
n
⫽
46;
P
⫽
0.0001) and, to a lesser, nonsignificant
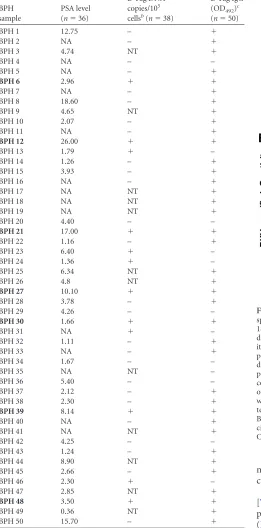
TABLE 2Patient PSA levels, L-Tag molecular testing results, and IgG serology for BPH samplesa
BPH sample
PSA level (n⫽36)
L-Tag DNA copies/105
cellsb(n⫽38)
L-Tag IgG (OD492)c
(n⫽50)
BPH 1 12.75 – ⫹
BPH 2 NA – ⫹
BPH 3 4.74 NT ⫹
BPH 4 NA – –
BPH 5 NA – ⫹
BPH 6 2.96 ⫹ ⫹
BPH 7 NA – ⫹
BPH 8 18.60 – ⫹
BPH 9 4.65 NT ⫹
BPH 10 2.07 – ⫹
BPH 11 NA – ⫹
BPH 12 26.00 ⫹ ⫹
BPH 13 1.79 ⫹ –
BPH 14 1.26 – ⫹
BPH 15 3.93 – ⫹
BPH 16 NA – ⫹
BPH 17 NA NT ⫹
BPH 18 NA NT ⫹
BPH 19 NA NT ⫹
BPH 20 4.40 – –
BPH 21 17.00 ⫹ ⫹
BPH 22 1.16 – ⫹
BPH 23 6.40 ⫹ –
BPH 24 1.36 ⫹ –
BPH 25 6.34 NT ⫹
BPH 26 4.8 NT ⫹
BPH 27 10.10 ⫹ ⫹
BPH 28 3.78 – ⫹
BPH 29 4.26 – –
BPH 30 1.66 ⫹ ⫹
BPH 31 NA ⫹ –
BPH 32 1.11 – ⫹
BPH 33 NA – ⫹
BPH 34 1.67 – –
BPH 35 NA NT –
BPH 36 5.40 – –
BPH 37 2.12 – ⫹
BPH 38 2.30 – ⫹
BPH 39 8.14 ⫹ ⫹
BPH 40 NA – ⫹
BPH 41 NA NT ⫹
BPH 42 4.25 – –
BPH 43 1.24 – ⫹
BPH 44 8.90 NT ⫹
BPH 45 2.66 – ⫹
BPH 46 2.30 ⫹ –
BPH 47 2.85 NT ⫹
BPH 48 3.50 ⫹ ⫹
BPH 49 0.36 NT ⫹
BPH 50 15.70 – ⫹
a
NA, not available; NT, not tested. For L-Tag BKV, the plus or minus indicates L-Tag DNA detection in tissue specimens that is above or below the cutoff (50 copies/105
cells), respectively. For Tag IgG, the plus or minus indicates IgG activity against L-Tag that is above or below the cutoff (OD492⬎0.04), respectively. Samples for patients
sharing L-Tag BKV⫹specimens and IgG⫹activity against L-Tag (IgGⱖ0.04:n⫽7/12,
P⫽0.005 [2]) are indicated in boldface.
b
BKV⫹,n⫽12; BKV⫺,n⫽26. cIgGⱖ0.04,n⫽38; IgG⬍0.04,n⫽12.
FIG 1BKV L-Tag DNA detection in tissue specimens and L-Tag- or VP1-specific IgG response. (A) BKV L-Tag DNA was detectable in either PCa (n⫽
18/43, 42%) or BPH (n⫽12/38, 32%) surgically excised lesions. Quantitative data, expressed as copy number/105cells, were comparatively analyzed in
pos-itive PCa and BPH tissues. To emphasize the specificity of BKV detection in prostate specimens, JCV L-Tag sequence was also investigated. Rare samples displayed JCV L-Tag sequences in patients with PCa (n⫽1/40, 2%) or in patients with BPH (n⫽1/36, 3%) with copy numbers markedly below 50 copies/105cells, the arbitrary limit for BKV L-Tag DNA detection selected in
our study (cutoff; dotted line). (B) BKV L-Tag and VP1 IgG titer in patients with either PCa or BPH, stratified according to BKV L-Tag DNA molecular testing in their tissues (positive lesions, BKV⫹ or⫹; negative lesions, BKV⫺or⫺). Cutoff (dotted line) was set at 0.04, the lowest OD492
suffi-cient to detect antibody activity. Boxes and whiskers representing the 95% CI are also shown.
on November 7, 2019 by guest
http://jvi.asm.org/
[image:4.585.42.303.96.624.2]extent in L-Tag IgG
⫹patients with BPH (
n
⫽
38;
P
⫽
0.06)
(
Fig. 2A
).
To investigate the relationship eventually occurring between
the BKV L-Tag-specific humoral response and the L-Tag-specific
gene expression pattern, the L-Tag-specific IgG activity was
plot-ted against the IL-10/IFN-
␥
gene expression ratio. A significant
direct correlation was indeed observed in patients with PCa
(Spearman,
⫽
0.4,
P
⫽
0.009) but not in patients with BPH (
⫽
⫺
0.2,
P
⫽
0.3) (
Fig. 2B
).
These results led us to comparatively investigate cytokine gene
expression induced by the L-Tag peptide pool, the CEF peptide
pool, or PHA in L-Tag-seropositive patients with PCa or BPH and
in seropositive gender- but not age-matched healthy donors. In
contrast to PBMC from IgG
⫹patients with PCa and BPH (see
above), L-Tag peptide pool stimulation of PBMC from L-Tag
IgG
⫹healthy donors induced an IFN-
␥
gene expression
signifi-cantly higher than IL-10 gene expression (
n
⫽
8;
P
⫽
0.003). Most
importantly, the CEF peptide pool and PHA induced a similar,
significantly higher IFN-
␥
than IL-10 gene expression in PBMC
from patients with PCa or BPH (
P
⬍
0.0001) or from health
do-nors (HD;
P
⬍
0.001) (
Fig. 2C
).
Notably, IL-10 gene expression induced by L-Tag peptide pool
was significantly higher than IL-10 gene expression induced by
CEF or PHA in PBMC from L-Tag IgG
⫹patients with PCa (
P
⬍
0.0001 and
P
⫽
0.0002, respectively) or BPH (
P
⬍
0.0001 and
P
⫽
0.001, respectively) (
Fig. 2C
). In PBMC from healthy donors,
IL-10 gene expression was similarly negligible irrespective of the
stimuli used. Remarkably, IFN-
␥
gene expression could be
in-duced by CEF of PHA to comparably high extents in PBMC from
L-Tag IgG
⫹patients with PCa or BPH or from healthy donors
FIG 2Cytokine gene expression uponex vivoBKV L-Tag peptide pool stimulation in PBMC from patients bearing PCa or BPH or from healthy donors (HD). (A) IFN-␥(white boxes) and IL-10 (gray boxes) cytokine gene expression was measured uponex vivoBKV L-Tag peptide pool stimulation of PBMC from patients with PCa and PBH, stratified according to their L-Tag-specific IgG activity (IgG⫹ⱖ0.04). HIV peptide pool stimulation was used as background to compute fold changes in specific gene expression (cytokine gene relative quantification [2⫺⌬⌬CT]). An arbitrary cutoff was set at 2-fold (dotted line). Boxes and
whiskers representing the 95% CI show the significance of differential gene expression for each cytokine based on patient group stratifications. (B) Correlation (Spearman) between cytokine gene expression, as detected uponex vivoL-Tag peptide pool stimulation of PBMC from BKV L-Tag-seropositive patients with PCa or BPH and L-Tag-specific IgG. IL-10/IFN-␥gene expression ratios induced by L-Tag stimulation were plotted against L-Tag-specific IgG activity for all IgG⫹PCa (n⫽46; upper quadrant) and IgG⫹BPH (n⫽38; lower quadrant) patients. Cutoff (dotted line) was set at an OD492of 0.04 (see the legend toFig. 1).
(C) Boxes and whiskers representing the 95% CI for IFN-␥(white boxes) and IL-10 (gray boxes) cytokine gene expression, as observed in PBMC from L-Tag IgG⫹patients with PCa (n⫽46), age-matched patients with BPH (n⫽38), and non-age-matched but gender-matched healthy donors (HD;n⫽8) afterex vivo
stimulation with a BKV L-Tag peptide pool, a cytomegalovirus/Epstein-Barr virus/influenza virus peptide pool (CEF), or PHA. HIV peptide pool stimulation was used as the background to compute fold changes in specific gene expression (cytokine gene relative quantification [2⫺⌬⌬CT]). An arbitrary cutoff was set at 2-fold
(dotted line).
on November 7, 2019 by guest
http://jvi.asm.org/
[image:5.585.115.475.64.411.2](
Fig. 2C
), thereby suggesting a specificity of the cytokine gene
expression pattern induced by L-Tag stimulation in PBMC from
L-Tag IgG
⫹patients.
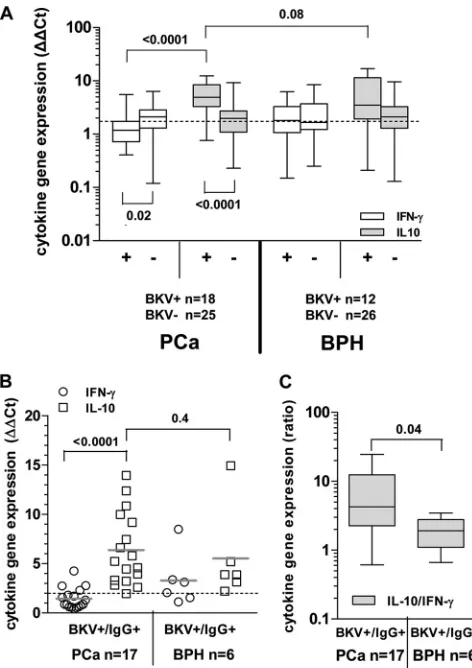
BKV L-Tag peptide pool-stimulated cytokine gene
expres-sion pattern in PBMC from patients bearing BKV
ⴙPCa or BPH.
We then evaluated in detail the L-Tag-specific cellular immune
response in patients bearing BKV
⫹or BKV
⫺PCa or BPH.
Analy-sis of these data confirmed that a highly significant increase in
IL-10 gene expression upon L-Tag peptide pool stimulation was
detectable in PBMC from patients bearing a BKV
⫹PCa compared
to those from patients bearing BKV
⫺PCa (
P
⬍
0.0001). In
con-trast, IFN-
␥
gene expression induced by the L-Tag peptide pool
was modest but detectable in PBMC from patients with BKV
⫺PCa and significantly higher than that detectable in similarly
stimulated PBMC from patients bearing BKV
⫹PCa (
P
⫽
0.02)
(
Fig. 3A
). On the other hand, expression of IFN-
␥
and IL-10
genes upon L-Tag peptide pool stimulation was similar in
PBMC from patients bearing BKV
⫹or BKV
⫺BPH.
An analysis limited to patients with evidence of BKV
L-Tag-specific IgG also showed a highly significant (
P
⬍
0.0001)
pre-dominance of IL-10 versus IFN-
␥
gene expression in patients
bearing BKV
⫹prostate lesions. In contrast, the IFN-
␥
and IL-10
gene expression detectable upon L-Tag-triggered PBMC
stimula-tion was similar in L-Tag IgG
⫹patients with BKV
⫹BPH (
Fig. 3B
).
Indeed, although IL-10 gene expression did not significantly
differ between patients with BKV
⫹PCa or BKV
⫹BPH (
P
⬎
0.05)
(
Fig. 3A
and
B
), most interestingly, the IL-10/IFN-
␥
gene
expres-sion ratio was significantly (
P
⫽
0.04) higher in BKV-specific
IgG
⫹patients bearing BKV
⫹PCa (
n
⫽
17) than in BKV-specific
IgG
⫹patients with BKV
⫹BPH (
n
⫽
6) (
Fig. 3C
).
Comparative analysis of L-Tag-induced cytokine gene
ex-pression in patients bearing BKV
ⴙPCa with or without
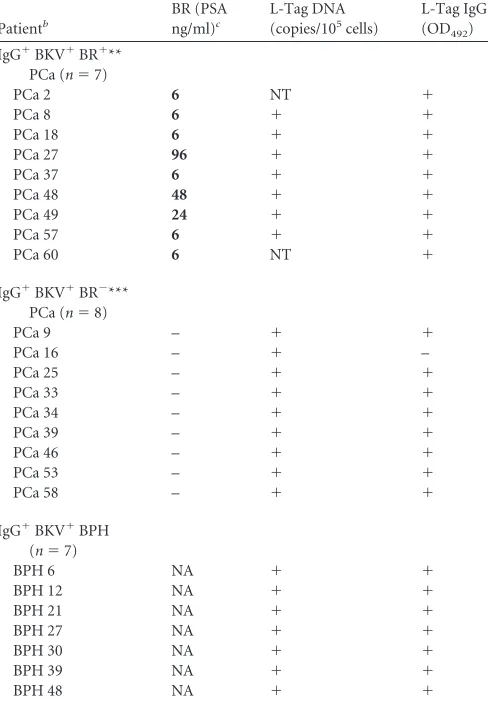
evi-dence of biochemical recurrence (BR).
The results obtained in
the first part of our study suggested that a BKV-specific immune
response is characterized by specific features, particularly in
pa-tients bearing BKV
⫹PCa, compared to patients with BPH, let
alone healthy donors. These data raised the obvious issue of the
association of this response pattern with PCa clinical course.
Therefore, considering their peculiar clinical condition, we
an-alyzed in detail BKV L-Tag peptide-induced cytokine gene
expres-sion in PBMC from patients bearing BKV
⫹cancers with
biochem-ical evidence of recurrence (BR
⫹). BR was observed in 9/48 (19%)
patients with PCa with complete follow-up, after 6 weeks (
n
⫽
6),
24 weeks (
n
⫽
1), 48 weeks (
n
⫽
1), and 96 weeks (
n
⫽
1). Two
patients were excluded from the study because BKV molecular
testing on tissue lesions was not available (
Table 3
). Despite the
limited number of BR
⫹PCa patients, a significant association
be-tween BR status and BKV
⫹lesions, irrespective of serological
sta-tus, was observed. Indeed, in 7/16 patients bearing BKV
⫹PCa,
evidence of BR was detectable within a 96 weeks of follow-up,
compared to none of 17 patients with BKV
⫺PCa (Fisher exact
test,
P
⫽
0.004).
Then, we comparatively analyzed cytokine gene expression
upon L-Tag stimulation in patients with BKV
⫹PCa stratified
based on evidence of BR. In order to evaluate a more
homoge-neous test group, we excluded the only BR
⫺patient with BKV
⫹PCa, seronegative for L-Tag-specific IgG (
Table 3
).
In BKV L-Tag-specific IgG
⫹patients with BKV
⫹PCa (
n
⫽
15),
a distinctive L-Tag-induced gene signature prominently emerged.
Indeed, significantly higher IL-10/IFN-
␥
(
P
⬍
0.01) and TGF-

1/
IFN-
␥
(
P
⫽
0.02) gene expression ratios were observed in PBMC
from patients bearing a BKV
⫹PCa with BR evidence (
n
⫽
7)
compared to those detectable in PBMC from patients bearing a
BKV
⫹PCa with no BR evidence (
n
⫽
8) (
Fig. 4A
). Importantly, in
the former group, the extent of L-Tag-specific IgG response was
significantly correlated with both the IL-10/IFN-
␥
(
⫽
0.8,
P
⫽
0.02) and the TGF-

1/IFN-
␥
(
⫽
0.7,
P
⫽
0.05) gene expression
ratios induced in PBMC by L-Tag peptide stimulation (data not
shown).
To verify these findings at the protein level, we cultured CD4
⫹T cells from patients bearing BKV
⫹PCa with (
n
⫽
7) or without
(
n
⫽
8) evidence of BR in the presence of autologous DC pulsed
FIG 3Cytokine gene expression pattern uponex vivoBKV L-Tag peptide pool stimulation in L-Tag IgG⫹patients bearing BKV⫹PCa or BPH. (A) IFN-␥ (white boxes) and IL-10 (gray boxes) cytokine gene expression was analyzed uponex vivoBKV L-Tag peptide pool stimulation of PBMC from patients with PCa and PBH, stratified according to their BKV L-Tag DNA molecular testing (positive lesions, BKV⫹or⫹; negative lesions, BKV⫺or⫺). HIV peptide pool stimulation was used as background to compute fold changes in specific gene expression (cytokine gene relative quantification [2⫺⌬⌬CT]). An arbitrary
cut-off was set at 2-fold (dotted line). Boxes and whiskers representing the 95% CI show the significance of differences observed for each cytokine gene expression based on patient group stratifications. (B) IFN-␥(white circles) and IL-10 (white squares) gene expression was measured upon L-Tag peptide pool stim-ulation (cutoff, 2-fold; dotted line) of PBMC from BKV⫹/IgG⫹patients with PCa (n⫽17) or BPH (n⫽6). (C) IL-10/IFN-␥gene expression ratio observed after L-Tag peptide stimulation of PBMC from BKV⫹/IgG⫹patients bearing BKV⫹PCa or BKV⫹BPH. Boxes and whiskers representing the 95% CI show differences in cytokine expression pattern between BKV⫹/IgG⫹ patient groups.
on November 7, 2019 by guest
http://jvi.asm.org/
[image:6.585.301.537.65.399.2]with either HIV derived or L-Tag peptide pools, and we analyzed
IFN-
␥
, IL-10, and TGF-

1 release upon specific stimulation. In
keeping with gene expression data (see above), we found that
L-Tag-specific stimulation in BR
⫹patients with BKV
⫹cancers
in-duced a significantly (
P
⬍
0.01) lower IFN-
␥
production and a
significantly (
P
⫽
0.03) higher TGF-

1 production compared to
cells from BR
⫺patients bearing BKV
⫹PCa (
Fig. 4b
). Although
IL-10 release did not significantly differ in the two groups, the
IL-10/IFN-
␥
protein ratio was significantly (
P
⬍
0.01) higher in
BR
⫹patients bearing BKV
⫹PCa.
L-Tag peptide pool stimulation expands CD4
ⴙCD25
ⴙ(high)FoxP3
ⴙT cells in patients bearing BKV
ⴙPCa with BR.
The
pe-culiar gene expression pattern induced by L-Tag in patients
bear-ing BKV
⫹PCa, and, particularly, in BR
⫹patients, prompted us to
investigate CD4
⫹regulatory (CD25
⫹FoxP3
⫹) T cells in PBMC
from these patients, both
ex vivo
and after L-Tag peptide
pool-specific stimulation. In particular, to adequately control our
study, we focused on cells from L-Tag-specific IgG
⫹patients
bear-ing BKV
⫹PCa with or without BR (
n
⫽
7 and
n
⫽
8, respectively)
and from L-Tag-specific IgG
⫹patients bearing BKV
⫹BPH (
n
⫽
7) (
Table 3
).
Peripheral blood CD4
⫹T cells from these patients were stained
on their surfaces with anti-CD25 monoclonal antibody (MAb)
and intracellularly with anti-Foxp3 MAb. No differences were
de-tectable between patients with PCa, irrespective of BR, and
pa-tients with BPH regarding CD4
⫹CD25
⫹FoxP3
⫹T cells
ex vivo
frequency (
Fig. 5A
).
CD4
⫹T cells from the different groups of patients under
in-vestigation were then cultured for 2 weeks in the presence of
au-tologous mDC pulsed with the L-Tag peptide pool, the HIV
pep-tide pool, or the HCMVpp65
340-355promiscuous peptide. CD4
⫹CD25
⫹(high)populations in cultured cells were identified as shown
[image:7.585.42.286.90.441.2]in
Fig. 5B
. After L-Tag peptide pool stimulation, cultures from
TABLE 3Analysis of L-Tag IgG⫹patients bearing BKV⫹PCa with or without BRa
Patientb
BR (PSA ng/ml)c
L-Tag DNA (copies/105cells)
L-Tag IgG (OD492)
IgG⫹BKV⫹BR⫹** PCa (n⫽7)
PCa 2 6 NT ⫹
PCa 8 6 ⫹ ⫹
PCa 18 6 ⫹ ⫹
PCa 27 96 ⫹ ⫹
PCa 37 6 ⫹ ⫹
PCa 48 48 ⫹ ⫹
PCa 49 24 ⫹ ⫹
PCa 57 6 ⫹ ⫹
PCa 60 6 NT ⫹
IgG⫹BKV⫹BR⫺*** PCa (n⫽8)
PCa 9 – ⫹ ⫹
PCa 16 – ⫹ –
PCa 25 – ⫹ ⫹
PCa 33 – ⫹ ⫹
PCa 34 – ⫹ ⫹
PCa 39 – ⫹ ⫹
PCa 46 – ⫹ ⫹
PCa 53 – ⫹ ⫹
PCa 58 – ⫹ ⫹
IgG⫹BKV⫹BPH (n⫽7)
BPH 6 NA ⫹ ⫹
BPH 12 NA ⫹ ⫹
BPH 21 NA ⫹ ⫹
BPH 27 NA ⫹ ⫹
BPH 30 NA ⫹ ⫹
BPH 39 NA ⫹ ⫹
BPH 48 NA ⫹ ⫹
a
NA, not available; NT, not tested. BR, biochemical recurrence upon 5-year follow-up. bBR⫹, PSAⱖ0.2 ng/ml; BR⫺, PSA⬍0.04 ng/ml. Timing of biochemical recurrence is
expressed in weeks in boldface type.
FIG 4L-Tag peptide pool induced cytokine gene expression in L-Tag IgG⫹ patients bearing BKV⫹PCa with or without evidence of biochemical recur-rence (BR). (A) IL-10/IFN-␥(gray boxes) and TGF-1/IFN-␥(white boxes) gene expression ratios, as detected after L-Tag peptide-specificex vivo stimu-lation of PBMC from L-Tag IgG⫹patients bearing BKV⫹PCa with (n⫽7) or without (n⫽8) BR evidence. HIV peptide pool stimulation was used as a background to compute gene expression fold changes (2⫺⌬⌬CT; cutoff, 2-fold).
Boxes and whiskers representing the 95% CI show significant differences for both IL-10/IFN-␥and TGF-1/IFN-␥gene expression ratios according to BR patient stratifications. (B) IFN-␥(white bars), IL-10 (light gray bars), and TGF-1 (dark gray bars) protein production from 2-weekin vitro-expanded PBMC from L-Tag IgG⫹patients bearing BKV⫹PCa with (n⫽7) or without (n⫽8) BR. HIV peptide poolin vitrostimulation was used as a control. Histograms⫾the standard errors are reported.
on November 7, 2019 by guest
http://jvi.asm.org/
[image:7.585.309.528.217.591.2]BR
⫹patients bearing BKV
⫹PCa contained significantly higher
percentages of CD4
⫹CD25
⫹(high)FoxP3
⫹cells compared to
sim-ilarly stimulated cultures from BR
⫺patients bearing BKV
⫹PCa
(
P
⬍
0.001) or to cultures from patients bearing BKV
⫹BPH (
P
⬍
0.001) (
Fig. 5C
). In contrast, HCMVpp65
340-355promiscuous
peptide failed to expand CD4
⫹CD25
⫹(high)FoxP3
⫹cells to
ex-tents significantly higher than HIV pool peptides in cells from any
of the patient population under investigation. Furthermore,
FoxP3
⫹protein expression upon L-Tag, but not HCMVpp65
340 – 355or HIV pool peptide stimulation, was significantly enhanced,
as evaluated by mean fluorescence intensity (MFI) measurement,
in cells from BR
⫹patients bearing BKV
⫹PCa in comparison to
cells from BR
⫺patients bearing BKV
⫹PCa (
P
⬍
0.001) or from
patients bearing BKV
⫹BPH (
P
⫽
0.001) (
Fig. 5D
).
Functional effector memory phenotype (CD103) and
regula-tory activity of BKV L-Tag
in vitro
-generated CD4
ⴙCD25
ⴙ(high)CD127
ⴚT cells.
To investigate the potential functional relevance
of the phenotypic modifications observed upon L-Tag
stimula-tion, PBMC from BR
⫹patients bearing BKV
⫹PCa (
n
⫽
3) were
cultured in the presence of L-Tag peptide pool, HCMVpp65
340-355promiscuous peptide and HIV peptide pool, as detailed in
Mate-rials and Methods. CD4
⫹CD25
⫹(high)T cells were then sorted as
CD127
⫺and incubated in the presence of the antigens used for initial
stimulation. High percentages of L-Tag and HCMVpp65
340-355stimulated CD4
⫹CD25
⫹(high)CD127
⫺T cells were able to
pro-duce IL-10, as detectable by intracellular staining (99.1%
⫾
0.2%
and 78.9%
⫾
3.2%, respectively) (
Fig. 6A
). However,
L-Tag-stim-ulated CD4
⫹CD25
⫹(high)CD127
⫺T cells showed a higher
expres-sion of CD103, a Treg effector memory marker (
35
), compared to
HCMVpp65
340-355or HIV peptide pool-stimulated cells (
Fig. 6B
).
Most importantly, L-Tag expanded CD4
⫹CD25
⫹(high)CD127
⫺,
IL-10-secreting T cells were able to inhibit the proliferation of
autologous anti-CD3/CD28 stimulated CD4
⫹CD25
⫺T cells in
coculture assays at a 0.5:1 ratio to a significantly higher extent than
HCMVpp65
340-355expanded CD4
⫹CD25
⫹(high)CD127
⫺T cells
(
P
⬍
0.0001) (
Fig. 6C
and
D
).
DISCUSSION
BKV infection has repeatedly been suggested to be associated with
cancers of the genitourinary tract. However, possibly due to
con-flicting results regarding detection of specific sequences and
pro-teins in human cancers, its oncogenic role is controversial (
1
).
FIG 5BKV L-Tag-specific expansion of CD4⫹T cell with a CD25⫹(high)FoxP3⫹regulatory phenotype in L-Tag IgG⫹patients bearing BR⫹BKV⫹PCa. (A)
Representative fluorescence-activated cell sorting (FACS) density plot analysis ofex vivoFoxP3 expression in CD4⫹CD25⫹T cells in PBMC from a PCa patient (upper panel) and a healthy donor (lower panel). The histogram shows means⫾the standard errors ofex vivo-detected frequencies of CD4⫹CD25⫹FoxP3⫹T cells in L-Tag IgG⫹patients with BR⫹/BKV⫹PCa (dotted bar), BR⫺/BKV⫹PCa (checkered bar) and BKV⫹BPH (striped bar) compared to healthy donors (black bar). (B) Gating strategies for CD4⫹T cell with a CD25⫹(high)FoxP3⫹phenotype, as detectable upon peptide stimulation. (C) Percentages of CD4⫹CD25⫹(high)
FoxP3⫹T cells in PBMC from L-Tag IgG⫹patients with BR⫹/BKV⫹PCa (n⫽7), BR⫺/BKV⫹PCa (n⫽8), or BKV⫹BPH (n⫽7) upon HIV peptide pool (circles) or L-Tag peptide pool (squares) stimulation. HCMVpp65340-355promiscuous peptide (triangles) was also used as an additional control on BR⫹/BKV⫹
PCa (n⫽6), BR⫺/BKV⫹PCa (n⫽7) or BKV⫹BPH (n⫽5) L-Tag IgG⫹patients. (D) Mean fluorescence intensity (MFI) of FoxP3 intracellular staining of cultured cells from L-Tag IgG⫹patients with BR⫹/BKV⫹PCa, BR⫺/BKV⫹PCa or BKV⫹BPH, after HIV peptide pool (circles), HCMVpp65340-355promiscuous
peptide (triangles), or L-Tag peptide pool (squares)in vitrostimulation. Overlaid histograms refer to FoxP3 MFI upon L-Tag peptide pool and HIV peptide pool (above) or L-Tag peptide pool and HCMVpp65340-355promiscuous peptide (below) stimulations compared to isotype staining.
on November 7, 2019 by guest
http://jvi.asm.org/
[image:8.585.83.502.66.367.2]In a recent past, we have analyzed in detail cellular immune
responses to BKV L-Tag-derived antigenic epitopes (
39
).
Prompted by these studies, we have now addressed key features of
BKV L-Tag-specific immune responsiveness in patients with PCa
and the association of these features with the clinical course.
Our data reveal that in patients with PCa and, in particular, in
patients showing biochemical evidence of tumor recurrence
(BR
⫹), immune responsiveness to BKV L-Tag is differentially
characterized by a number of conspicuous features, compared to
patients with no evidence of BR, or patients with BPH.
Indeed, in patients with BR
⫹PCa, a high titer of L-Tag-specific
IgG is significantly associated with a high IL-10/IFN-
␥
gene
ex-pression ratio as observed after
ex vivo
PBMC stimulation with
L-Tag peptides. Furthermore, in these patients, L-Tag peptide
stimulation of PBMC
in vitro
results in a significantly higher
ex-pansion of a CD4
⫹CD25
⫹(high)FoxP3
⫹population compared to
patients bearing BKV
⫹PCa without BR evidence or with patients
with BKV
⫹BPH. Notably, our data indicate that BKV L-Tag gene
expression is detectable with similar frequency and at similar copy
numbers in PCa and BPH tissues. Thus, we did not detect a
pref-erential BKV gene expression in PCa (
5
) but rather a different
pattern of L-Tag-specific immune responses.
At difference with capsid proteins, polyomavirus L-Tag is not
present in viral particles but is only produced in infected cells and
localizes in their nuclei. Therefore, while humoral response to
capsid proteins is widely detectable after infection, induction of
L-Tag-specific humoral responses is less likely to take place, unless
cell death repeatedly occurs, which has been suggested to be the
case in cancer tissues (
38
). Alternatively, we might hypothesize
that only BKV abortive infections, e.g., those possibly leading to
cancer transformation of infected cells, would permit L-Tag
expo-sure to the immune system, thus favoring the induction of an
antibody response (
38
). Indeed, our data show a significant
asso-ciation between L-Tag-specific IgG levels and L-Tag molecular
detection in patients with PCa but not in patients with BPH. In
contrast, VP1 IgG levels were similar in patients with PCa and
BPH, irrespective of BKV detection in prostate lesions, partially
reflecting humoral responses observed against Merkel cell
polyo-mavirus (MCV) VP1 in Merkel cell carcinoma (MCC), a cancer
associated with MCV infection (
50
).
Cellular immune responsiveness to BKV L-Tag is also
charac-terized by a number of peculiar features. In particular, in PBMC
from patients with PCa, the L-Tag peptide-specific response is
characterized by an IL-10 gene expression significantly higher
than that of IFN-
␥
gene. In PBMC from patients with BPH a
similar trend is detectable, whereas in cells from healthy donors,
IFN-
␥
gene expression is significantly higher than that of IL-10
gene. This gene expression pattern is unique to BKV
L-Tag-stim-ulated cells because in PBMC from patients with PCa or BPH or
from healthy donors, other viral peptides (CEF pool) or PHA
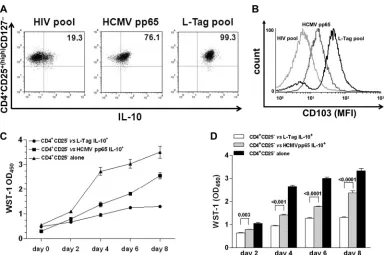
FIG 6Generation of BKV L-Tag-specific functional CD4⫹CD25⫹(high)FoxP3⫹T cells with effector-memory regulatory phenotype and suppressive activity. (A)
Intracellular IL-10 protein production in CD4⫹CD25⫹(high)CD127⫺T cells from one representative L-Tag IgG⫹patient bearing a BKV⫹PCa with BR, out of
three studied, after L-Tag peptide pool stimulation (right quadrant) compared to HCMVpp65340-355promiscuous peptide stimulation (middle quadrant) and
negative control HIV peptide pool stimulation (left quadrant). (B) Expression of the regulatory T cell activation marker CD103 in IL-10-secreting CD4⫹ CD25⫹(high)CD127⫺T cells (see panel A) from one representative L-Tag IgG⫹patient bearing a BKV⫹PCa with BR, out of three tested. Overlaid histograms
refer to L-Tag peptide pool-stimulated cells (black line), HCMVpp65340-355-stimulated cells (dark gray line), or negative control HIV peptide pool-stimulated
cells (light gray line). (C) Proliferation index of anti-CD3/CD28-stimulated CD4⫹CD25⫺T cells from one representative L-Tag IgG⫹patient bearing a BKV⫹ PCa with BR, out of three tested, cocultured with autologous L-Tag peptide pool (circles) or HCMVpp65340-355induced IL-10-secreting CD4⫹CD25⫹
(high)
CD127⫺T cells (squares) or cultured alone (triangles) over 8 days. WST-1(OD450)values were plotted against days of incubation in cocultures performed at a 0.5:1
ratio. (D) Means⫾standard errors of the proliferation index of anti-CD3/CD28 stimulated CD4⫹CD25⫺T cells from the three IgG⫹patients with BR⫹/BKV⫹ PCa tested, cocultured as described above.
on November 7, 2019 by guest
http://jvi.asm.org/
[image:9.585.100.486.63.318.2]similarly induce an IFN-
␥
gene expression significantly higher
than that of IL-10 gene. Therefore, the skewed responsiveness to
BKV L-Tag cannot be merely attributed to a physiological decline
in immune fitness, which frequently occurs in elderly individuals.
Taken together, these data suggest that the analysis of systemic
BKV seroprevalence, as determined by IgG activity against viral
capsid proteins, fails to support an association between BKV
in-fection and PCa (
38
). Instead, humoral and, most of all, cellular
responsiveness to BKV L-Tag skewed toward an
immunoregula-tory gene expression profile and characterized by a high IL-10/
IFN-
␥
gene expression ratio, appears to be associated with PCa.
Most conspicuously, this pattern of responsiveness is typically
de-tectable in cells from patients with recurrent PCa.
Interestingly, recent data indicate that PBMC from patients
with MCC might fail to produce IFN-
␥
in response to specific
L-Tag peptides (
28
). In this case as well, infection by MCV was
found to induce L-Tag-specific humoral responses
predomi-nantly in cancer patients. However, L-Tag-stimulated IL-10
pro-duction was not explored.
It is tempting to speculate that the skewed cytokine gene
ex-pression signature typically detectable upon L-Tag peptide
stim-ulation could be due to immunoregulatory activities of cells
pref-erentially secreting IL-10. However, whereas IFN-
␥
is only
produced by T and NK cells, IL-10 can be produced by several cell
types, including tumor cells (
10
,
21
), virus-infected cells (
9
),
dif-ferent types of activated antigen-presenting cells, and T cells.
We found similar numbers of circulating cells expressing
clas-sical CD4
⫹CD25
⫹(high)FoxP3
⫹Treg phenotype in patients with
PCa or BPH, irrespective of their BR and L-Tag molecular status.
However, our data indicate that
in vitro
stimulation of PBMC
from patients with recurrent BKV
⫹PCa, but not from patients
with BKV
⫹PCa and no BR evidence or from patients with BKV
⫹BPH, results in the significant expansion of cells characterized by
a typical Treg phenotype. These lymphocytes uniformly express
IL-10, detectable by intracellular staining, which is consistent with
a predominant role in the elicitation of the skewed cytokine gene
expression profile induced by BKV L-Tag in PBMC from patients
bearing BKV
⫹PCa. Admittedly, the sole expression and/or release
of IL-10 does not represent a reliable signature for regulatory T cell
involvement (
44
) since it can also be induced in effector cells to
reduce inflammation at the site of acute viral infections (
49
).
However, the detection of this cytokine in combination with both
TGF-

1 and permanent FoxP3 expression is usually associated
with regulatory functions (
2
,
52
). Most importantly,
L-Tag-in-duced CD4
⫹CD25
⫹(high)FoxP3
⫹CD103
⫹T cells also display a
remarkable capacity to inhibit the proliferation of autologous
anti-CD3/CD28-stimulated CD4
⫹CD25
⫺lymphocytes
com-pared to HCMVpp65-stimulated CD4
⫹CD25
⫹(high)FoxP3
⫹CD103
⫹/⫺T cells, in accordance with recently published reports
(
46
,
56
). Collectively, these data hint at mechanisms potentially
underlying our findings in
ex vivo
-activated PBMC.
Immunoregulatory activities driven by viral antigens and
pro-moting the establishment of chronic infections have already been
described (
18
,
20
). These functions can be elicited by recruiting
either CD4
⫹or CD8
⫹Treg cells, depending on the type of
infec-tion (
30
). The involvement of both Treg subsets is dictated by
HLA-restricted virus-specific stimulation taking place at the site
of infection and presupposes both the expression of viral antigens
and of Treg cell-derived cytokines, such as IL-10 and TGF-

1 (
18
,
30
,
31
). Moreover, circulating tumor-associated antigen-specific
T cells with a regulatory phenotype [CD25
⫹(high)FoxP3
⫹] and the
ability of secreting IL-10 and exerting suppressive functions have
also been described in metastatic melanoma patients (
51
).
Still unclear is the molecular background preferentially
favor-ing the expansion of these cells in patients bearfavor-ing BKV
⫹PCa. It is
relevant, however, that prostate tissues appear to be characterized
by features consistent with an immunosuppressive
microenviron-ment. Infiltrating CD4
⫹and CD8
⫹T lymphocytes are
predomi-nantly characterized by regulatory (
32
,
36
) and functionally
ex-hausted (PD-1
⫹, B7-H1
⫹) (
8
,
17
,
47
) phenotypes. Furthermore,
enhanced suppressive function of adaptive CD4
⫹Treg cells has
been observed in the peripheral blood of patients with PCa and
found to correlate with metastatic behavior (
55
).
We previously showed that indoleamine-2,3-deoxygenase
(IDO) gene is frequently expressed at high levels in PCa (
19
). The
specific gene product plays a key role in tryptophan metabolism,
and its enhanced activities might result in both the depletion of an
amino acid essential for lymphocyte metabolism and the
genera-tion of toxic metabolites (
53
). In addition, arginase production by
macrophages infiltrating prostatic tissues has been shown to favor
the induction of anergy in resident lymphocytes (
8
). Therefore, in
patients bearing a BKV
⫹PCa, presentation of L-Tag to T cells
might occur in conditions likely favoring the generation of
im-mune responses characterized by a high IL-10/IFN-
␥
gene
expres-sion ratio.
Most obviously, our data do not allow the postulation of any
causal relationship between features of L-Tag-specific immune
responses, BKV infection, and cancer. Nevertheless, they suggest
the existence of a complex interaction of potential clinical
rele-vance.
Our study has a major limitation, however. Although it
capi-talizes on the analysis of specific immune responses in a
substan-tial number of patients, the number of informative cases, e.g.,
patients bearing BKV
⫹lesions with or without BR, is relatively
modest. Therefore, additional investigations confirming these
re-sults in a larger number of cases are obviously warranted.
In conclusion, our data provide important novel contributions
to the analysis of the increasingly puzzling relationship between
BKV infection and PCa by identifying subpopulations of patients
deserving major attention in translational research and, most
im-portantly, by highlighting subtle peculiarities of immune
re-sponses against BKV L-Tag in patients with PCa, with previously
unsuspected associations with the clinical course of this disease.
ACKNOWLEDGMENTS
This study was partially supported by the Foundation for Research at the Medical Faculty, University of Zurich (grant to G.S.), and the Swiss Na-tional Science Foundation (grant 320000-122429/1 to M.P. and grant 320030-120320 to G.C.S.).
We thank Gaetano Mauro for helping us in statistical data analysis and Damina Balmer for her critical comments.
REFERENCES
1.Abend JR, Jiang M, Imperiale MJ.2009. BK virus and human cancer: innocent until proven guilty. Semin. Cancer Biol.19:252–260.
2.Baecher-Allan C, Viglietta V, Hafler DA.2004. Human CD4⫹CD25⫹ regulatory T cells. Semin. Immunol.16:89 –98.
3.Balis V, et al.2007. Prevalence of BK virus and human papillomavirus in human prostate cancer. Int. J. Biol. Markers22:245–251.
4.Bargonetti J, Reynisdottir I, Friedman PN, Prives C.1992. Site-specific binding of wild-type p53 to cellular DNA is inhibited by SV40 T antigen and mutant p53. Genes Dev.6:1886 –1898.
on November 7, 2019 by guest
http://jvi.asm.org/
5.Bergh J, et al.2007. No link between viral findings in the prostate and subsequent cancer development. Br. J. Cancer96:137–139.
6.Bocchetta M, et al.2008. The SV40 large T antigen-p53 complexes bind and activate the insulin-like growth factor-I promoter stimulating cell growth. Cancer Res.68:1022–1029.
7.Bodaghi S, et al.2009. Antibody responses to recombinant polyomavirus BK large T and VP1 proteins in young kidney transplant patients. J. Clin. Microbiol.47:2577–2585.
8.Bronte V, et al.2005. Boosting antitumor responses of T lymphocytes infiltrating human prostate cancers. J. Exp. Med.201:1257–1268. 9.Burdin N, Peronne C, Banchereau J, Rousset F.1993. Epstein-Barr virus
transformation induces B lymphocytes to produce human interleukin 10. J. Exp. Med.177:295–304.
10. Chen Q, Daniel V, Maher DW, Hersey P.1994. Production of IL-10 by melanoma cells: examination of its role in immunosuppression mediated by melanoma. Int. J. Cancer56:755–760.
11. Currier JR, et al.2002. A panel of MHC class I restricted viral peptides for use as a quality control for vaccine trial ELISPOT assays. J. Immunol. Methods260:157–172.
12. Das D, Shah RB, Imperiale MJ.2004. Detection and expression of human BK virus sequences in neoplastic prostate tissues. Oncogene23:7031– 7046.
13. Das D, Wojno K, Imperiale MJ.2008. BK virus as a cofactor in the etiology of prostate cancer in its early stages. J. Virol.82:2705–2714. 14. De Marzo AM, Marchi VL, Epstein JI, Nelson WG.1999. Proliferative
inflammatory atrophy of the prostate: implications for prostatic carcino-genesis. Am. J. Pathol.155:1985–1992.
15. De Marzo AM, et al.2007. Inflammation in prostate carcinogenesis. Nat. Rev. Cancer7:256 –269.
16. Dong JT.2006. Prevalent mutations in prostate cancer. J. Cell Biochem.
97:433– 447.
17. Ebelt K, et al.2009. Prostate cancer lesions are surrounded by FOXP3⫹, PD-1⫹, and B7-H1⫹lymphocyte clusters. Eur. J. Cancer45:1664 –1672. 18. Ebinuma H, et al.2008. Identification and in vitro expansion of
func-tional antigen-specific CD25⫹FoxP3⫹regulatory T cells in hepatitis C virus infection. J. Virol.82:5043–5053.
19. Feder-Mengus C, et al.2008. High expression of indoleamine 2,3-dioxygenase gene in prostate cancer. Eur. J. Cancer44:2266 –2275. 20. Garba ML, Pilcher CD, Bingham AL, Eron J, Frelinger JA.2002. HIV
antigens can induce TGF-beta(1)-producing immunoregulatory CD8⫹T cells. J. Immunol.168:2247–2254.
21. Gastl GA, et al.1993. Interleukin-10 production by human carcinoma cell lines and its relationship to interleukin-6 expression. Int. J. Cancer
55:96 –101.
22. Gosert R, et al.2008. Polyomavirus BK with rearranged noncoding con-trol region emerge in vivo in renal transplant patients and increase viral replication and cytopathology. J. Exp. Med.205:841– 852.
23. Gretzer MB, Trock BJ, Han M, Walsh PC.2002. A critical analysis of the interpretation of biochemical failure in surgically treated patients using the American Society for Therapeutic Radiation and Oncology criteria. J. Urol.168:1419 –1422.
24. Hanahan D, Weinberg RA.2011. Hallmarks of cancer: the next genera-tion. Cell144:646 – 674.
25. Hoffman NG, Cook L, Atienza EE, Limaye AP, Jerome KR. 2008. Marked variability of BK virus load measurement using quantitative real-time PCR among commonly used assays. J. Clin. Microbiol.46:2671– 2680.
26. Imperiale MJ.2000. The human polyomaviruses, BKV and JCV: molec-ular pathogenesis of acute disease and potential role in cancer. Virology
267:1–7.
27. Imperiale MJ.2001. Oncogenic transformation by the human polyoma-viruses. Oncogene20:7917–7923.
28. Iyer JG, et al.2011. Merkel cell polyomavirus-specific CD8 and CD4 T-cell responses identified in Merkel cell carcinomas and blood. Clin. Cancer Res.17:6671– 6680.
29. Jemal A, et al.2011. Global cancer statistics. CA Cancer J. Clin.61:69 –90. 30. Joosten SA, Ottenhoff TH.2008. Human CD4 and CD8 regulatory T cells
in infectious diseases and vaccination. Hum. Immunol.69:760 –770. 31. Karlsson I, et al.2007. FoxP3⫹CD25⫹CD8⫹T-cell induction during
primary simian immunodeficiency virus infection in cynomolgus ma-caques correlates with low CD4⫹T-cell activation and high viral load. J. Virol.81:13444 –13455.
32. Kiniwa Y, et al.2007. CD8⫹Foxp3⫹regulatory T cells mediate immu-nosuppression in prostate cancer. Clin. Cancer Res.13:6947– 6958. 33. Leuenberger D, et al.2007. Human polyomavirus type 1 (BK virus)
agnoprotein is abundantly expressed but immunologically ignored. Clin. Vaccine Immunol.14:959 –968.
34. Livak KJ, Schmittgen TD.2001. Analysis of relative gene expression data using real-time quantitative PCR and the 2⫺⌬⌬CTmethod. Methods25:
402– 408.
35. Mellor AL, Munn DH.2011. Physiologic control of the functional status of Foxp3⫹regulatory T cells. J. Immunol.186:4535– 4540.
36. Miller AM, et al.2006. CD4⫹CD25highT cells are enriched in the tumor
and peripheral blood of prostate cancer patients. J. Immunol.177:7398 – 7405.
37. Monini P, et al.1995. DNA rearrangements impairing BK virus produc-tive infection in urinary tract tumors. Virology214:273–279.
38. Paulson KG, et al.2010. Antibodies to Merkel cell polyomavirus T anti-gen oncoproteins reflect tumor burden in Merkel cell carcinoma patients. Cancer Res.70:8388 – 8397.
39. Provenzano M, et al.2006. Characterization of highly frequent epitope-specific CD45RA⫹/CCR7⫹/⫺ T lymphocyte responses against
p53-binding domains of the human polyomavirus BK large tumor antigen in HLA-A*0201⫹BKV-seropositive donors. J. Transl. Med.4:47.
40. Provenzano M, et al.2006. MHC-peptide specificity and T-cell epitope mapping: where immunotherapy starts. Trends Mol. Med.12:465– 472. 41. Provenzano M, et al.2009. A HCMV pp65 polypeptide promotes the
expansion of CD4⫹and CD8⫹T cells across a wide range of HLA speci-ficities. J. Cell Mol. Med.13:2131–2147.
42. Putzi MJ, De Marzo AM.2000. Morphologic transitions between prolif-erative inflammatory atrophy and high-grade prostatic intraepithelial neoplasia. Urology56:828 – 832.
43. Randhawa PS, et al.2002. Quantitation of viral DNA in renal allograft tissue from patients with BK virus nephropathy. Transplantation74:485– 488.
44. Roncarolo MG, Bacchetta R, Bordignon C, Narula S, Levings MK.2001. Type 1 T regulatory cells. Immunol. Rev.182:68 –79.
45. Rubinstein R, Schoonakker BC, Harley EH.1991. Recurring theme of changes in the transcriptional control region of BK virus during adapta-tion to cell culture. J. Virol.65:1600 –1604.
46. Schwele S, et al.2012. Cytomegalovirus-specific regulatory and effector T cells share TCR clonality-possible relation to repetitive CMV infections. Am. J. Transplant.12:669 – 681.
47. Sfanos KS, et al.2009. Human prostate-infiltrating CD8⫹T lymphocytes are oligoclonal and PD-1⫹. Prostate69:1694 –1703.
48. Stockis J, Colau D, Coulie PG, Lucas S.2009. Membrane protein GARP is a receptor for latent TGF-beta on the surface of activated human Treg. Eur. J. Immunol.39:3315–3322.
49. Sun J, Dodd H, Moser EK, Sharma R, Braciale TJ.2011. CD4⫹T cell help and innate-derived IL-27 induce Blimp-1-dependent IL-10 produc-tion by antiviral CTLs. Nat. Immunol.12:327–334.
50. Touze A, et al.2011. High levels of antibodies against Merkel cell polyo-mavirus identify a subset of patients with Merkel cell carcinoma with better clinical outcome. J. Clin. Oncol.29:1612–1619.
51. Vence L, et al.2007. Circulating tumor antigen-specific regulatory T cells in patients with metastatic melanoma. Proc. Natl. Acad. Sci. U. S. A.104: 20884 –20889.
52. Viglietta V, Baecher-Allan C, Weiner HL, Hafler DA.2004. Loss of functional suppression by CD4⫹CD25⫹regulatory T cells in patients with multiple sclerosis. J. Exp. Med.199:971–979.
53. Weber WP, et al.2006. Differential effects of the tryptophan metabolite 3-hydroxyanthranilic acid on the proliferation of human CD8⫹T cells induced by TCR triggering or homeostatic cytokines. Eur. J. Immunol.
36:296 –304.
54. Weinreb DB, et al.2006. Polyoma virus infection is a prominent risk factor for bladder carcinoma in immunocompetent individuals. Diagn. Cytopathol.34:201–203.
55. Yokokawa J, et al. 2008. Enhanced functionality of CD4⫹ CD25high
FoxP3⫹regulatory T cells in the peripheral blood of patients with prostate cancer. Clin. Cancer Res.14:1032–1040.
56. Zabransky DJ, et al.2012. Phenotypic and functional properties of he-lios⫹ regulatory T cells. PLoS One 7:e34547. doi:10.1371/ journal.pone.0034547.
on November 7, 2019 by guest
http://jvi.asm.org/