Lessons from London schools for
attainment gaps and social mobility
Research report
June 2014
Ellen Greaves, Lindsey Macmillan and Luke Sibieta
Institute for Fiscal Studies and Institute of Education
Social Mobility and Child Poverty Commission
Sanctuary Buildings
20 Great Smith Street
London
SW1P 3BT
2
Contents
Table of figures and tables 4
Executive summary 6
Findings 6
Policy implications 6
Introduction 9
1. When did London’s secondary schools begin to improve? 11
2. Accounting for the improvements at GCSE 15
How do pupils in London differ from those in the rest of England? 15
Can changes in pupil characteristics explain improvements in GCSE outcomes? 18
Can improvements in GCSE outcomes be explained by prior attainment at
primary school? 20
3. Improvements in primary schools 24
4. Sustained improvements in post-16 outcomes 26
5. Why have we seen an improvement in London? 29
Pupil intake 29
Resources 30
Teachers 30
School governance 31
School competition 32
Specific policy initiatives 32
6. Conclusions and implications for the future 35
3 Prepared by:
Ellen Greaves, Institute for Fiscal Studies
Lindsey Macmillan, Institute of Education
Luke Sibieta, Institute for Fiscal Studies
Institute for Fiscal Studies
The Institute for Fiscal Studies (IFS) has is as an independent microeconomic research institute. It aims to conduct research that is both academically rigorous and relevant to policymakers.
Institute of Education
The Institute of Education is a world-leading university specialising in education and the social sciences. Part of the University of London, the Institute was ranked number one for education worldwide in the 2014 QS World University Rankings
Acknowledgements
The authors would like to thank Simon Blake, Jodie Smith and Anna Vignoles for detailed
comments and feedback on draft versions of this report, and participants from the Social Mobility and Child Poverty Commission and the Department for Education for comments and feedback at a seminar in April 2014 where the draft findings from the research were presented. The authors would also like to thank Judith Payne for copy-editting.
Prepared for:
Social Mobility and Child Poverty Commission (SMCP)
The Social Mobility and Child Poverty Commission is an advisory non-departmental public body (NDPB) of the Department for Education, the Department for Work & Pensions and the Cabinet Office.
The Commission was established with a remit to:
publish an annual report setting out progress made in improving social mobility and reducing child poverty in Great Britain;
provide published advice to ministers at their request on social mobility and child poverty; and
act as an advocate for social mobility beyond government by challenging employers, the professions and universities amongst others to play their part in improving life chances.
This research was commissioned to understand the roots of London schools’ success over the last decade in improving the results of pupils from disadvantaged backgrounds. Ensuring higher
4
Table of figures and tables
Figure 1 Percentage of pupils achieving five or more GCSEs at A*–C including English and maths
(or equivalent), by region, 2013 9
Figure 2 Percentage achieving five or more GCSEs at A*–C including English and maths (or
equivalent), by region, 2002–12 11
Figure 3 Percentage of pupils eligible for FSM who achieve five or more GCSEs at A*–C including
English and maths (or equivalent), by region, 2002–12 13
Figure 4 Percentage of pupils eligible for FSM who achieve eight or more GCSEs at A*–B
including English and maths (or equivalent), by region, 2002–12 13
Figure 5 Change in proportion of pupils eligible for FSM achieving five or more GCSEs at A*–C including English and maths (or equivalent), across local authorities, 2002–12 14
Figure 6 Average pupil characteristics for London, Birmingham, Manchester and the rest of
England: pupils in Year 11 in 2002 and 2012 15
Figure 7 Average Census characteristics for London, Birmingham, Manchester and the rest of
England, 2001 and 2011 17
Figure 8 Estimated effect of being in London or other large cities on proportion of pupils eligible for FSM achieving five or more GCSEs at A*–C including English and maths (or equivalent), 2002–
12, with and without controls (relative to rest of England) 19
Figure 9 Estimated effect of being in London or other large cities on proportion of pupils eligible for FSM achieving five or more GCSEs at A*–C including English and maths (or equivalent), 2002–
12, with controls and prior attainment (relative to rest of England) 20
Figure 10 Estimated effect of being in London or other large cities on different GCSE outcomes for pupils eligible for FSM, with different sets of controls, 2012 (relative to rest of England) 21 (a) Five or more GCSEs or their equivalent at A*–C (including English and maths) 21 (b) Eight or more GCSEs or their equivalent at A*–B (including English and maths) 21 (c) Average standardised capped points score at GCSE (including equivalents) 21
Figure 11(a) Estimated effect of being in London or other large cities on average standardised KS2 maths fine points score amongst pupils eligible for FSM, by year in which pupils took or will
take GCSEs, 2002–18, with controls (relative to rest of England) 24
Figure 11(b) Estimated effect of being in London or other large cities on average standardised KS2 English fine points score amongst pupils eligible for FSM, by year in which pupils took or will
take GCSEs, 2002–18, with controls (relative to rest of England) 24
5
Figure 13 Estimated effect of being in London or other large cities on participation at KS5 for pupils eligible for FSM, 2002–10, with controls and prior attainment (relative to rest of England) 27
6
Executive summary
Findings
Disadvantaged pupils1 perform better in Inner London than in other regions and have pulled
even further ahead over the past decade, something that has often been referred to as the ‘London effect’. This is not unique to London, however: there have also been smaller improvements in other large cities across England, such as Birmingham and Manchester.
What explains these changes? The mix of pupils in Inner London and other large cities is very different from the mix in the rest of England, with higher levels of deprivation and a greater number of pupils from ethnic minority backgrounds. Some of the higher level and improvement in results over time for disadvantaged pupils in London and other big cities can be explained by these differences. However, demographics alone do not explain all of the ‘London effect’. For example, disadvantaged pupils in inner London are 21 percentage points more likely to achieve 5 or more GCSEs at A*-C (including English and Maths) compared with elsewhere in the country, which falls to 17 percentage points after controlling for pupil demographics.
We show that the higher level of achievement at Key Stage 4 (at the end of secondary school) and the improvement in results for disadvantaged pupils in London and other big cities can be mostly explained by differences in prior attainment at Key Stage 2 (at the end of primary school). The gap between inner London and the rest of England in terms of disadvantaged pupils achieving 5 or more GCSEs at A*-C falls by 11 percentage points (to 6 percentage points) after controlling for prior attainment. Furthermore, an even larger amount of the gap in results across higher GCSE outcomes (such as those achieving 8 or more A*-B) can be explained by prior attainment.
After controlling for prior attainment, the gap between inner London FSM results and those in the rest of England is a lot smaller and is quite static over time across a range of GCSE outcomes. The same is true of Manchester and Birmingham. This suggests that the big improvement over the last decade in FSM results in London and other big cities is unlikely to have been driven by secondary schools, as was previously thought. Instead, the roots are likely to lie in primary schools.
Disadvantaged pupils in London, Manchester and Birmingham all perform significantly better at Key Stage 2 in both English and maths than in other areas of England, with the highest level of performance for pupils in Inner London.
There was a substantial improvement in Key Stage 2 English scores for disadvantaged pupils in London between 1999 and 2003, which is a key reason why Key Stage 4 results in London subsequently improved between 2004 and 2008. Key Stage 2 Maths results have remained consistently higher for London compared with the rest of the country over time. Higher maths results can thus explain some of why pupils in London do better, on average, but not why results have improved so much over time.
1 Throughout, when we use the term ‘disadvantaged’ pupils, we are referring to those pupils who are eligible for free
7
The ‘London effect’ is sustained into post-16 outcomes: disadvantaged pupils in London are
more likely to continue into Key Stage 5 after accounting for differences in pupil and school characteristics, and even after accounting for their higher performance at Key Stage 4.
In Manchester and Birmingham, by contrast, better Key Stage 4 results than for disadvantaged pupils elsewhere in England are not sustained into Key Stage 5 participation. This contrast could reflect the fact that disadvantaged pupils in London perform better according to measures of high GCSE attainment than those in Manchester and Birmingham.
What caused the improvement in Key Stage 2 test scores that led to the ‘London effect’ at Key Stage 4 is not clear. However, the explanation will be related to changes in London’s primary schools in the late 1990s and early 2000s. This means that programmes and initiatives such as the London Challenge, the Academies Programme, Teach First or differences in resources are unlikely to be the major explanation (as these changes either happened too late, were focused on secondary schools or were longstanding, and therefore are unlikely to account for the rapid improvements we see).
We note that the improvement in Key Stage 2 English scores at age 11 occurred almost exactly at the same time as the National Literacy and Numeracy Strategies were rolled out, and London local authorities made up many of the pilot areas for these programmes. More research is needed to understand whether these programmes were an important source of London’s improvement and, if so, why this was not repeated across the country when the programmes were rolled out nationally.
Policy implications
There are three key lessons for policymakers in seeking to narrow the achievement gaps between more and less disadvantaged pupils across the rest of England:
First, the power of early achievement in primary schools is evident, particularly in terms of English scores: one of the major reasons why disadvantaged pupils in London and other big cities perform better at Key Stage 4 is that they had higher levels of achievement at Key Stage 2. This is consistent with a case for early intervention. Equally, however, we should not completely discount the role of secondary schools in sustaining achievements into GCSE and post-16 outcomes. Whilst the ‘London effect’ is translated into higher levels of participation in Key Stage 5, higher GCSE results in Manchester and Birmingham do not translate into higher levels of Key Stage 5 participation. This suggests that whilst a focus on primary schools is important in ensuring that disadvantaged students are equipped with the necessary skills to reach attainment benchmarks at the end of compulsory schooling, secondary schools have a role to keep those students on track to ensure they achieve the higher levels necessary to access Key Stage 5 and further study.
8
Third, given that achievements take a long time to become visible, we need to attribute
9
Introduction
Successive governments have sought to narrow the achievement gap between pupils from advantaged and disadvantaged backgrounds, as part of wider efforts to improve social mobility. For future policy to be most effective, it is important to learn from successful examples of where the achievement gap has been narrowed. The improvement in London schools over the past decade stands out as an important example of improvement in academic achievement, and most crucially as a narrowing of the achievement gap (as has been documented in work by Centre Forum, the all-party parliamentary group on social mobility and numerous articles by Chris Cook in the Financial Times2).
[image:9.595.49.541.444.661.2]Figure 1 illustrates the narrower achievement gap in London than in the rest of England. For each region, it shows the proportion of pupils eligible for free school meals (FSM) who achieved five or more GCSEs or their equivalent at A*–C (including English and maths) in 2013, as well as the proportion not eligible for FSM who achieved the same standard. We focus on this measure of GCSE performance as it represents the culmination of compulsory schooling and is often a condition for being accepted into Level 3 qualifications at Key Stage 5. It is also an important benchmark for employers, is frequently focused on by commentators and has been a major marker of performance in school league tables (until recently). We also examine performance across other GCSE outcomes later in the report to confirm that trends we observe are not unique to a single measure.
Figure 1 Percentage of pupils achieving five or more GCSEs at A*–C including English and maths (or equivalent), by region, 2013
Source: Department for Education, GCSE and equivalent results in England, 2013.
2 Wyness (2011); All-Party Parliamentary Group on Social Mobility (2013); Cook (2013).
20 25 30 35 40 45 50 55 60 65 70
London West MidlandsNorth WestNorth EastEast MidlandsEast of EnglandYorkshire and the HumberSouth WestSouth East England
Per
cen
tag
e
ach
iev
in
g
5+
G
C
SE
s
A
*–
C
inc
ludi
ng
Engl
is
h
&
m
at
hs
10
As can be seen, attainment gaps by FSM exist across all regions of England. However, they are much narrower in London and this is principally because poorer pupils in London achieve higher GCSE results than poorer pupils in other regions of England. For example, around 50% of poorer pupils in London achieved this benchmark in 2013, compared with just 30% in the rest of the south-east of England.
The key question for policymakers interested in narrowing the achievement gap is whether the ‘London effect’ can be replicated across the rest of the country. In order to answer this question, we must understand, first, when the performance of disadvantaged pupils in London improved and, second, why this might have happened.
We will examine the following in turn:
1. When London’s secondary schools began to improve, by showing the average Key Stage 4 performance of different areas of the country over time.
2. The extent to which the improvements we see in London and other big cities can be explained by changes in pupil characteristics, such as the composition of pupils and families. We also examine whether improvements at Key Stage 4 can be explained by differences in prior attainment at Key Stage 2.
3. The performance of disadvantaged pupils at Key Stage 2 in English and maths to see if and when, and in what subjects, disadvantaged pupils in London began to improve relative to the rest of the country.
4. Whether improvements at Key Stage 4 are sustained into Key Stage 5 and whether differences in post-16 outcomes are influenced by Key Stage 4 attainment.
5. Why London’s schools might have improved by considering the plausibility of different explanations.
11
1. When did London’s secondary schools begin to improve?
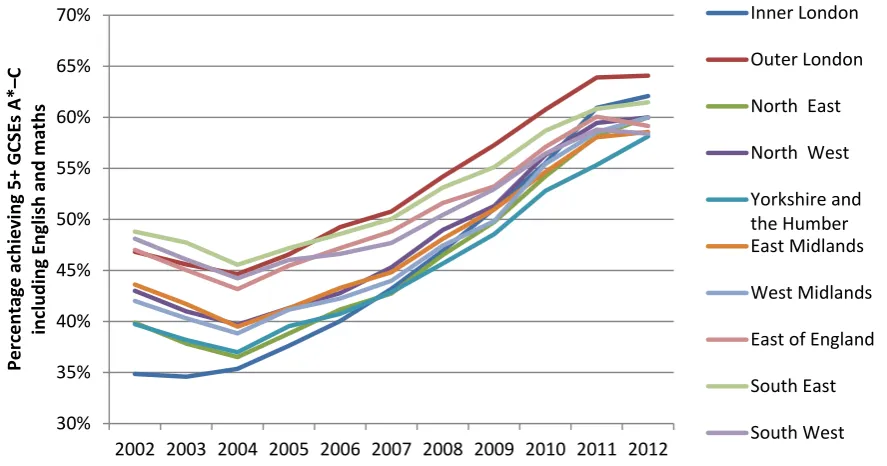
The average performance of schools in London at GCSE has significantly improved over the last decade, particularly in Inner London.3 As Figure 2 shows, the proportion of all pupils in InnerLondon achieving five or more GCSEs or their equivalent at A*–C (including English and maths) was lower than in any other region of England in 2002. The proportion achieving this benchmark grew in every region over the last decade. However, the growth in performance is clearly highest in Inner London. As a result, Inner London had the second-highest GCSE results across regions by 2012. The only region with higher results was Outer London, where results have been
[image:11.595.42.486.264.497.2]consistently high over the past decade.
Figure 2 Percentage achieving five or more GCSEs at A*–C including English and maths (or equivalent), by region, 2002–12
Source: Authors’ calculations using National Pupil Database 2002–12.
A large part of the improvement in GCSE performance across the country has been attributed to the increased take-up of GCSE-equivalent qualifications.4 These are qualifications such as
vocationally related qualifications, BTECs and NVQ Levels that counted towards school
performance on national league tables. Some of these qualifications may be of limited economic value in the labour market.5 The greater improvement in performance in areas that appear to have pulled away could therefore be the result of greater take-up of GCSE equivalents rather than improvements in pupil learning. However, analysis later suggests that this appears not to have
3 We use the statistical definition of Inner London, which includes the following local authorities: Camden; City of
London; Hackney; Hammersmith and Fulham; Haringey; Islington; Kensington and Chelsea; Lambeth; Lewisham; Newham; Southwark; Tower Hamlets; Wandsworth; and Westminster. Outer London refers to all other local authorities in the Greater London area.
4 Wolf (2011).
5 Wolf (2011).
30% 35% 40% 45% 50% 55% 60% 65% 70%
2002 2003 2004 2005 2006 2007 2008 2009 2010 2011 2012
Per cen ta ge ac hi evi ng 5 + G CSE s A *– C inc ludi ng E ng lish and m at hs Inner London Outer London
North East
North West
Yorkshire and the Humber East Midlands
West Midlands
East of England
South East
12
been the case in Inner London: improvements are seen across a range of GCSE outcomes. The higher performance of pupils in Inner London also translates into higher levels of participation at Key Stage 5, which does suggest some real improvement. However, the same cannot be said of Manchester and Birmingham. In later analysis, we observe higher levels of attainment at GCSE amongst disadvantaged pupils in these cities than in the rest of England, but this is not translated into higher participation or attainment at Key Stage 5.
The Introduction showed that the achievement gap between rich and poor is much narrower in London than in the rest of England, primarily because children from deprived backgrounds perform better. We therefore focus on the educational performance of children from deprived backgrounds, as attainment during their compulsory schooling is likely to be a significant determinant of their later life chances and therefore likely to be a suitable target for efforts to improve upward social mobility.
Our main measure of disadvantage is whether pupils are eligible for free school meals (FSM).6 This is not an ideal measure of deprivation – not all pupils eligible for FSM are registered as such, it is a binary indicator (and so does not measure extreme deprivation and affluence) and there could be differences in the average levels of deprivation experienced by both those eligible and those not eligible for FSM across areas (for example, the composition of the FSM group in London could be very different from that in the rest of the country, as could be the composition of the non-FSM group). Indeed, as we will see in the next section, the proportion of students eligible for non-FSM is larger in Inner London than elsewhere but similar to that in other large cities such as
Manchester and Birmingham. However, FSM eligibility is the only measure of individual
deprivation available in the National Pupil Database. Area-level measures of deprivation (such as the Income Deprivation Affecting Children Index, IDACI7) would be relatively poor measures of
deprivation in London as there can be very large differences in deprivation within small
geographical areas in cities. We therefore focus on the absolute performance of pupils eligible for FSM, rather than on the gap with non-FSM pupils, thereby avoiding any results being directly driven by differences between the FSM and the non-FSM populations.
With these caveats in mind, Figure 3 shows that the average performance of disadvantaged pupils was higher in Inner London than in any other region, even in 2002, closely followed by Outer London. Since then, the performance of such pupils in Inner London has improved even further relative to outside London. By 2012, 54% of pupils eligible for FSM in Inner London achieved five or more GCSEs (or their equivalent) at A*–C, compared with 40% of pupils eligible for FSM in the West Midlands (the region outside London showing the next-best results) and 30–35% of pupils eligible for FSM in other regions outside London.
The picture looks even more dramatic if we look at a measure of high performance at GCSE (achieving eight or more GCSEs at A*–B or their equivalent, including English and maths), as is shown in Figure 4. Pupils in London (and Inner London in particular) are much more likely to achieve this standard than pupils outside London, and the difference has increased over time. By
6 Throughout, when we use the term ‘disadvantaged’ pupils, we are referring to those pupils who are eligible for free
school meals (FSM).
13
[image:13.595.43.486.150.373.2]2012, nearly 13% of disadvantaged pupils in Inner London achieved this higher benchmark, compared with less than 6% of disadvantaged pupils outside London. By way of comparison, about 26% of pupils who were not eligible for FSM achieved this benchmark in London as a whole in 2012, compared with about 21% of pupils outside of London.8
Figure 3 Percentage of pupils eligible for FSM who achieve five or more GCSEs at A*–C including English and maths (or equivalent), by region, 2002–12
Source: Authors’ calculations using National Pupil Database 2002–12.
Figure 4 Percentage of pupils eligible for FSM who achieve eight or more GCSEs at A*–B including English and maths (or equivalent), by region, 2002–12
Source: Authors’ calculations using National Pupil Database 2002–12.
8 Authors’ calculations using National Pupil Database 2012.
0% 10% 20% 30% 40% 50% 60%
2002 2003 2004 2005 2006 2007 2008 2009 2010 2011 2012
Per cen ta ge ac hi evi ng 5 + G CSE s A *– C (inc ludi ng E ng lish and m at hs) Inner London Outer London
North East
North West
Yorkshire and the Humber East Midlands
West Midlands
East of England
South East South West 0% 2% 4% 6% 8% 10% 12% 14%
2002 2003 2004 2005 2006 2007 2008 2009 2010 2011 2012
Per cen ta ge ac hi evi ng 8 + G CSE s A *– B (inc ludi ng E ng lish and m at hs) Inner London Outer London
North East
North West
Yorkshire and the Humber East Midlands
West Midlands
East of England
South East
[image:13.595.42.483.454.676.2]14
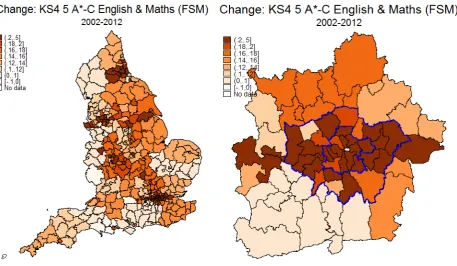
Figure 5 shows which local authorities have seen the fastest improvements in results for disadvantaged pupils. It shows that the Inner London local authorities achieving the fastest improvements were concentrated in south and east Inner London, such as Tower Hamlets, Southwark and Lambeth. However, if we look across the rest of England, we also see rapid
[image:14.595.49.507.212.478.2]improvements in other large cities, such as Birmingham and Manchester, as well as in areas of the North East. There have also been improvements in other large cities, such as Bristol, Leeds and Sheffield, but not such large ones. For this reason, and for the sake of brevity, we have chosen to focus on London, Manchester and Birmingham in the rest of this report.
Figure 5 Change in proportion of pupils eligible for FSM achieving five or more GCSEs at A*–C including English and maths (or equivalent), across local authorities, 2002–12
Source: Authors’ calculations using National Pupil Database 2002–12.
The data appendix contains further analysis of the trends in attainment over time among FSM-eligible pupils. It shows that there are similar patterns across local authorities in terms of the proportion of pupils achieving eight or more GCSEs at A*–B or equivalent (Figure A1). The data appendix also shows that local authorities in Inner London have lower levels of variation in GCSE scores (based on the interquartile range of GCSE standardised points score, as seen in Figure A2). This indicates that there is less educational inequality in Inner London for deprived students within local authorities.
Summary
Average GCSE performance in London has improved over the past decade, particularly in Inner London.
Disadvantaged pupils performed better in Inner London than in other regions a decade ago and have pulled even further ahead over the past decade.
15
2. Accounting for the improvements at GCSE
[image:15.595.51.456.272.589.2]How do pupils in London differ from those in the rest of England?
Differences in the characteristics of pupils in London compared with the rest of England may be one potential explanation for why pupils in London, and disadvantaged pupils in particular, perform better than those in other areas of England. Changes in these characteristics over time could also explain the improvement in results shown in the previous section. Figure 6 shows the differences in some key pupil characteristics across Inner London, Outer London, Birmingham, Manchester9 and the rest of England (for both 2002 and 2012).Figure 6 Average pupil characteristics for London, Birmingham, Manchester and the rest of England: pupils in Year 11 in 2002 and 2012
Note: ‘FSM’ stands for eligible for free school meals. ‘Non-white’ stands for pupils not recorded as white British. ‘EAL’ stands for English recorded as an additional language in the home.
Source: Authors’ calculations using National Pupil Database 2002 and 2012.
Clearly, a greater proportion of pupils in Inner London are from deprived backgrounds, with over 35% of pupils eligible for FSM compared with around 10% of pupils in the rest of England
(excluding Outer London, Birmingham and Manchester). The Inner London rate is not dissimilar from the proportion eligible for FSM in Manchester or Birmingham and there has not been much change over time across any of these cities, with only a slight reduction in the proportion eligible
9 Here and elsewhere, Manchester refers to the city of Manchester and not to the Greater Manchester area.
0% 20% 40% 60% 80% 100%
FSM Inner London Outer London Birmingham Manchester Rest of England Non-White Inner London Outer London Birmingham Manchester Rest of England EAL Inner London Outer London Birmingham Manchester Rest of England
Percentage of pupils
2002 2012
FSM
16
for FSM. On this measure, Outer London is less deprived than Inner London, Birmingham or Manchester, but more deprived than the rest of England.
There are more substantial differences between Inner London and the rest of the country in the ethnic mix of pupils. Over 80% of all pupils in Inner London were from non-white backgrounds in 2012, compared with 14% in the rest of England, and the proportion from non-white backgrounds in Inner London has very clearly grown over time (non-white here refers to pupils not recorded as white British10). Birmingham, Manchester and Outer London also have relatively high proportions of pupils from non-white backgrounds (about 50-60% of pupils in 2012), but not as high as Inner London. The proportion of pupils from non-white backgrounds has also grown over time across Outer London, Birmingham and Manchester.
The large differences in the ethnic mix between areas are important and could explain some of the differences and changes in attainment. Previous research has suggested a high level of variation in the performance of different ethnic minorities, with children from all ethnic minority backgrounds making more progress than white British pupils up to Key Stage 4 (KS4) assessments.11 Ongoing
work by Simon Burgess examines in more detail the role of ethnic differences in explaining the ‘London effect’ at KS4 and in progress measures from KS2 to KS4. Our analysis of the National Pupil Database shows that when focusing on the ethnic mix amongst FSM-eligible pupils across areas, a greater proportion of FSM-eligible pupils in Inner London come from ethnic minority backgrounds than in other parts of the country and this heterogeneity in ethnicity has increased as the proportion of non-white British has increased over the last decade (see Figure A3 in the data appendix). It will therefore be important to account for the ethnic background of pupils in a detailed way when seeking to explain differences in attainment amongst disadvantaged pupils across England. Nevertheless, as our later analysis shows, improvements in the performance of FSM-eligible pupils in London and other big cities remain after we control for pupil characteristics, suggesting that pupils of the same broad ethnic groups perform better in London than in other areas of the country. This is consistent with previous analysis by others showing that pupils from white backgrounds who are also eligible for FSM perform better in London than in the rest of the country.12
The pattern across areas is similar for the proportion of pupils having English as an additional language (EAL), with over half of pupils in Inner London recorded as having EAL in 2012
compared with about 30–40% in Outer London, Birmingham and Manchester, and about 7% in the rest of England. The proportion of pupils with EAL has also very clearly grown over time across London, Birmingham and Manchester. This is important as those with EAL may represent relatively recent immigrants, who may have different characteristics from people of ethnic minorities who have been in the UK for much longer and speak English as a first language.
Figure 7 compares additional characteristics of these populations and shows how they differ by area (using data from the two most recent Censuses). The populations of Inner and Outer London
10 Pupils from other white backgrounds represented just over 10% of all pupils in Inner London in 2012, compared with
just over 3% in the rest of England.
11 Wilson et al. (2011).
17
are more likely to have an occupation classified as higher professional than populations elsewhere in England (including Birmingham and Manchester), are more likely to have a high level of
education and are more likely to be newly resident in the UK. These differences could be important drivers of pupil attainment, with evidence suggesting that parental education and parental occupation have strong effects on pupil attainment,13 and recent immigrants may well
[image:17.595.49.534.241.560.2]have different outcomes from those of more established ethnic minorities. However, these patterns have not changed dramatically across regions between the two Census years, as there has been growth in the prevalence of these characteristics in all areas, suggesting that these differences are unlikely to explain the improvement in the performance of disadvantaged pupils over time.
Figure 7 Average Census characteristics for London, Birmingham, Manchester and the rest of England, 2001 and 2011
Note: ‘High prof. occ.’ stands for a higher professional occupation, defined according to the NS-SEC. ‘Highly educated’ stands for those with a Level 4 qualification or higher. ‘New to UK’ stands for having lived outside the UK one year ago for the 2001 Census and two years ago for the 2011 Census; these figures are therefore not directly comparable over time.
Source: Authors’ calculations using average figures from the Census, downloaded from http://www.nomisweb.co.uk/.
Summary
Inner London is more deprived than the rest of England and than Outer London, but has a similar level of deprivation to Manchester or Birmingham.
A much larger proportion of pupils in Inner London come from non-white backgrounds than in the rest of England, and this proportion has grown over time. Disadvantaged pupils in
13 Goodman and Gregg (2010).
0 5 10 15 20 25 30 35 40 45 50
Highly educated High prof. occ. p_high_prof_2001
Inner London Outer London Birmingham Manchester Rest of England p_level45_2001 Inner London Outer London Birmingham Manchester Rest of England p_newuk_2001 Inner London Outer London Birmingham Manchester Rest of England
Percentage of population
2001 2011
18
London also come from a greater range of ethnic backgrounds than in other large cities and the rest of the country.
The populations of Inner and Outer London are more likely to have an occupation classified as higher professional than elsewhere in England (including Birmingham and Manchester), are more likely to have a high level of education and are more likely to be newly resident in the UK. These patterns have not changed dramatically between the two Census years, as there has been growth in the prevalence of these characteristics in all areas, suggesting that these differences are unlikely to explain the improvement in the performance of disadvantaged pupils over time.
Can changes in pupil characteristics explain improvements in GCSE
outcomes?
The previous subsection showed the substantial differences in the composition of pupils in London and other big cities compared with the rest of England. We now explore whether these differences explain the higher and improved performance of disadvantaged pupils in London and other big cities. This will inform us about whether the ‘London effect’ is driven by London’s schools or by the changing observable characteristics of pupils in London’s schools. By ‘observable characteristics’, we mean characteristics that are available in the administrative data we use – we are not able to account for differences in parents’ educational aspirations or other factors that may differ across areas that we do not observe in the administrative data.
We start by calculating the raw differences in outcomes between disadvantaged pupils in Inner London, Outer London, Birmingham and Manchester compared with the rest of England for each year between 2002 and 2012. Here, we focus on the difference in the proportion of children eligible for FSM achieving five or more GCSEs or their equivalent at A*–C (including English and maths). The data appendix repeats the results we show here for two other Key Stage 4 outcomes (the proportion achieving eight or more A*–Bs in Figure A4(a) and the average GCSE capped points score standardised at the national level in Figure A4(b)). We refer to these results in the text and compare the results for the latest year of data in 2012. Tables in the appendix show whether the differences we describe here are statistically significant.
The raw differentials are shown by the solid lines in Figure 8 and confirm the results in the
previous subsection: disadvantaged pupils in Inner London perform better than such pupils in the rest of England, and their results have improved much faster over time. Disadvantaged pupils also perform better in Outer London, Birmingham and Manchester and have shown sizeable
improvement over time (the raw differences for Manchester are generally not statistically significant), although the level and the growth are not as substantial as for Inner London.
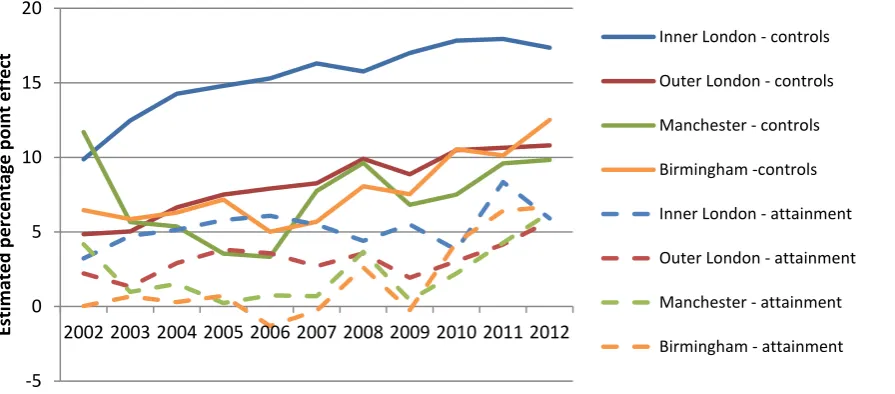
To examine the extent to which these differences can be explained by differences in pupil and school characteristics, we re-estimate the differential for these urban areas compared with the rest of England after controlling for a range of pupil and school characteristics.14 This is shown by the
14 The set of pupil characteristics we control for is as follows: gender; ethnicity (eight non-white minority groups, as in
19
[image:19.595.60.375.151.359.2]dashed lines in Figure 8. We are now comparing the attainment of disadvantaged pupils in London with similar pupils elsewhere in the country in terms of their ethnicity, deprivation, gender and the types of schools they attend.
Figure 8 Estimated effect of being in London or other large cities on proportion of pupils eligible for FSM achieving five or more GCSEs at A*–C including English and maths (or equivalent), 2002–12, with and without controls (relative to rest of England)
Source: Authors’ calculations using National Pupil Database 2002–12.
As can be seen, part of the improvement in results for Inner London can be explained by changes in pupil and school characteristics over time. Whilst the raw differential compared with the rest of England rises from 7 percentage points in 2002 to 21 percentage points by 2012, the differential after controlling for pupil and school characteristics rises from 10 percentage points to 17
percentage points. This means that about half of the growth in this measure of GCSE results in Inner London can be explained by changes in pupil and school characteristics. However, the difference compared with the rest of England is still very large and grows significantly over time even after controlling for pupil and school characteristics. Furthermore, as Table A1 in the appendix shows, the differences remain statistically significant.
Across the other large urban areas being considered, we see a similar pattern. Some of the improvement in the performance of disadvantaged pupils in Outer London and Birmingham compared with the rest of the country can be explained by changes in pupil and school
characteristics. However, there is still significant growth over time and both still show higher levels of performance even after controlling for these pupil and school characteristics. Manchester is slightly different as disadvantaged pupils perform even better after controlling for pupil and school characteristics (and the estimates now become statistically significant), though the improvement in their performance is slightly muted after controlling for characteristics.
pupils in their year group with SEN; proportion of pupils in their year group in each quintile of IDACI; proportion of pupils in their year group from a non-white background.
-5 0 5 10 15 20 25
2002 2003 2004 2005 2006 2007 2008 2009 2010 2011 2012
Es
tima
te
d p
er
ce
nt
ag
e p
oi
nt
e
ffe
ct
Inner London - raw
Outer London - raw
Manchester - raw
Birmingham - raw
Inner London - controls
Outer London - controls
Manchester - controls
20
Therefore, part of the explanation for the higher and improved performance of pupils in Inner London and other large urban areas is down to differences in pupil and school characteristics and their changes over time. However, there is still much that is unexplained, in terms of both the growth and the higher level of performance.
Can improvements in GCSE outcomes be explained by prior
attainment at primary school?
Much work has shown the importance of prior attainment in primary school for explaining GCSE outcomes. A natural question to ask therefore is whether the higher and improved performance of disadvantaged pupils at GCSE in Inner London and other large urban areas can be explained by differences in their prior attainment. We do this by controlling for pupils’ performance at Key Stage 2 in English and maths.15 The results are then interpreted as the ‘London effect’ on pupils’
[image:20.595.51.499.378.575.2]improvement from age 11 to 16, or the value added of secondary education in London over and above the child’s attainment upon entry. The results of this are shown in Figure 9. The solid lines repeat the results from Figure 8 after controlling for pupil and school characteristics, whilst the dashed lines now show the results after additionally controlling for prior attainment.
Figure 9 Estimated effect of being in London or other large cities on proportion of pupils eligible for FSM achieving five or more GCSEs at A*–C including English and maths (or equivalent), 2002–12, with controls and prior attainment (relative to rest of England)
Source: Authors’ calculations using National Pupil Database 2002–12.
The differences in the level of performance for each urban area compared with the rest of England are now much smaller. Furthermore, there is no longer any improvement in the performance of disadvantaged pupils compared with the rest of England. It appears that once we account for differences in attainment upon entry to secondary schools, the ‘London effect’ is much reduced. London secondary schools are still performing significantly better than schools in the rest of the country, by about 5 percentage points on this measure. However, the ‘London effect’ appears to start in primary school rather than secondary school. For Manchester and Birmingham, the
15 Specifically, we control for KS2 maths and English scores, standardised on the national scales, and add quadratics
in both. -5
0 5 10 15 20
2002 2003 2004 2005 2006 2007 2008 2009 2010 2011 2012
Es
tima
te
d p
er
ce
nt
ag
e p
oi
nt
e
ffe
ct
Inner London - controls
Outer London - controls
Manchester - controls
Birmingham -controls
Inner London - attainment
Outer London - attainment
Manchester - attainment
21
[image:21.595.52.387.138.301.2]estimates are also greatly reduced after controlling for prior attainment and generally lose their statistical significance, though they are of a similar magnitude to those for London.
Figure 10 Estimated effect of being in London or other large cities on different GCSE outcomes for pupils eligible for FSM, with different sets of controls, 2012 (relative to rest of England)
(a) Five or more GCSEs or their equivalent at A*–C (including English and maths)
(b) Eight or more GCSEs or their equivalent at A*–B (including English and maths)
(c) Average standardised capped points score at GCSE (including equivalents)
Sources: Authors’ Calculations using National Pupil Database 2012. 0 5 10 15 20 25
Inner London Outer London Manchester Birmingham
Di ffer en ce rel ati ve to res t o f Eng la nd (ppt s)
Raw Controls Controls & prior attainment
-10 1 2 3 4 5 6 7 8 9 10
Inner London Outer London Manchester Birmingham
Di ffer en ce rel ati ve to res t o f Eng la nd (ppt s)
Raw Controls Controls & prior attainment
-0.10 0.00 0.10 0.20 0.30 0.40 0.50
Inner London Outer London Manchester Birmingham
Di ffer en ce rel ati ve to res t o f En gl an d
22
This analysis is repeated for other GCSE outcomes in the appendix (Figure A5) and is
summarised in Figure 10. For each outcome and urban area in 2012, we show the difference in outcomes for pupils eligible for FSM compared with the rest of England in raw terms, after controlling for pupil and school characteristics, and with additional controls for prior attainment.
In raw terms, FSM-eligible students in London, Manchester and Birmingham all perform better than FSM-eligible students elsewhere in the country across all three GCSE outcomes. Once we control for differences in pupil characteristics across areas, these differences are reduced in Inner London, Outer London and Birmingham, showing that some of the raw differential can be
accounted for by differences in student demographics. However, the performance of FSM-eligible students in Manchester looks slightly better once we control for student demographics, suggesting that groups of pupils that perform better, on average, across the country perform less well in Manchester. These patterns are common across all three GCSE outcomes considered here, suggesting that student demographics can explain some of the higher level of performance of FSM-eligible students in London and Birmingham for a threshold measure and for a measure of high educational attainment, but certainly not all of it.
When we also control for prior attainment, differences in pupil performance compared with the rest of England are dampened significantly across all four urban areas and across all three GCSE outcomes. The reductions are largest for the measure of high performance (Figure 10(b)) and the average capped points score measure (Figure 10(c)). Controlling for prior attainment also seems to largely equalise the differential across urban areas. There are still positive urban effects, but these are much smaller and not significant in the case of Manchester and Birmingham. Prior attainment thus explains a large part of why FSM-eligible students in London, Manchester and Birmingham perform better than FSM-eligible students in the rest of the country.
One exception to these patterns is that for GCSE average point score in Birmingham. In this case, the raw differential is larger than that for Inner London and remains significant even after we control for prior attainment. However, even though Birmingham performs better in terms of
average points score, this does not seem to be reflected in levels of high performance. As we shall see later, there appears to be no subsequent effect on Key Stage 5 participation in Birmingham either. The qualifications achieved by pupils in Birmingham do not therefore seem to be converted into improved participation at Key Stage 5.
The trends for these other GCSE outcomes are shown in Figures A4 and A5 in the appendix. For the measure of high performance, we see a very similar pattern for London as we saw for five or more GCSEs at A*–C. High attainment at GCSE has improved even more in London and there is more potential for a so-called ‘London effect’, as less of the difference from the rest of England is explained by differences in pupil characteristics. Although dampened when controlling for
demographics and prior attainment, London secondary schools clearly have a higher proportion of disadvantaged students that are successful at higher levels of attainment than schools in
Manchester and Birmingham.
23
score in GCSEs is slightly different, with no growth in the ‘London effect’ over time. However, disadvantaged pupils in London and other big cities do perform better on this measure and much of the difference is explained by prior attainment (as we see in Figure 10(c)).
This subsection has demonstrated that a very large part of the higher and improved performance of disadvantaged pupils in Inner London and other large urban areas can be explained by
differences in prior attainment. Disadvantaged pupils entering secondary schools in Inner London and other big cities have higher levels of attainment at Key Stage 2 – which has contributed significantly to the greater improvement at GCSE over time compared with the rest of England. This is not to say that secondary schools in London, or in other big cities, are not adding value: there is a positive effect of being in Inner London or other big cities conditional on prior attainment. Furthermore, high-achieving disadvantaged pupils often fall behind in the secondary phase and London schools may be more effective in sustaining higher achievement.16 However, our results
do suggest that a major part of the explanation for the London or Big City effect probably lies much earlier. To explore the mechanisms behind the ‘London effect’, we need to explore changes and initiatives in primary schools further back in time.
Summary
Disadvantaged pupils in Inner London, Outer London, Manchester and Birmingham all perform significantly better than those in the rest of England even after we account for pupil and school characteristics.
Some of the improvement in results over time for disadvantaged pupils in London and other
big cities can be explained by changes in pupil characteristics over time, particularly changes in ethnic composition.
The higher level and more rapid improvement in results for disadvantaged pupils in London and other big cities can be mostly explained by improvements in prior attainment at Key Stage 2, suggesting that changes in the performance of pupils in the primary phase may be important determinants of the growth in attainment in secondary schools.
24
3. Improvements in primary schools
The previous section showed that a large part of the higher GCSE results for disadvantaged pupils in London and other big cities compared with the rest of England is accounted for by differences in prior attainment between pupils in these areas. To explore a little further when, how and why these differences in prior attainment might have occurred, we now examine differences in Key Stage 2 test scores in maths and English directly.
Figure 11(a) Estimated effect of being in London or other large cities on average standardised KS2 maths fine points score amongst pupils eligible for FSM, by year in which pupils took or will take GCSEs, 2002–18, with controls (relative to rest of England)
Figure 11(b) Estimated effect of being in London or other large cities on average standardised KS2 English fine points score amongst pupils eligible for FSM, by year in which pupils took or will take GCSEs, 2002–18, with controls (relative to rest of England)
Source: Authors’ calculations using National Pupil Database 2002–12. 0.00 0.05 0.10 0.15 0.20 0.25 0.30 0.35 0.40 20 02 20 03 20 04 20 05 20 06 20 07 20 08 20 09 20 10 20 11 20 12 20 13 20 14 20 15 20 16 20 17 20 18 Es tima te d e ffe ct on st an da rd is ed p oi nt scor e
Year pupil has taken / will take GCSEs
Inner London - KS4 controls
Outer London - KS4 controls
Manchester - KS4 controls
Birmingham - KS4 controls
Inner London - KS2 controls
Outer London - KS2 controls
Manchester - KS2 controls
Birmingham - KS2 controls
0.00 0.05 0.10 0.15 0.20 0.25 0.30 0.35 0.40 20 02 20 03 20 04 20 05 20 06 20 07 20 08 20 09 20 10 20 11 20 12 20 13 20 14 20 15 20 16 Es tima te d e ffe ct on st an da rd is ed p oi nt scor e
Year pupil has taken / will take GCSEs
Inner London - KS4 controls Outer London - KS4 controls Manchester - KS4 controls Birmingham - KS4 controls Inner London - KS2 controls
[image:24.595.47.540.230.467.2] [image:24.595.48.551.528.759.2]25
Figure 11 repeats the analysis from the previous section for Key Stage 2 (the detailed figures are shown in Tables A2 and A3 in the data appendix). The graph shows the estimated difference between each of Inner London, Outer London, Manchester and Birmingham and the rest of England in terms of the average Key Stage 2 maths and English fine points scores of pupils eligible for FSM after controlling for pupil and school characteristics. Key Stage 2 test scores are standardised on the national scale within each year. So that we can relate this directly back to the previous estimates for GCSEs, the year on the horizontal axis represents the year in which pupils took or will take their GCSEs. Detailed controls for pupil characteristics at Key Stage 2 do not exist for pupils taking their GCSEs before 2007. For these years, we have used pupil controls as
measured when pupils took their GCSEs (Key Stage 4).17
The average maths scores of disadvantaged pupils in Inner London are much higher than those in the rest of England (by about 0.25 standard deviations for pupils taking GCSEs up to 2012). Maths scores are also higher for disadvantaged pupils in Outer London, Manchester and Birmingham, but to a lesser extent. However, there is not much change over this period for any of these big cities (except that we see a further pickup in maths scores in London for pupils taking GCSEs after 2013), suggesting that it is unlikely that improvements in Key Stage 2 maths scores caused the uplift in GCSE scores from 2002 onwards.
The average English scores for disadvantaged pupils in Inner London compared with the rest of England are also much higher (by about one-third of a standard deviation for pupils taking GCSEs in 2012). There are also positive differences for Outer London, Manchester and Birmingham, but not as large as the difference for Inner London. Interestingly, unlike for maths scores, there is a large increase in the difference in English scores of disadvantaged pupils in Inner and Outer London compared with the rest of the country for pupils taking GCSEs between 2004 and 2008: the differentials for Inner and Outer London increase by over 0.2 standard deviations over this period. This increase would have occurred for pupils taking Key Stage 2 tests between 1999 and 2003.
Summary
Disadvantaged pupils in London, Manchester and Birmingham all perform significantly better at Key Stage 2 in both English and maths than those in the rest of England, with pupils in Inner London showing the highest level of performance (even after controlling for pupil characteristics).
There was a large improvement in KS2 English scores for disadvantaged pupils in London between 1999 and 2003, which is likely to be a key reason why GCSE results in London subsequently improved between 2004 and 2008.
17 As we can use either KS2 or KS4 controls for some overlapping years, we can compare these two sets of
26
4. Sustained improvements in post-16 outcomes
Before turning to potential explanations for why pupils in London may have seen improvements in Key Stage 2 test scores at age 11, it is important to consider whether the London and Big City effects are sustained into post-16 outcomes. We therefore examine differences across areas in the proportion of pupils enrolling in Key Stage 5 after age 16 and the average performance of those pupils who do participate at Key Stage 5. As in previous sections, we focus on
disadvantaged pupils, defined by whether they were eligible for FSM at the end of compulsory schooling. Of course, there are alternative post-16 routes that will not be captured in Key Stage 5 data, such as studying towards vocational qualifications through a further education college (these data are found in the Individual Leavers Record data, which were not used here). Our focus is therefore on the more academic post-16 outcomes, which are strong predictors of making the transition through to higher education post-18 – a key determinant of later labour market outcomes.
Figure 12 shows the estimated raw difference in the proportion of pupils eligible for FSM who continue into Key Stage 5 after age 16 for Inner London, Outer London, Manchester and Birmingham compared with the rest of England (see Table A4 in the data appendix for detailed figures). In raw terms, disadvantaged pupils in Inner and Outer London are more likely to continue into Key Stage 5, compared with both those in the rest of England and those in Birmingham and Manchester. This difference has grown over time. After we control for differences in pupil and school characteristics, the difference is reduced, although disadvantaged pupils in Inner London are still estimated to be over 10 percentage points more likely to continue into Key Stage 5 than disadvantaged pupils in the rest of England. The ‘London effect’ for disadvantaged pupils
[image:26.595.51.486.547.749.2]therefore seems to be sustained into post-16 outcomes. This is likely to be linked to London’s higher levels of attainment at Key Stage 4, shown in the Introduction, but may also be related to differences in aspiration for higher education, which are not observable to us.
Figure 12 Estimated effect of being in London or other large cities on participation at KS5 for pupils eligible for FSM, 2002–10, with and without controls (relative to rest of England)
Source: Authors’ calculations using National Pupil Database 2002–12. 0
5 10 15 20 25
2002 2003 2004 2005 2006 2007 2008 2009 2010
Es
tima
te
d p
er
ce
nt
ag
e p
oi
nt
d
iffe
re
nce
Year pupil has taken GCSEs
27
The same cannot be said of Manchester and Birmingham. Disadvantaged pupils in Manchester and Birmingham are only very marginally more likely to continue into Key Stage 5 than those in the rest of England, conditional on pupil and school characteristics, and the differences are often not statistically different from zero. The higher performance of disadvantaged pupils in Manchester and Birmingham at Key Stage 4 is therefore not sustained into post-16 outcomes.
This evidence for Birmingham is consistent with our earlier results showing that high attainment at Key Stage 4 is not significantly different in Birmingham from in the rest of England, as high
attainment is often a requirement for many post-16 courses. One potential explanation is that part of the higher average performance of Birmingham comes from a greater use of GCSE equivalents. However, there are also a number of other potential explanations for contrasting trends for
[image:27.595.52.346.417.610.2]London, Manchester and Birmingham. First, there could be differences in the structure of post-16 education – for example, in the number of sixth forms attached to schools. Second, there are a large number of universities in close proximity to students in London, and more so than near students in Birmingham and Manchester. This could provide greater encouragement for pupils in London to attend university, and thus to continue into Key Stage 5 in order to achieve this aim. Third, there could be differences in labour market opportunities across these three cities that lead young people to make different education choices. Lastly, there could be other unobservable differences between pupils across cities that affect their propensity to continue in school after age 16 – for example, differences in aspirations.
Figure 13 Estimated effect of being in London or other large cities on participation at KS5 for pupils eligible for FSM, 2002–10, with controls and prior attainment (relative to rest of England)
Source: Authors’ calculations using National Pupil Database 2002–12.
Figure 13 shows the estimated differences in Key Stage 5 participation after additionally
controlling for prior attainment at age 16. The differences in participation across areas are now much smaller, as entry to academic post-compulsory education is often determined by attainment thresholds. However, even after controlling for differences in age-16 outcomes, disadvantaged pupils in Inner and Outer London are still more likely to continue into Key Stage 5. This suggests that something about London or its disadvantaged households is either allowing or encouraging
-4 -2 0 2 4 6 8 10 12 14
2002 2003 2004 2005 2006 2007 2008 2009 2010
Es
tima
te
d p
er
ce
nt
ag
e p
oi
nt
d
iffe
re
nce
Year pupil has taken GCSEs
28
disadvantaged pupils to continue into Key Stage 5 after age 16 over and above their attainment at age 16.
This pattern is also evident when we consider Key Stage 5 performance, conditional on
participation at Key Stage 5, across a range of measures including Key Stage 5 points score, the proportion of children achieving two or more A levels at A*–E and the proportion of children achieving A*–E in ‘facilitating subjects’ at A level.18 Figure A6 in the data appendix illustrates the
estimated percentage point gain in the probability of achieving two or more A levels at A*–E (Level 3 equivalent19) for Inner and Outer London relative to the rest of England (excluding Manchester
and Birmingham20).
There is therefore strong evidence that disadvantaged pupils from London are participating more and performing better than disadvantaged students in the rest of England. As participation and attainment at Key Stage 5 is a strong predictor of participation and attainment in higher education, this suggests that disadvantaged pupils from London may have access to greater labour market opportunities and life chances relative to those in the rest of England as a result of their better performance at school.
Summary
The ‘London effect’ is sustained into post-16 outcomes. Disadvantaged pupils in London are more likely to continue into Key Stage 5 even after accounting for differences in pupil and school characteristics.
Disadvantaged pupils in London are more likely to attend post-compulsory education even
after controlling for differences in prior attainment, suggesting that there is an extra benefit of being in London over and above differences in age-16 outcomes.
Although they have better average GCSE results than disadvantaged pupils in the rest of England, disadvantaged pupils in Manchester and Birmingham are not more likely to continue into Key Stage 5 education.
18 For more information on ‘facilitating subjects’, see pages 24–25 of Russell Group (2013/14).
19http://www.education.gov.uk/schools/performance/archive/16to18_08/d4.shtml.
20 Given that this analysis is restricted to FSM-eligible children and is conditional on participation at Key Stage 5, we
29
5. Why have we seen an improvement in London?
We have shown that the major explanation for why disadvantaged pupils in London have seen substantial improvements in Key Stage 4 results over the last decade is the improvement in attainment at the end of primary school during the late 1990s, particularly in English. We now ask what might have driven these improvements in primary school attainment. Plausible explanations must fit with the timing of the improvement: what changed about primary schools in London during the late 1990s and early 2000s that could have affected pupils’ attainment?
We focus on the potential role of the following explanations:
pupil intake;
resources;
teachers;
school governance;
school competition;
specific policy initiatives.
We should be clear from the outset that it is not possible to confirm the precise causes of the improvement in pupil attainment. We are able to say which explanations seem more plausible than others, however, and where future research could be directed towards better understanding the causes of the improvements in London over time.
Pupil intake
There are substantial differences between London, other large cities and the rest of England in terms of the ethnic mix of pupils. Previous sections demonstrated that some of the improvement in the performance of disadvantaged pupils in London, Manchester and Birmingham can be
accounted for by changes in pupil and school characteristics – about one-half of the improvement for Inner London, for example. However, there are still substantial differences in school
performance at Key Stage 4 even after controlling for pupil and school characteristics, as well as sizeable improvements in performance relative to the rest of England. Therefore, changes in the pupil intake over time are clearly an important part of the explanation, but not the whole
explanation.
The major explanation comes from differences in the level of and changes over time in
30
differences in Key Stage 1 teacher assessments, the effect of being in London on Key Stage 2 English test scores is reduced by about one-half, although the differences between London and the rest of England remain substantial. This suggests that disadvantaged pupils in London perform better even after accounting for Key Stage 1 scores. Unfortunately, we can only extend this
analysis back to pupils taking Key Stage 2 in 2002, so we cannot examine the period between 1999 and 2003 when Key Stage 2 English scores in London increased dramatically relative to the rest of the country.
Resources
Schools in London receive higher levels of funding than schools in other parts of the country. This reflects the facts that schools in London must pay higher teacher salaries (because of London weighting, to reflect the higher cost of living) and that there are higher levels of deprivation in London.21
In Figure A8 in the data appendix, we show the levels of funding per pupil in Inner London, Outer London, Birmingham and Manchester relative to the level in the rest of England, for the period 2003–10 and for primary and secondary schools separately. This confirms that funding per pupil is higher in Inner London than in the rest of England, by about 33% for primary schools and 40% for secondary schools. Outer London, Birmingham and Manchester also receive higher levels of funding than the rest of England, but not by as much as Inner London (the higher levels of funding for Birmingham and Manchester largely reflect funding targeted at deprivation – which was in place before the introduction of the pupil premium – as there is no formal weighting for higher teacher salaries in these areas). However, the differences relative to the rest of England are relatively stable over time and pre-date the improvements in pupil performance seen in these areas, meaning that changes in funding are unlikely to be a major explanation for the changes over time in the performance of disadvantaged pupils.
These figures only go back to 2003 and it could be that there were dramatic changes taking place in earlier years. However, earlier evidence suggests that higher levels of funding for London are longstanding.22 Furthermore, to explain the improvements in results for disadvantaged pupils in
London, there would need to have been a dramatic change in the resources targeted at primary schools in particular. This collection of evidence suggests that changes in funding are unlikely to be a major explanation for changes in the performance of disadvantaged pupils in London.
Teachers
There is a large body of academic evidence arguing that variations in teacher quality play a large part in explaining variations in pupil attainment.23 One potential explanation for the ‘London effect’
could be that higher-quality teachers are attracted to London and increasingly so in recent years, perhaps because of higher levels of teacher pay or other benefits of living in London. A number of
21 See Chowdry et al. (2008), Chowdry and Sibieta (2011) and Greaves and Sibieta (2014).
22 Department of the Environment (1990); West et al. (2000).