programs cope when the paper
study materials are no longer readily
available?
• • • Gary Orth, Clare Robinson
Open Access College, University of Southern Queensland, Toowoomba, Australia
Abstract
Students studying enabling programs are now expected to learn from the electronic medium rather than from paper study materials. Most universities have budgeting constraints that impact on the production and provision of the traditional paper study materials. As a result of the Bradley Report, universities are increasing the participation rates in their enabling programs (Bradley, et al., 2008) by accepting new students who have low academic skills and often lack confidence to succeed in higher education. Together with increased student numbers in enabling courses and tighter budgeting constraints, electronic resources are seen by universities as being more cost effective. Many students may be computer literate but do they manage to learn effectively or as well as students who studied using traditional methods?
Introduction
Distance education students have traditionally learned from paper study materials. Their learning was initially supported by mail updates, telephone communication, teleconferencing and vacation schools. This support has been replaced by online communication through forums, online classes and other online resources. Today, it is expected students must have access to the Internet in order to receive this support and study effectively at university (Martin, 2006).
The University of Southern Queensland (USQ) StudyDesk is an online resource that allows students to access lecturers, colleagues, the course content and other resources. USQ uses the Moodle Course Management System to provide a StudyDesk for each course. It is a vehicle through which lecturers can help enrolled students to stay motivated as well as provide support and enrichment throughout the course.
The Tertiary Preparation Program (TPP) is a fee-free bridging program designed to enable prospective tertiary education students to master the essential knowledge and skills required to succeed with their undergraduate studies. Although TPP students are enrolled at the university, they are a group of students that are very different from students in the undergraduate programs (Bedford, 2007). Engaging these students and providing them with a rich educational experience is pivotal for their success not only in TPP but also in their future undergraduate studies (Klinger & Wache, 2009). The core courses offered in the TPP are Studying to Succeed (TPP7120) and Mathematics (TPP7181). Both courses are not online courses but are distance education courses that have been adapted for on-campus students as well as external students. The materials on each course’s StudyDesk are support and enrichment materials for voluntary use by the students.
Previous research by the authors focussed on how to better engage students using the online resources, and whether this enhanced engagement was reflected in the final results and the rates of retention (Orth & Robinson, 2010). Towards the third year of the research, the conditions changed whereby students were no longer sent hardcopy study materials, but were expected to utilise the electronic medium. These new conditions made measurement of the outcomes of engagement more complex and difficult to analyse (Orth & Robinson, 2011).
manage their learning in this new online environment, whether they have the skills and confidence needed to be successful without the hardcopy study materials, and what educators can do to assist their learning.
Background, theory and literature review
In a previous paper the authors (Orth & Robinson, 2011) described many fundamental differences between TPP students and traditional undergraduate students. TPP students usually have less developed academic skills than their undergraduate colleagues and require generous support to complete their enabling courses successfully (Mehrotra, et al., 2001). Many TPP students have not completed the final year 12 of secondary education, with approximately 30 per cent completing year 10 or less. Even the TPP students who have completed year 12 have usually selected a non-tertiary entrance pathway that would not have emphasised the academic skills essential for success at university (Bradley, et al., 2004). TPP students may be less developed socially compared to mainstream students seeking a traditional pathway towards tertiary education (Hupfield, 2007). This lack of social development in academic and non-academic communication with their peers and teachers at a secondary educational level does affect their confidence to be involved in forums and discussions on StudyDesk that will expose them to public scrutiny (Schulz & Beach, 2004). It may also inhibit them from making enquiries when they do not know how to master the system or the course content.
Most TPP students are the first in their family to attend university and may feel unsure of the basic requirements to succeed at university (Jeffrey & Hardie, 2010). Enabling students often drop out because of a general lack of confidence, lack of family support and an inadequate academic background (McKenzie, 2005). The lack of academic skills, together with the constraints of distance education, is a major impediment for students to enjoy their learning experience as well as achieve success (Gibson, 2001).
supply of the paper study materials could affect the learning of this non-traditional cohort of students. How would this cohort of students manage their learning in this new online environment?
The research carried out by Peterson (2009) with Arts undergraduate students at Monash University found that when students were given the choice of online study materials, paper study materials or physical digital (DVD) materials, they had a strong preference for the paper study materials. There was very little support for the DVD. The report also identified that cost factors did influence the student’s decision to select a particular resource mode. This aspect was not reviewed in this report but it may become more critical with the expected increased cost of accessing the national broadband (Rehn & Grech, 2010).
Most universities have budgeting constraints that impact on the production and provision of the traditional paper study materials. In an attempt to reduce operational costs and to create greater flexibility, course materials and resources have been placed online. Recent research in online delivery in the vocational education and training sector by Curtain (2002) found that the costs to operate a highly interactive, major content-based distance education course were about twice the costs to operate a traditional print-based, low-interaction distance education course. The satisfaction ratings for the highly interactive, major content-based distance education course were similar to the satisfaction ratings for the traditional classroom-based course. The operational costs to achieve equitable outcomes for distance education students are considerably more than was originally budgeted for, if high student interaction is to be maintained (Curtain, 2002).
If TPP students recognised that they needed paper study materials, they were encouraged to apply early in the semester for the material to be posted to them. The delay between application and receipt of the paper study materials would have been approximately one to two weeks. Students who had difficulties with learning may not have recognised that the lack of paper study materials was contributing to the problem. They may have confused their inability to read or organise online materials as a lack of academic maturity or poor reading and memory skills. Many TPP students have low academic self-efficacy and could attribute the reasons for their lack of success as intrinsic rather than a learning-mode issue.
Methodology for the research
Students were surveyed in a short online survey after week 8 and at the end of the course (week 15) in semester 3 2011 and semesters 1 and 2 2012. Students were asked to quantify their responses (where possible) using a five-point Likert scale. The five-point scale was reduced to a three-point scale. For simplicity, the ‘strongly agree’ comments were grouped together with the ‘agree’ comments as well as ‘strongly disagree’ comments with the ‘disagree’ comments. Space was included to allow students to record some qualitative responses. The response rates for all semesters were reasonably strong for a voluntary survey (approximately 16% (42/260) for semester 3 2011, 14% (66/480 for semester 1 2012 and 12% (50/410) for semester 2 2012). The questionnaire at the end of the semester specifically examined how students managed their learning with or without the paper study materials. It was difficult to avoid some bias in the survey results when the survey was voluntary and completed online. Students who are motivated to respond and are confident completing the questionnaire online may respond differently from the general TPP student population (Draugalis & Plaza, 2009).
Many TPP students are in correctional centres without access to the online materials. These TPP students were not included in the study.
Survey results
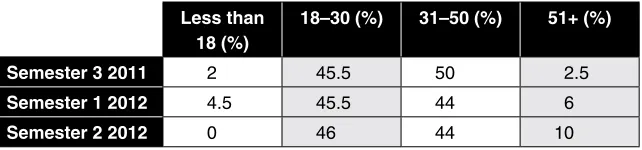
Table 1: Age groups from the semester surveys, as a percentage
Less than 18 (%)
18–30 (%) 31–50 (%) 51+ (%)
Semester 3 2011 2 45.5 50 2.5
Semester 1 2012 4.5 45.5 44 6
Semester 2 2012 0 46 44 10
[image:6.420.44.363.233.430.2]Table 1 demonstrates that the majority of TPP students are between 18 to 50 years of age. Very few students under the age of 18 are given permission to start TPP. When the enrolment data is reviewed over the past 10 years, an interesting trend is evident, as reported in Table 2.
Table 2: Enrolments numbers and percentages for TPP7120, 2002–2012
< 18 no. %
18–30
no. %
31–50 no. %
51+ no. %
2002 0 0 147 21 464 66 91 13
2003 0 0 173 26 427 63 76 11
2004 0 0 197 33 340 57 61 10
2005 0 0 226 33 399 59 55 8
2006 0 0 269 38 382 54 55 8
2007 0 0 236 38 342 56 3 6
2008 0 0 312 47 305 46 48 7
2009 0 0 537 51 449 43 62 6
2010 0 0 731 60 426 35 52 4
2011 20 2 727 60 412 34 47 4
2012 41 4 571 54 409 39 30 3
Table 3: Students who applied to receive paper study materials, as a percentage
applied (%) did not apply (%)
Semester 3 2011 34 66
Semester 1 2012 66 34
Semester 2 2012 36 64
Although the percentages were large for the group who did not apply to receive the paper study materials, as evident in Table 3, the percentages for those students who did apply were significant.
Table 4: Age versus Paper application for combined semesters
applied for paper materials
no yes Total
age
under 30 Count
% within age
39 33 72
54 46 100
31 and over Count
% within age
42 46 88
48 52 100
Total Count
% within age
81 79 160
50.6 49.4 100
The four (4) age groups were combined into a group ‘under 30’ and a group ‘over 30’ in an attempt to find any association using the Chi-Squared Test. No significant association was found between age group and the application to receive the paper study materials.
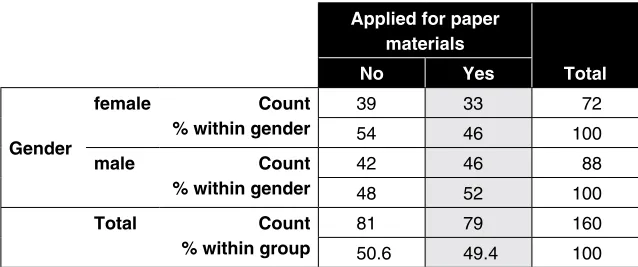
Table 5: Gender verses Paper application for combined semesters
applied for paper materials
no yes Total
gender
female Count
% within gender
39 33 72
54 46 100
male Count
% within gender
42 46 88
48 52 100
Total Count
% within group
81 79 160
[image:7.420.57.376.411.545.2]After a Chi-Squared Test was applied to Table 5, no significant association was found between gender and the application to receive the paper study materials. However, the percentage of males who applied for the paper study materials was noticeably less than the percentage of females.
Table 6: Student rating of individual computer skills, as a percentage
Very good (%)
good (%) Satisfactory (%)
Weak (%)
Semester 3 2011 45 38 14 3
Semester 1 2012 32 49 18 1
Semester 2 2012 32 32 24 12
Table 6 revealed that most respondents rated their computer skills as satisfactory or better. When comparing tables 3 and 6, it is evident that many students who did rate their computer abilities as very good, good or satisfactory had applied to receive the paper study materials, which suggested that
[image:8.420.47.362.316.380.2]confidence in computer skills is not necessarily linked to confidence to learn online.
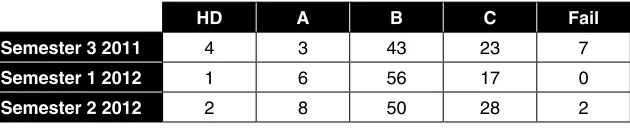
Table 7: Student’s estimation of their expected rating
Hd a B C Fail
Semester 3 2011 4 3 43 23 7
Semester 1 2012 1 6 56 17 0
Semester 2 2012 2 8 50 28 2
Table 8: Student perception that the course was more difficult when paper materials were not automatically mailed, as a percentage
agree (%) neutral (%) disagree (%)
Semester 3 2011 45 29 26
Semester 1 2012 62 21 17
Semester 2 2012 58 30 12
[image:9.420.59.378.296.407.2]Table 8 indicates that a majority of respondents perceived that the course was more difficult when they did not receive the paper study materials. However, there was a significant percentage of students who felt comfortable studying the course online. The majority of students understood that if they had difficulties studying online, they could apply to receive the paper study materials. Most students received the paper study materials within three weeks of application. These students could have spent up to five weeks studying online before they received the paper study materials. This delay gave students the opportunity to evaluate studying with or without the paper study materials.
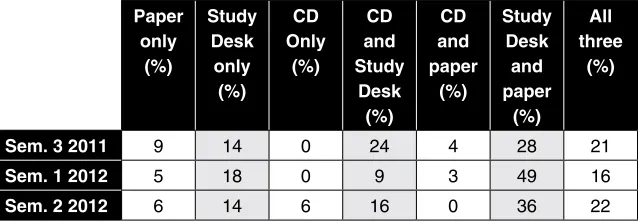
Table 9: Student response to indicate their main method of study, as a percentage
paper only
(%)
Study desk only (%)
Cd only
(%)
Cd and Study
desk (%)
Cd and paper
(%)
Study desk and paper
(%)
all three
(%)
Sem. 3 2011 9 14 0 24 4 28 21
Sem. 1 2012 5 18 0 9 3 49 16
Sem. 2 2012 6 14 6 16 0 36 22
Table 10: Students response to the non-supply of paper study materials, as a percentage personally print out paper materials (%) apply for the paper materials immediately (%) Try using Cd or Studydesk then apply for the paper study materials some weeks later (%) do nothing and work online (%) do nothing and regret not applying for paper materials (%)
Sem. 3 2011 38 10 12 32 8
Sem.1 2012 49 19 13 14 5
Sem. 2 2012 30 16 22 20 12
A majority of TPP students either printed the study materials or applied for and received the paper study materials. A significant percentage worked online with or without regrets. These percentages do not exactly match the data in Table 9. This may be in part due to students interpreting differently the meaning of main method of study or online course versus CD. However, the data clearly indicates that most students (60% or more) wanted to use the paper study materials either in conjunction with the online course or not.
Table 11: Methods used to remember important facts by percentage of students who selected to receive the paper materials
Sem3 2011 (%) Sem1 2012 (%) Sem2 2012 (%) Make notes on the paper
materials
86 59 67
Make notes on a separate sheet of paper
57 45 72
use sticky labels 50 61 56
underline 93 43 61
use a highlighter or different colours
86 84 89
Try to memorise it 14 11 6
[image:10.420.45.364.369.540.2]Table 11 indicates that TPP students who received the paper study materials used a variety of methods to remember important information. Underlining, use of a highlighter and making notes on the paper materials were the most common techniques used.
Table 12: Methods used to remember important facts by percentage of students who did not elect to receive the paper materials
Sem3 2011 Sem1 2012 Sem2 2012 use special software to
highlight
0 0 6
Cut and paste into a Word document
14 22 25
Read the section frequently 14 22 19
Keep handwritten notes 52 57 69
print out the important sections
41 57 31
all of the above 7 22 22
Some other method 10 22 6
[image:11.420.59.378.412.500.2]Table 12 demonstrates that of the TPP students, who did not apply to receive the paper study materials, a large percentage did not use a variety of techniques to remember the important information and the techniques that they did use were paper-related. They either kept handwritten notes or printed out the important sections.
Table 13: Students accessing the Study Desk, forum and resources after selecting paper study materials, as a percentage
never (%)
occasionally (%)
once a week
(%)
3 times a week (%)
nearly every day
(%)
Semester 3 2011 0 0 7 22 71
Semester 1 2012 2 7 11 22 58
Semester 2 2012 0 22 11 6 61
Table 14: Students who found studying Mathematics online to be difficult after not selecting paper study materials, as a percentage
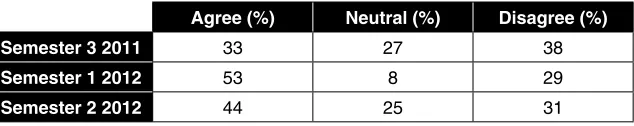
agree (%) neutral (%) disagree (%)
Semester 3 2011 33 27 38
Semester 1 2012 53 8 29
Semester 2 2012 44 25 31
[image:12.420.46.364.232.293.2]Table 14 does indicate that a significant percentage of TPP students who decided not to receive the paper study materials did experience difficulty when studying Mathematics online.
Table 15: Students who in hindsight should have applied to receive the paper study materials but did not do so, as a percentage
agree (%) neutral (%) disagree (%)
Semester 3 2011 28 22 50
Semester 1 2012 54 31 15
Semester 2 2012 70 12 18
A significant percentage of TPP students had regrets about their decision not to apply to receive the paper study materials. This may also be a reflection of the data in Table 14.
Discussion
The students who responded to the survey questions were students who were about to complete the course and were very positive about succeeding in the course (Table 7). The responses of the group who did not complete the course and were less optimistic about their chances of success are very relevant to this research. Not having their responses makes the group who answered biased and less reflective of the TPP student population. The data did offer some insight into the issues irrespective of the bias of the respondents. The challenge for future research is find the students who do not respond to these questionnaires and seek their opinions so that the responses may be more representative of the TPP student population.
teaching lecturers, may find the course content out of touch with their youthful experiences, and may need greater motivation to complete the course. This group may also be more able to manage their learning online. This bubble in the age group 18–30 may not be sustained in the medium or long term. Economic conditions, employment opportunities, government support, higher education priorities and attractive alternatives to TPP are only some of the variables that may determine the sustainability of this increased demand for TPP.
More than 45 per cent of respondents did apply for paper study materials (Table 3). More than 50 per cent of students who did not apply for the paper study materials did in hindsight regret that they had not applied (Table 15). Many students with perceived satisfactory or better computer skills also applied for the paper study materials (Table 6). Having sound computer skills or confidence in their ability to succeed did not necessarily mean that these TPP students thought they were able to learn effectively online. It was initially thought that the more mature students would be the group that would apply for the paper study materials. However, the research found that all age groups were equally represented in the group who chose to apply for the paper study materials.
The data reveals that there were at least two (2) distinct groups of respondents. One group of students was relaxed and confident and embraced studying online whilst another group of students needed the support of the paper study materials. This second group also frequented StudyDesk (Table 13) many times during the week and used the paper study materials. A subset of the first group of students indicated that they found studying Mathematics online to be difficult (Table 14). Very few students found the CD to be necessary when they could access StudyDesk or read the paper study materials. This outcome supported other research carried out by Peterson (2009) at Monash University. Presently, TPP courses are obliged to make the CD available so that low socio-economic status students who do not have access to the Internet can still download the material from the CD.
online are studying as effectively or having as rich an educational experience as TPP students who study using the paper study materials.
Conclusion
Since 2008, a larger group of younger students are choosing TPP as an alternative pathway into university. The numbers of more mature students have remained static over the last decade. This changing demographic should not be ignored when constructing or reviewing the existing courses and will impact on the methods used to deliver the courses.
TPP students are split into at least two (2) distinct groups. One group is confident and relaxed when studying TPP7120 online. This group has indicated that Mathematics is more difficult than TPP7120 to study online. This group also will print out any material that they consider important or necessary to succeed in the course. The second group prefers to study using paper materials as well as maintain their links with the online forums and extra resources available on StudyDesk. This group has developed a variety of techniques to assist them to study effectively. There was no significant association between the age group and applying for the paper study materials or between computer ability and the application for the paper study materials. There was also no significant association found between expected achievement level (self-advocacy) and the application for the paper study materials.
Very few TPP students use the CD and in the future this mode of study may be discontinued. TPP is obliged to support students who do not have internet access and the provision of the CD is very important for this student group.
Recommendations
• The course materials should be reviewed in order to accommodate the changing demographic of increasing numbers in the age group18–30.
• The paper study materials option should continue to be made available.
• All students should be taught how to study effectively online.
• The CD option should be reviewed to see if it is necessary for future TPP programs.
References
Bedford, T. (2007). Research Proposal: An investigation of TPP students’ study-management skills and learning styles, and of the relationships between these phenomena and students’ achievements in TPP core courses. Unpublished manuscript. Toowoomba: OPACS, The University of Southern Queensland.
Bradley, D., Noonan, P., Nugent, H., & Scales, B. (2008). Review of Australian Higher Education. Canberra, ACT: Australian Government.
Bradley, S., Nguyen, A., & Taylor, J. (2004). High School Dropouts: A Longitudinal Analysis. Lancaster: Lancaster University Management School.
Curtain, R. (2002). Online delivery in the VET sector: Improving cost effectiveness. Leabrook, South Australia.
Draugalis, J. R., & Plaza, C. M. (2009). Best Practices for Survey Research Reports Revisited: Implications of Target Population, Probability Sampling, and Response Rate. American Journal of Pharmaceutical Education, 73(8), 1-3. EBSCOhost, ehh, item: 67252283.
Gibson, C. (2001). Distance Learners in Higher Education. London: Kogan Page Limited.
Hupfield, K. (2007). Resilency Skills and Dropout Prevention. Denver, CO: Scholar Centric.
Jeffrey, R., & Hardie, J. (2010). “Hungry for it”: Mature, second chance students in a “do more with less” tertiary funding environment. Auckland: Unitec Institute of Technology.
Kavanagh, K., Clark, H., McCall, D.,…West, S. (2011). Challenging the past: (Re) constructing a distance education model to enhance student participation. Adelaide: National Committee of Enabling Educators (NCEE) and the University of South Australia.
Klinger, C., & Wache, D. (2009). Two heads are better than one: Community building in the Foundation Studies program to promote student engagement in learning. Paper presented to Enabling Conference, Toowoomba QLD.
Martin, L. (2006). Enabling e-literacy: Providing non-technical support for online learners. Retreived 1 June 2012, from http://repository.edgehill.ac.uk/id/eprint/36
McKenzie, D. F. (2005). Reducing Attrition Rates for Maori Students. Journal of Developmental Education, 28(3), 12–8. EBSCOhost, a9h, item: 16360666.
Orth, G., & Robinson, J. (2010). Enhancing the distance student learning experience, by encouraging engagement through the on-line Study Desk. Wellington: Dept of Foundation Studies, Unitec Institute of Technology, Auckland, New Zealand.
Orth, G., & Robinson, J. (2011). How successful were we in engaging distance education students online (Study Desk) in the Moodle environment? Adelaide: National Committee of Emabling Educators (NCEE) and the University of South Australia.
Peterson, J., Phan, L. H., Piscioneri, M., & Hlavac, J. (2009). Evaluation of Teaching and Learning Delivery Modes in Arts. Melbourne: Australian Learning and Teaching Council, Monash University.
Rehn, A., & Grech, J. (2010). NBN to cost users at least $56 a month for the basic plan. Daily Telegraph, 21 December 2010.
Schulz, N., & Beach, B. (2004). From Lurkers to Posters. Australian Flexible Learning Framework 2. Retrieved 1 May 2012, from http://flexiblelearning.net.au/ resources/lurkerstoposters.pdf
Tsai, C., Chuang, S., Liang, J., & Tsai, M. (2011). Self-efficacy in Internet-based Learning Environments: A Literature Review. Journal of Educational Technology & Society, 14(4), 222–40.
Whannell, R., Whannell, P., & Chambers, K. (2011). Venus and Mars in a tertiary bridging program. Adelaide: National Committee of Enabling Educators (NCEE) and the University of Auckland.