City, University of London Institutional Repository
Citation
:
Fabrizi, M. and Parbonetti, A. (2013). Privatized Returns and Socialized Risks: CEO Incentives, Securitization Accounting and the Financial Crisis (2013-08). London, UK: City Political Economy Research Centre (CITYPERC), Department of International Politics, City University London.This is the unspecified version of the paper.
This version of the publication may differ from the final published
version.
Permanent repository link:
http://openaccess.city.ac.uk/2120/Link to published version
:
2013-08Copyright and reuse:
City Research Online aims to make research
outputs of City, University of London available to a wider audience.
Copyright and Moral Rights remain with the author(s) and/or copyright
holders. URLs from City Research Online may be freely distributed and
linked to.
Paper Series
no. 2013/08
CITYPERC
City Political Economy Research Centre Department of International Politics City University London
Northampton Square London EC1V 0HB
Privatized Returns and Socialized Risks: CEO Incentives, Securitization
Accounting and the Financial Crisis
Michele Fabrizi
*& Antonio Parbonetti
ǂAbstract
The paper investigates the role of CEO’s equity and risk incentives in boosting securitization in the financial industry and in motivating executives to reduce the perceived risk while betting on it. Using a sample of US financial institutions over the period 2003-2009 we document that CEOs with high equity incentives have systematically engaged in securitization transactions to a larger extent than CEOs with low incentives. We also show that CEOs with high equity and risk-related incentives have engaged in the securitization of risky loans and have used securitization for transferring risks to outside investors. Finally, we show that executives incentivized on risk have provided outside investors with low quality disclosure about losses recorded on securitized loans thus contributing to increase the opacity of securitization transactions undertaken. Overall, we interpret our results as evidence that CEOs have foreseen in securitizations under US GAAP an opportunity for hiding risks while bearing them and generating profits and cash flows because of the risks. Our results are robust to several model specifications as well as to endogeneity concerns.
Keywords: Executive compensation, CEO incentives, Securitization, Financial Crisis
JEL Classification: M41, M12, G21, G32, G01
1. INTRODUCTION
From 2000 to 2006 the amount of loans securitized almost doubled while the securitization of risky subprime mortgages grew by almost eight times, exceeding 800 billion US dollars at the end of 2006. Whether highly incentivized CEOs have foreseen in securitizations under US GAAP an opportunity for hiding risks while bearing them and generating profits and cash flows because of the risks is an open issue that this paper is going to explore.
Securitizations transform illiquid assets into liquid securities and transactions that qualify for sale accounting offer several benefits that make them particularly appealing to bank originators. First, securitization enables financial institutions to optimally choose their exposure to the credit risk of loans generated (Jiangli and Pritsker, 2008). Second, securitization enables banks to replace illiquid loans with cash, improving banks’ liquidity. Third, financial institutions subject to regulatory capital requirements trough securitizations increase regulatory capital ratios and free up regulatory capital. Fourth, securitization allows banks to increase their profitability through “gains on sale”.
However, financial intermediation theories point out severe concerns over the effects of such transactions. A single lender has strong incentives to monitor stemming from holding illiquid loans on its balance sheet, while separating loans’ originator and the bearer of loans’ default risk might induce lax screening (Diamond, 1984). Consistently, the recent financial crisis has shown a large rate of delinquencies among the heavily securitized non-agency mortgages.
*
Department of Economics and Management,University of Padova.
ǂ
Additionally, securitization generates frictions (Ashcraft and Schuermann, 2008). The transferor of loans has superior information with respect to the transferee and this creates moral hazard and adverse selection problems. Rajan (2006, p. 500) adds to those concerns the idea that the changes in the financial sector have altered managerial incentives, which in turn have altered the nature of risks undertaken by the system, with potential distortions. Therefore, understanding the determinants of risk taking behaviors in the banking industry and the role of equity and risk taking incentives is of prominent importance because several factors that are unique to this setting affect risk-taking strategies.
First, financial institution being highly levered have incentives to engage in excess risk-taking, as shown by Jensen and Meckling (1976). Second, financial institutions raise debts trough depositors or the direct access to Central Banks and, as a consequence, the increase in the level of risk does not necessarily translate into an increase in the cost of debt. Typically, depositors are small uninformed investors with deposits insured by the government as thus they lack the incentives and the abilities to monitor investments’ decision and risk profile. Third, because the failure of one bank may generate a contagion effect, governments provide both explicit and implicit guarantees. As a consequence, the debt markets do not adjust the terms of their credit to account for the change in the bank risk profile. Consistent with this view, Haldane (2011) documents that in the pre-crisis period the credit default swap markets did not distinguish strong from weak banks.
Therefore, given the absence of debt markets constrain in the level of risk, risk incentives stemming from stock and option compensation might have a free reign in banks. This problem is further exacerbated if accounting regimes reduce the efficacy of capital adequacy requirements aimed at limiting risk taking behaviors.
To address our research questions we collect data from 10-K filings on the percentage of loans securitized and the amount of losses recorded on these loans for a sample of US financial institutions for the period 2003-2009. Moreover, we retrieve data on the financial institutions most involved in the securitization of subprime loans from a proprietary database that collects information on issuer of subprime securitizations in the US. We conduct our analysis in four steps, each of which speaking to the role of CEO’s equity and risk incentives in boosting securitizations and in motivating executives to transfers risks to outside investors. In our research design we control for CEO’s incentives being potentially endogenous with respect to securitization using a two-stage least-squares (2SLS) approach.
to the quality of securitization disclosure. This result suggests that CEOs incentivized on risk were less prone to provide information on the quality of loans transferred off-balance. This finding further corroborates the idea that risk incentives have motivated CEOs to opportunistically take advantage from information asymmetry generated by securitization transactions. Fourth, we document that before the collapse of the subprime mortgage market in 2007, financial institutions involved in the securitization of subprime loans largely over performed other banks in terms of stock returns and accounting earnings. On the contrary, starting from 2007, subprime securitizers recorded worse performances than other financial institutions that were not involved in subprime securitization. Moreover, subprime securitizers were able to distribute more dividends than the peers. This is consistent with the fact that by securitizing risky loans banks were successful in boosting stock prices, increasing earnings and allowing dividend distribution but the risks undertaken turned out to be extremely costly. This paper contributes to several research streams. First, we contribute to the debate about compensation and risk taking in financial institutions showing that highly incentivized CEOs have used securitization to hide risks while betting on them. At the best of our knowledge this is the first paper that provide evidence that compensating CEOs of financial institutions as CEOs of industrial companies might be detrimental, supporting John et al. (2000, p. 97) analytical model which purports for a “a prominent role for managerial compensation in bank regulation”. Second, we add to the emerging research strand investigating the role of CEO’s compensation in the financial crisis. Fahlenbrach and Stulz (2011) provide evidence that banks where CEOs had high equity incentives performed significantly worse during the crisis than banks where CEOs had low incentives. We complement this result as we show that CEOs with high equity incentives systematically engaged in securitization transactions to a larger extent than CEOs with low levels of equity compensation and that they also securitized risky loans such as subprime mortgages. Third, we add to the growing research stream analyzing the determinants and effects of securitization transactions (Chen et al. 2008; Landsman et al. 2008; Dechow and Shakespeare 2009; Dechow et al. 2010; Amiram et al. 2011; Cheng et al. 2011; Barth et al. 2012). We contribute to this debate by focusing the analysis on the financial industry and documenting the relationship existing between CEO’s equity compensation and securitization transactions considered a powerful tool to boost performance. We therefore bring into the research framework direct evidence about one of the fundamental causes underlying securitization transactions that have been overlooked by previous literature. Fourth, at the best of our knowledge this paper is the first to formally investigate the level of disclosure linked to securitization transactions as a proxy for CEO’s opportunistic behaviors.
Concluding, our results answer to the increasing demand for evidence on the role of CEO’s incentives on the financial crisis that led economists to claims that “we're all paying now because skewed financial incentives led to too many big bets” (Solomon and Paletta, 2009).
2. BACKGROUND
The securitization process, illustrated in Figure 1, substitutes the close relationship between borrower and lender with a long chain which starts when the originator, typically a commercial bank or another financial institution, generates loans. The originator transfers the loans to a special purpose entity (SPE) becoming a sponsor of the SPE. The role of the SPE is to manage the loan pool and issue ABSs that give investors the right to receive the cash flows originated from the underlying loans. When the SPE issues ABSs, it divides them into different tranches (senior, mezzanine and junior) which have different returns and levels of risk, as reflected by ratings received by rating agencies. Finally, the amounts paid by the investors for the ABSs are transferred to the originator/sponsor that thus replaces the illiquid loans previously held in the balance sheet with cash.
Figure 1. The figure represents a typical securitization process
This long chain linking borrowers with investors is a mix of on balance and off-balance sheet conduits that generate at every additional link in the chain an increase in the scope of information gaps (Chen et al. 2008). These information asymmetries combined with the favorable accounting treatment prescribed by SFAS 140 generate the opportunities to hide the risks generated and to bet on them.
Under SFAS 140, almost all securitizations were accounted for as a sale with the consequence that loans are derecognized from the balance sheet of the originator. Two are the most critical issues about the accounting for securitization: a) derecognition; and b) consolidation. SFAS 140 using a “financial component approach”1
allows to decompose assets into a variety of components whose accounting treatment depends on whether the transferor has surrendered control or not. Moreover, to eliminate definitively assets from balance sheet, the transferor has also to avoid the consolidation of SPEs (special purpose entities). Under SFAS 140 a QSPE (qualified special purpose entity) was “automatically” excluded from consolidation and the accounting standard required that a qualifying SPE has
[image:6.612.58.533.222.488.2]
FIGURE I
The Securitization Process
B orrow er A
O riginator SPE
R ating A gencies
Investors
$ $ $
Loans LoanPool A B Ss
B orrow er B
…
to be demonstrably distinct from the transferor and significantly limited in its activities. Understanding whether a SPE is a QSPE required judgment and involved discretionality typically used to avoid the consolidation of the vehicle.
A central point surrounding securitizations is that these transactions might have reduced the incentives of financial intermediaries to carefully screen borrowers. For a lender to screen and monitor it must be given appropriate incentives and this can be provided by the illiquid loans on its balance sheet (Holmström and Tirole 1997; Diamond and Rajan 2009). When banks replace illiquid loans with cash thanks to securitization, they might lose the appropriate level of incentives to properly monitor the quality of loans granted. In this line, Keys et al. (2010) investigate the relationship between securitization and screening standards in the context of subprime mortgage loans and find that existing securitization practices did adversely affect the screening incentives of subprime lenders.
By eliminating loans from the balance sheet, securitization transactions also provide the originator with the benefit of reducing risk based capital (Jones, 2000; Acharya and Richardson, 2009). The critical point is that even when the bank’s originator buys back the most junior tranches of ABSs, loans are eliminated from banks’ balance sheet. Because of this explicit guarantee that represents an important credit enhancement mechanism, the bank originator still continues to bear the risks arising from the loans. Consistent with the view that securitizations do not lead to a shift of the risks of the underlying loans, Barth et al. (2012) show that the bond market perceive firm’s credit risk as associated with both the retained and the non-retained portion of securitized assets. Moreover, Landsman et al. (2008) show that the stock market treats securitized assets and liabilities held by a SPE as belonging to the sponsor-originator. However, because of the lack of coordination among accounting standards, regulatory capital requirements and tax law, an originator can increase the income and the level of risk without increasing the required TIER 1.
Finally as the interest rate of the pool of loans increases, the earnings arising from a securitization increase too. Therefore the more the subprimes securitized the greater the earnings realized, but because of the implicit and explicit guarantee provided by the originator bank, the earnings are deeply rooted into risks2. Additionally, securitizations with further involvement, as in the presence of retained interest, do not trigger a taxable sale event, thus generating a greater positive impact on income.
Because banks’ risk profile is likely to be affected by CEO’s equity compensation and most securitization transactions appear to be deeply rooted into risk, we analyze whether highly incentivized CEOs’ use securitizations to reduce the perceived risk while betting on it. The idea that compensation programs are one of the determinants of the misalignment of incentives and conflicts of interest that permeate the “securitization chain” has also been confirmed by the Bank for International Settlements (2011), thus making the research question even more intriguing and timely.
3. TESTABLE PREDICTIONS
We develop our predictions distinguishing among two separate but complementary aspects of CEO’s stock and option compensation: equity and risk incentives. Equity incentives are defined as the variation in executive’s wealth caused by a change in stock price and
2
therefore measure the strength of CEO’s incentives to increase the value of firm’s stock. Risk incentives, instead, are defined as the variation in executive’s wealth caused by a change in stock price volatility and therefore measure the strength of CEO’s incentives to increase firm’s risk profile (Core et al., 2003).
Equity incentives and securitization activity
When securitization transactions qualify for sale accounting, as almost all securitizations did under SFAS 140, they offer several benefits that make them particularly appealing to the originator. First, securitization enables banks to optimally choose their exposure to the credit risk of loans generated (Jiangli and Pritsker 2008). In fact, through securitization activities banks can decide which loans to fund on balance sheet and which to sell outside. Second, securitization enables banks to replace illiquid loans with cash, thus improving banks’ liquidity and multiplying banks’ resources available for being invested in the lending activity. Furthermore, as previously discussed, if the financial institution is subject to regulatory capital requirements, securitization transactions under US GAAP allow to increase regulatory capital ratios and free up regulatory capital. Third, securitization allows banks which are efficient in originating certain asset types, for instance credit card receivables, to improve market share without creating balance sheet concentration (Bank for International Settlements, 2011). Fourth, if an originator is able to achieve off-balance sheet accounting treatment, the removal of balance sheet assets improves certain financial ratios, such as the leverage capital ratio or return on assets. In addition, sales treatment could increase non-interest income, which combined with the capital requirements improve the originator’s return on equity (Bank for International Settlements, 2011). Fifth, securitization allows banks to increase their profitability through “gains on sale”. In fact, under SFAS 140 banks could record a gain equal to the difference between the allocated book value of sold components and net proceeds from securitization. Moreover, as the interest rate of the pool of loans increases the earnings arising from a securitization increase too. Thus the more the subprime loans securitized the more the earnings realized but because of the implicit and explicit guarantee provided by the originator the earnings are deeply rooted into risks3. In fact subprime-mortgage-related positions, even the most junior, generally have experienced good investment performance as long as home prices appreciate and debt markets are sufficiently liquid (Ryan, 2008).
In a nutshell, securitizations under US GAAP had the potential of greatly improving banks’ shareholder value: simply put, securitization gives the bank more options for funding its activities and managing its risk profile and, all else equal, expanded opportunities should increase bank’s value (Jiangli and Pritsker, 2008). Moreover, the profit opportunities offered by subprime securitizations have led experts in the industry to define these financial transactions as “a machine that just manufactures earnings out of thin air” (Browning, 2007). Given securitization’s potentiality for boosting shareholder value, we conjecture that CEOs whose wealth is more tightly linked to firm’s stock price have greater incentives to engage in securitization of risky and non risky loans than CEOs with low equity incentives, in order to maximize the value of their equity holding. As a consequence, we posit the following research hypothesis:
H1: Equity incentives positively affect the securitization of risky and non risky loans
Risky incentives and subprime securitization activity
CEO’s equity compensation can also influence the riskiness of the securitization transactions undertaken.
Suppose, for instance, that the bank can invest either in a subprime loan pool or in a prime loan pool, both with a duration of 10 years. If the bank chooses the subprime loans there is an
percent chance that the investment will create a wealth of W0 in the next ten years and a
(1-) percent chance that the investment will create a wealth of W2 in the same time period.
Alternatively, the bank can grant the prime loans that create a wealth of W1 with =100, being
W2 >> W1 > W0. Since shareholders are well diversified they would prefer the risky scenario
and betting on the possibility of increasing bank’s wealth to W2. In fact, as holders of a call
option on the firm which can be exercised at any time when firm’s equity exceed the value of debt (Merton, 1974), shareholders benefit entirely for the upside with limited losses on the downside. Thus in companies with limited liability shareholders have a strong incentive to increase the riskiness of the investments. In order to induce CEOs to choose the risky scenario, shareholders can give CEOs option grants thus increasing their wealth sensitivity to changes in stock volatility. In this line, Coles et al. (2006) document that higher sensitivity of CEO wealth to stock volatility leads executives to implement riskier policy. Nonetheless, as stock and option-based compensation increases the executive’s personal portfolio becomes less diversified and the executive becomes more risk averse and more likely to pursue strategies aimed at mitigating the risk of the institution (Smith and Stulz, 1985). Moreover high levels of perceived risks can negatively affect a manager’s tenure and job security (Ronen and Sadan, 1981; Carlson and Bathala, 1997) and can harm her reputational and human capital. As a consequence, it could be possible that, even if CEOs are provided with risk incentives, they prefer the low risk scenario that ensures W1 instead of betting on risky lending
activities that could deliver W2 but also W0.
The use of securitization allows to deeply changing the timing of the pay-off for the undiversified executive in the presence of high risk incentives. In fact, the executive can choose to invest in the subprime loan pool and securitize it. In this scenario the bank immediately records the gains and revenues and get W2 while the negative outcome W0
remains delayed over time until the bank has to eventually record the loss on the retained interest. As a consequence, the securitization makes the risky scenario much more appealing to undiversified executives that are incentivized on risk. In fact, by changing the timing of the payoff, the securitization allows undiversified but risk incentivized CEOs to bet on risky scenarios while delaying any negative outcome related to them that might negatively affect their tenure, job security and human capital. This argument is consistent with results in Grant et al. (2009) showing that risk-averse managers incentivized to take risks smooth income with the goal to reduce the perceived risk and create accounting reserves to cover potential losses. Therefore we expect a positive relationship between CEO’s risk incentives and the securitization of risky loans.
Thus we posit the following prediction:
4. DATA
4.1 Sample Selection
For the purpose of our analysis we identify all financial institutions (SIC codes between 6000-6300) available on Execucomp dataset in fiscal year 2003 and we keep all observations with an identifiable CEO throughout 2003-2009. In order to mitigate any possible survivorship bias, we augment our sample including financial institutions that have been delisted during the financial crisis but that have at least five years of data starting fiscal year 2003, thus assuring that we have information on these institutions at least until 2007 when the crisis has started. For our sample banks, we hand collect data on securitization activities from 10-K filings using disclosure under SFAS 140; we retrieve control variables from Compustat, Compustat Bank and CRSP; and we collect compensation data from Execucomp dataset and 10-K filings. We ended up with a final sample of 526 firm-year observations over the period 2003-2009 generated by 81 unique financial institutions. Table I describes the sample selection process and the distribution of observations over time. Out of 526 firm-year observations, about the 40% reports securitization transactions thus confirming that the use of securitization practices has been a concentrated phenomenon in the financial industry.
Table I. The table describes the sample selection process and the sample composition
670
128 16
Firm-Year Observations 526
Unique Firms 81
Year # obs
2003 78
2004 76
2005 76
2006 78
2007 79
2008 72
2009 67
Total 526
Firm-year observazions without securitizations 318 60%
Firm-year observazions with securitizations 208 40%
[image:10.612.100.497.352.705.2]Total 526 100%
TABLE I
Sample Selection and Composition
Financial institutions with missing information on other variables Financial institutions (SIC codes between 6000-6300) available on Execucomp dataset in fiscal year 2003
minus
4.2. Variable Measurement
Securitization
We hand collect data on banks’ securitization activities from 10-K filings. Specifically, we use disclosure under SFAS 140 that requires institutions to provide information on securitized financial assets4. In order to rule out the possibility that our analysis is driven by a size effect, we scale loans securitized by the amount of total loans managed (sum of total securitized and withheld loans) by the bank and create the variable Securitization. For financial institutions engaging in securitization transactions we also retrieve the amount of credit losses on securitized loans and we create a variable (Loss Secur) that computes the percentage of credit loss on securitized loans. We interpret this variable as a proxy of the riskiness of securitization transactions undertaken by the bank. Given that most losses on securitized assets have been recorded during the financial crisis, it is an essential feature of our research design to collect data until 2009 and not limiting the analysis to the pre-crisis period5. Similarly, we create a proxy of the riskiness of non-securitized loans (Loss Loans) defined as the percentage losses on loans withheld on balance sheet. Finally we define a variable (Diff in Losses) that computes the difference between the percentage loss on securitized assets and the percentage loss on withheld loans. Thus, higher values of Diff in Losses indicate that executives transferred risk embedded in loans to outside investors through securitization. CEO’s incentives
As emphasized by Core et al. (2003), executive incentives from stocks and options are properly measured only considering portfolio incentives. In fact, the amount of newly granted restricted stocks and options is not sufficient for evaluating the amount of incentives the executive is provided with (Yermack 1995). We measure CEO’s equity incentives (Equity Incentives) as the dollar change in the value of executive’s stock and option holdings that would come from a one percentage point increase in the company stock price. The sensitivity of CEO’s stock holding is simply computed multiplying the number of shares held by the 1% of the stock price at fiscal year-end, while for computing the sensitivity of CEO’s option holding we take the partial derivative of the Black-Scholes equation with respect to stock price (option’s Delta) as shown in Appendix A. Starting from the fiscal year 2006, Execucomp reports all the information necessary for computing the sensitivity of CEO’s equity portfolio to a one percentage point increase in the stock price. For observations preceding 2006 we use Core and Guay (2002)’s methodology for estimating the delta of executives’ option portfolio. In particular, CEO’s options are divided into three groups (options awarded during the year, options awarded in previous years but not yet exercisable and options granted in previous years and currently exercisable) and separate estimates of the delta are computed. Core and Guay (2002) show that their proxy captures more than 99% of the variation in option portfolio value and sensitivity. To reduce the influence of extreme values, in regression analyses we use the log transformation of Equity Incentives.
4
Two caveats apply. First, banks do not report data on non material securitizations and we consider these amounts equal to zero. On the contrary if the bank reports evidence of securitizations but the disclosure provided in the 10-K filing does not allow to understand the exact amount of assets securitized the observation is deleted. Second, disclosure under SFAS 140 applies to securitization transactions in which the bank has retained interests. Since this is the case for most securitizations the effect on the analysis is trivial.
5
We measure CEO risk-related incentives (Risk Incentives) in a methodology similar to that used by Rogers (2002, 2005) and Grant et al. (2009), namely the Vega of CEO’s stock options divided by their Delta. We compute CEO’s option Vega as the sensitivity of CEO’s option holding to a unit change in stock price volatility by using the first derivative of the Black-Scholes option-pricing model in relation to firm’s volatility as described in Appendix A. When necessary we used Core and Guay (2002)’s methodology to retrieve the data for computing options’ Vega and Delta. Computing CEO’s risk-incentives using the Vega-to-Delta ratio has the advantage of reducing multicollinearity problems between the sensitivity of CEO’s equity portfolio to stock price and stock volatility that is particularly severe in small samples.
In the analysis we also control for the age of the CEO (Log Age). Including CEO’s age in the analysis allows us to control for potential effects linked to CEO’s career concerns that might influence securitization activities. The underlying idea is that career concerns are higher for young versus old managers since they have to influence market’s beliefs about their ability (Holmström, 1999).
Bank’s characteristics
In an attempt to control for confounding variables that might influence the level of securitization observed we include in the multivariate analysis a set of bank-related characteristics. B_M is the equity book-to-market ratio computed as the book value of equity divided by its market value at fiscal year-end; Returns is bank’s annual market returns; Size is the natural logarithm of total assets; Change Assets is the percentage change in total assets with respect to the previous year as control for potential M&A activities; Change Tier 1 proxies for regulatory capital constraints and it is computed as the percentage change in Tier 1 with respect to the previous year; Interest Income is net interest income divided by total revenues as a proxy for bank business model; GDP is the gross domestic product that controls for macroeconomics trends that might influence securitization activities. Moreover all analyses include year fixed effects.
4.3. Descriptive Statistics and Correlations
Table II, Panel A reports descriptive statistics of the main variables used in the analysis while Panel B presents Pearson correlation coefficients. Data on Securitization show that, on average, financial institutions in our final sample securitize about the 11% of managed loans. The highly asymmetric distribution of the variable is driven by a large part of observations taking value of zero because of no (or immaterial) securitization activities6. When computed only considering banks involved in securitization transactions, untabulated results show that the average value of Securitization is 0.27 with banks in the 90th percentile securitizing an amount of loans equal to the 64% of the managed portfolio. Our research design aims at exploiting this variability in the data in order to analyze if CEO’s incentives can explain part of it.
As expected, the correlation matrix reported in Panel B shows that old CEOs and CEOs in large bank have higher levels of equity incentives than their colleagues that are in the early stage of the career or that guide smaller institutions. The level of equity incentives is also strongly positively correlated with bank’s performance and growth opportunities while the relation reverses sign when examining risk incentives. On the contrary, large financial institutions provide CEOs not only with high levels of equity incentives but also with high risk incentives with respect to smaller banks.
Table II. Panel A presents descriptive statistics for the main variables included in the analysis while Panel B reports Pearson correlation coefficients. Securitization is the total amount of financial assets that have been transfer off-balance through securitization, divided by the amount of total loans managed; Diff in Losses is the difference between the percentage of credit losses on securitized loans and the percentage of credit losses on withheld loans; Equity Incentives is the logarithm of the dollar change in the value of CEO's stock and option holdings that would come from a one percentage point increase in the company stock price; Risk Incentives is the Vega of CEO’s stock options divided by their Delta; Log Age is the log transformation of CEO’s age; B_M is the book value of equity divided by its market value; Returns is annual returns; Size is thelogarithm of total assets; Change Assets is the percentage change in total assets with respect to the previous year; Change Tier 1 is the percentage change in Tier 1 with respect to the previous year; Interest Income is net interest income standardized by total revenues
*,**,*** indicate statistical significance at 10%, 5%, 1% level, respectively. P-values are two tailed.
N Mean SD p25 p50 p75
Securitization 526 0.107 0.204 0.000 0.000 0.108 Diff in Losses 162 0.007 0.023 -0.005 0.000 0.019 Equity Incentives 526 5.786 1.786 4.849 5.947 7.033 Risk Incentives 526 0.905 0.721 0.400 0.783 1.209 Log Age 526 4.031 0.115 3.951 4.043 4.111 B_M 526 0.806 0.881 0.399 0.550 0.822 Returns 526 0.033 0.395 -0.120 0.096 0.238 Size 526 10.175 1.717 8.919 9.905 11.348 Change Assets 526 0.112 0.171 0.014 0.084 0.170 Change Tier 1 526 0.026 0.185 -0.062 0.000 0.078 Interest Income 526 0.427 0.164 0.334 0.434 0.534
1 2 3 4 5 6 7 8 9 10
1 Securitization 1.000
2 Diff in Losses 0.121 1.000
3 Equity Incentives 0.271*** 0.073 1.000
4 Risk Incentives 0.046 0.068 -0.267*** 1.000
5 Log Age -0.185*** -0.195* 0.216*** -0.034 1.000
6 B_M 0.011 0.043 -0.361*** 0.480*** 0.007 1.000
7 Returns 0.011 0.078 0.249*** -0.494*** 0.010 -0.496*** 1.000
8 Size 0.396*** 0.100 0.432*** 0.231*** 0.061 0.018 -0.099* 1.000
9 Change Assets 0.086* 0.071 0.265*** -0.207*** 0.007 -0.223*** 0.198*** 0.060 1.000
10 Change Tier 1 -0.001 -0.015 -0.067 0.120** -0.002 0.110* 0.005 0.024 -0.090* 1.000 11 Interest Income -0.307*** -0.040 -0.286*** -0.021 -0.059 -0.052 0.056 -0.435*** -0.003 0.031
Panel A: Descriptive Statistics of the main variables
Panel B: Correlation Matrix
TABLE II
5. EMPIRICAL ANALYSES
Our two research hypotheses predict that CEO’s equity incentives determine both the total amount of securitizations undertaken by financial institutions and the quality of loans securitized, while risk-related incentives only determine the securitizations of risky loans. To test the effect of equity compensation on banks’ total securitization activities we first group banks into quintiles according to the level of CEO’s equity incentives and report the amount of securitization for each group of financial institutions. Table III, Panel A shows that as one moves from the first to the fifth quintile of the distribution of CEO’s equity incentives, the amount of loans securitized steadily increases thus providing preliminary support for the role of CEO’s equity incentives in boosting securitizations. To better investigate H1 we estimate the following Tobit model with year fixed effects and heteroskedasticity-robust standard errors clustered at firm-level:
Securitizationi,t = 0 + 1Equity Incentivesi,t + 2Risk Incentivesi,t + 3Log Agei,t + 4B_Mi,t +
5Returnsi,t + 6Sizei,t + 7Change Assetsi,t + 8Change Tier 1i,t + 9Interest
Incomei,t + 10GDPi,t + εi,t (1)
where i,t indicate, respectively, firm and year observations and all the variables have already been defined. Our research hypotheses predict a positive and significant α1 and an
insignificant α2. When estimating (1) it is necessary to use a censored regression model
because Securitization takes the value of zero for a large part of the sample and it is a continuous random variable over strictly positive values. As a consequence a linear model would not work properly (Wooldridge, 2002).
The results from equation (1), reported in columns 1 in Panel B of Table III, strongly support H1 documenting a positive and significant relation between securitization and CEO’s equity incentives while no relation is detected between securitization and CEO’s risk incentives. Given the variability in the distribution of the dependent variable, it could be argued that results might be partially driven by some extreme observations. In order to address this concern we divide our sample in three groups and mark them with an ordering variable taking the value of:
1 if the bank does not engage into securitizations;
2 if the bank engages into securitizations and Securitization is below the sample median of securitizing institutions;
3 if the bank engages into securitizations and Securitization is above the sample median of securitizing institutions.
Table III. Panel A tabulates the amount of securitization according to the quintile of the distribution of CEO’s equity incentives. Panel B reports estimate results from model (1). In Column 1 the dependent variable is the continuous variable Securitization, in Column 2 the dependent variables is an ordering variable taking the value of 1 if the banks has zero securitization, 2 if the amount of securitization is positive but below the median of securitizing banks and 3 otherwise; in Column 3 the sample is truncated at fiscal year 2007 and the dependent variable is Securitization. Tobit models are used in columns 1 and 3 while an ordered probit model is used in column 2.
Securitization is the total amount of financial assets that have been transfer off-balance through securitization, divided by the amount of total loans managed; Equity Incentives is the logarithm of the dollar change in the value of CEO's stock and option holdings that would come from a one percentage point increase in the company stock price; Risk Incentives is the Vega of CEO’s stock options divided by their Delta; Log Age is the log transformation of CEO’s age; B_M is the book value of equity divided by its market value; Returns is annual returns; Size is the logarithm of total assets; Change Assets is the percentage change in total assets with respect to the previous year; Change Tier 1 is the percentage change in Tier 1 with respect to the previous year; Interest Income is net interest income standardized by total revenues; GDP is the Gross Domestic Product *,**,*** indicate statistical significance at 10%, 5%, 1% level, respectively. Heteroskedasticity-robust standard errors clustered at firm-level are reported in brackets. P-values are two tailed.
Panel A
Securitization
Equity Incentives Quintile Mean (N=526)
Lowest 0.032
2nd quintile 0.070
3rd quintile 0.083
4th quintile 0.140
Highest 0.212
H0: Lowest - Highest = 0 t = - 7.038 p-value = 0.000
Panel B
Dependent Variable:
[image:15.612.144.475.88.530.2]Equity Incentives 0.072*** 0.217*** 0.095***
[0.026] [0.083] [0.032]
Risk Incentives 0.026 0.069 0.017
[0.044] [0.142] [0.060]
Log Age -1.081*** -3.090*** -1.078***
[0.366] [1.036] [0.391]
B_M 0.081** 0.268** 0.235*
[0.033] [0.118] [0.127]
Returns 0.030 0.089 0.002
[0.045] [0.153] [0.106]
Size 0.098*** 0.412*** 0.079***
[0.024] [0.077] [0.029]
Change Assets 0.019 0.015 0.032
[0.118] [0.410] [0.122]
Change Tier 1 0.043 0.136 0.008
[0.076] [0.257] [0.104]
Interest Income -0.355 -0.886 -0.339
[0.226] [0.828] [0.255]
GDP -0.076 -0.096 -0.145
[0.151] [0.448] [0.088]
Year Dummies YES YES YES
Observations 526 526 387
(Pseudo) R2 40.6% 25.7% 40.7%
Securitization Until 2007 Tobit (3) TABLE III (1) Tobit Securitization (2) Ordered Probit Securitization
Continuous variable Three Groups
Results from Table III also show that banks with higher book-to-market ratios engage more in securitizations than financial institutions with lower book-to-market ratios. A possible explanation is that these banks have higher incentives to securitize loans because they have lower growth opportunities and thus more difficulties in collecting funds. Data also show that old CEOs undertake less securitizations than their young colleagues and this is consistent with young managers having higher career concerns and thus trying to boost shareholder value through securitizations to a larger extent.
A possible concern that might arise when estimating equation (1) relates to the fact that CEO’s equity and risk incentives can be endogenous with respect to banks’ decision of engaging into securitizations. This is the case if exogenous shocks to the regression residuals affect both CEO’s compensation structure and securitization strategies. Moreover model (1) might be affected by a reverse causality bias. To address this problem we use an instrumental variable (IV) approach. It is well known that the challenge faced by researchers when dealing with IV models is to identify valid and strong instruments. These are variables that are strongly correlated with the endogenous variable under investigation but that are not correlated with the error term in the second stage equation7. In order to identify such an instrument we exploit a change in US GAAP that took place in 2000. Here it is important to note that the securitization business model and the subprime securitization market developed thanks to the possibility offered by SFAS 140 to retain interests in securitized assets as credit enhancement mechanism and applying sale accounting to the transferred assets. This was possible thanks to the Financial Components Concept included in SFAS 140. Without this concept most securitizations would have to be accounted for as secured borrowing. The Financial Components Concept has been introduced in 2000 by SFAS 140 while the prior SFAS 125, Accounting for Transfers and Servicing of Financial Assets and Extinguishment of Liabilities (1996) did not contain this provision. As a consequence, the recent securitization and subprime business model investigated in the paper has emerged after this change in accounting standards. Data reported in Table IV document that after the discussed change in accounting standards in 2000, the securitization market sharply increased, specifically the subprime securitization market that was almost non-existing beforehand. Thus we use as instrument for CEO’s equity and risk incentives during the period 2003-2009 the level of equity and risk incentives that the same CEO had before 20008. The level of incentives held by the CEO in the same bank (or in the other banks/firms in which she has served) before 2000 is likely to be correlated with her future level of incentives but cannot be correlated with a securitization business model that did not exist9.
Table V presents results from estimating model (1) using a two-stage least squares (2SLS) approach. The high R2 reported in the first stage suggest that variables included in the model are good predictors of the endogenous variables. Estimate results from the second stage strongly corroborate findings reported in Table III and thus confirm the support to H1.
7
See Larcker and Rusticus (2010) for a useful discussion of the use of instrumental variables in research
8
Due to data limitation we have considered compensation data back to 1992.
9
Table IV. Data have been retrieved from Inside Mortgage Finance Publication. MBS is the acronym of Mortgage-Backed Securities Dollars in Billions
Year Prime MBS Subprime MBS Total MBS Average 1997-1999 Prime MBS
Average 1997-1999 Subprime MBS
Average 1997-1999 Total MBS
1997 423 66 489 687 70 756
1998 860 83 943
1999 777 60 837
2001 1,246 98 1,345
2002 1,641 176 1,817
2003 2,393 269 2,662 1,496 444 1,940
2004 1,306 521 1,827
2005 1,314 797 2,112
2006 1,202 814 2,016 118% 539% 157%
2007 1,372 433 1,804
[image:17.792.88.700.203.399.2]% Increase w.r.t. pre 2000 TABLE IV
Securitization of Home Mortgages pre and post 2000
Average 2001-2007 Prime MBS
Average 2001-2007 Subprime MBS
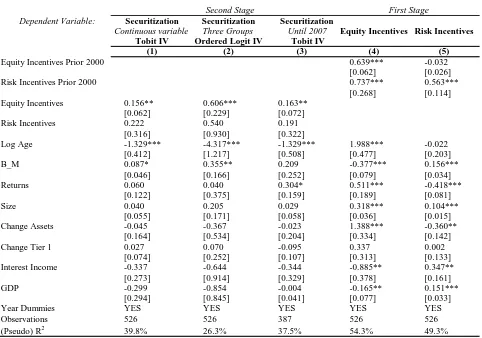
Table V. The table reports the first and second stage estimates from model (1) using a 2SLS approach. We use as instrument for CEO’s equity incentives the level of equity incentives the same CEO had before 2000 (Equity Incentives Prior 2000) and as instrument for CEO’s risk incentives the level of risk incentives the same CEO had before 2000 (Risk Incentives Prior 2000).
Securitization is the total amount of financial assets that have been transfer off-balance through securitization, divided by the amount of total loans managed; Equity Incentives is the logarithm of the dollar change in the value of CEO's stock and option holdings that would come from a one percentage point increase in the company stock price; Risk Incentives is the Vega of CEO’s stock options divided by their Delta; Log Age is the log transformation of CEO’s age; B_M is the book value of equity divided by its market value; Returns is annual returns; Size is the logarithm of total assets; Change Assets is the percentage change in total assets with respect to the previous year; Change Tier 1 is the percentage change in Tier 1 with respect to the previous year; Interest Income is net interest income standardized by total revenues; GDP is the Gross Domestic Product;
*,**,*** indicate statistical significance at 10%, 5%, 1% level, respectively. Heteroskedasticity-robust standard errors clustered at firm-level are reported in brackets. P-values are two tailed.
Dependent Variable: Securitization
Until 2007
Tobit IV
[image:18.792.151.633.79.417.2]Equity Incentives Prior 2000 0.639*** -0.032
[0.062] [0.026]
Risk Incentives Prior 2000 0.737*** 0.563***
[0.268] [0.114]
Equity Incentives 0.156** 0.606*** 0.163**
[0.062] [0.229] [0.072]
Risk Incentives 0.222 0.540 0.191
[0.316] [0.930] [0.322]
Log Age -1.329*** -4.317*** -1.329*** 1.988*** -0.022
[0.412] [1.217] [0.508] [0.477] [0.203]
B_M 0.087* 0.355** 0.209 -0.377*** 0.156***
[0.046] [0.166] [0.252] [0.079] [0.034]
Returns 0.060 0.040 0.304* 0.511*** -0.418***
[0.122] [0.375] [0.159] [0.189] [0.081]
Size 0.040 0.205 0.029 0.318*** 0.104***
[0.055] [0.171] [0.058] [0.036] [0.015]
Change Assets -0.045 -0.367 -0.023 1.388*** -0.360**
[0.164] [0.534] [0.204] [0.334] [0.142]
Change Tier 1 0.027 0.070 -0.095 0.337 0.002
[0.074] [0.252] [0.107] [0.313] [0.133]
Interest Income -0.337 -0.644 -0.344 -0.885** 0.347**
[0.273] [0.914] [0.329] [0.378] [0.161]
GDP -0.299 -0.854 -0.004 -0.165** 0.151***
[0.294] [0.845] [0.041] [0.077] [0.033]
Year Dummies YES YES YES YES YES
Observations 526 526 387 526 526
(Pseudo) R2 39.8% 26.3% 37.5% 54.3% 49.3%
TABLE V
CEO Incentives and Securitization with Endogeneity
Equity Incentives Risk Incentives
Three Groups
(4) (5)
Second Stage First Stage
Securitization
Continuous variable
Tobit IV
Securitization
(1) (2) (3)
We now move the focus of the analysis from banks’ overall securitization activity to the quality of loans securitized and banks’ decision to transfer risks to outside investors through securitization. Table VI provides univariate support for our hypothesis that CEO’s equity and risk incentives motivate executives to securitize low-quality assets and transfer risk to outside investors through securitization. Specifically we divide the sample into four groups according to the median value of CEO’s equity and risk incentives (High vs Low)10. Table VI, Panel A tabulates the mean values of the percentage loss on securitized loans (Loss Secur) for each level of CEO’s incentives while Panel B tabulates the difference between the percentage loss on securitized loans and withheld loans (Diff in Losses). We interpret the first metric as a proxy for the riskiness of loans securitized because risky securitized loans are more likely to suffer credit losses. The second metric, instead, investigates the opportunistic behavior of CEOs when engaging into securitizations because it compares the losses recorded on loans transferred off-balance and losses on loans withheld in the balance sheet.
Table VI. The table has been created by classifying observations with available data on losses on securitized loans (N=162) into four groups (High/High, High/Low, Low/High, Low/Low) according to the median value of CEO’s equity and risk incentives. Panel A reports, for each group, the mean value of the percentage loss on securitized loans (Loss Secur) while Panel B reports the mean value of the difference between the percentage loss on securitized loans and withheld loans (Diff in Losses).
Equity Incentives is the logarithm of the dollar change in the value of CEO's stock and option holdings that would come from a one percentage point increase in the company stock price; Risk Incentives is the Vega of CEO’s stock options divided by their Delta. P-values are two tailed.
10
The sample size is 162 because we have to restrict the analysis to those observations with available data on losses on securitized assets.
Panel A
N= 162
High Low
High 0.031 0.017
Low 0.017 0.009
H0: (High/High) = (Low/Low) t = 3.301 p-value= 0.002
Panel B
N= 162
High Low
High 0.017 0.006
Low 0.003 0.003
[image:19.612.143.474.291.586.2]H0: (High/High) = (Low/Low) t = 2.402 p-value= 0.020 TABLE VI
CEO Incentives and Losses on Securitization
Equity Incentives
Risk Incentives Diff in Losses
Mean Loss Secur
Mean
Risk Incentives
Data from Table VI, Panel A indicate that financial institutions in which the CEO had high equity and risk incentives (group High/High) engaged in risky securitization transactions to a larger extent than banks in which the CEO had low incentives (group Low/Low). Similarly, Panel B shows that CEOs with high equity and risk incentives are more likely to transfer risk to outside investors than CEOs with low incentives as documented by the significantly higher value of Diff in Losses in the group High/High w.r.t. the group Low/Low. In order to better disentangle the effect of CEO’s equity and risk incentives on the quality of loans transferred through securitization we estimate the following model through 2SLS:
Loss Secur (Diff in Losses)i,t = β0 + β 1Equity Incentivesi,t + β2Risk Incentivesi,t + β3Log Agei,t +
β4B_Mi,t + β5Returnsi,t + β6Sizei,t + β7Change Assetsi,t +
β8Change Tier 1i,t + β9Interest Incomei,t + β10GDPi,t + β11Loss
Loansi,t + εi,t (2)
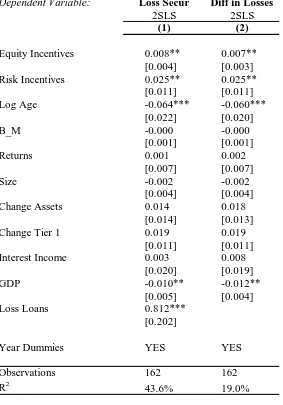
Table VII. The table reports second-stage estimate results from model (2) estimated through 2SLS.
In the untabulated first-stage we use as instrument for CEO’s equity incentives the level of equity incentives the same CEO had before 2000 and as instrument for CEO’s risk incentives the level of risk incentives the same CEO had before 2000.
Loss Secur is the percentage of credit losses on securitized loans; Diff in Losses isthe difference between the percentage loss on securitized loans and the percentage loss on withheld loans; Equity Incentives is the logarithm of the dollar change in the value of CEO's stock and option holdings that would come from a one percentage point increase in the company stock price; Risk Incentives is the Vega of CEO’s stock options divided by their Delta; Log Age is the log transformation of CEO’s age; B_M is the book value of equity divided by its market value; Returns is annual returns; Size is the logarithm of total assets; Change Assets is the percentage change in total assets with respect to the previous year; Change Tier 1 is the percentage change in Tier 1 with respect to the previous year; Interest Income is net interest income standardized by total revenues; GDP is the Gross Domestic Product; Loss Secur is the percentage of credit losses on withheld loans.
*,**,*** indicate statistical significance at 10%, 5%, 1% level, respectively. Heteroskedasticity-robust standard errors clustered at firm-level are reported in brackets. P-values are two tailed. The sample includes securitizers with available data on losses recorded on securitized loans.
Dependent Variable:
[image:21.612.169.452.114.519.2]Equity Incentives 0.008** 0.007** [0.004] [0.003]
Risk Incentives 0.025** 0.025**
[0.011] [0.011]
Log Age -0.064*** -0.060***
[0.022] [0.020]
B_M -0.000 -0.000
[0.001] [0.001]
Returns 0.001 0.002
[0.007] [0.007]
Size -0.002 -0.002
[0.004] [0.004]
Change Assets 0.014 0.018
[0.014] [0.013]
Change Tier 1 0.019 0.019
[0.011] [0.011]
Interest Income 0.003 0.008
[0.020] [0.019]
GDP -0.010** -0.012**
[0.005] [0.004]
Loss Loans 0.812***
[0.202]
Year Dummies YES YES
Observations 162 162
R2 43.6% 19.0%
TABLE VII
CEO Incentives and Risky Securitization
(1) (2)
Loss Secur Diff in Losses
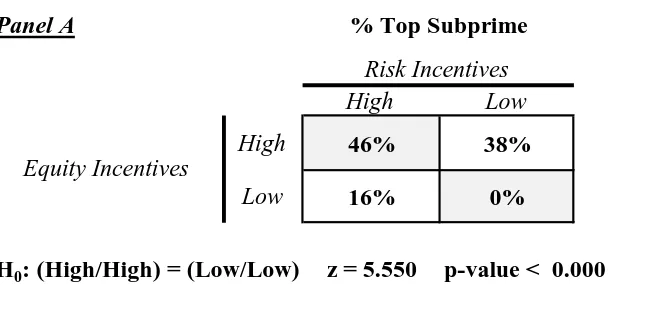
Results from the previous analyses suggest that CEO’s equity incentives are both a determinant of banks’ overall securitization activities and the riskiness of securitized loans while CEO’s risk incentives only determine the risk profile of securitization. We further investigate this point by retrieving data on financial institutions most involved in the securitization of subprime loans. Subprime loans are made to those who have impaired credit and their securitization is the riskiest form of securitization transactions undertaken by financial institutions. Typically, subprime borrowers have low credit ratings and a reasonable chance of defaulting on the debt repayment: as a consequence, financial institutions charge significantly higher rates on subprime loans than prime mortgages. This allows banks to increase their profits from the lending activity and also provides banks with high incentives to include these loans in securitization transactions in order to transfer the associated high risk to outside investors. We retrieve data on the top subprime securitizers from the Mortgage Market Statistical Annual edited by Inside Mortgage Finance Publications. We have data on top subprime securitizers for the period 2000-2007. Even if the Mortgage Market Statistical Annual only reports data for the top financial institutions involved in subprime securitizations it has a very wide coverage of the securitization market with top subprime securitizers disclosed in the dataset covering more than the 80% of overall subprime market. We define a dummy variable (Top Subprime) taking the value of 1 if the financial institution is listed in the Mortgage Market Statistical Annual as top subprime securitizer at least once during the period analyzed, zero otherwise. Table VIII, Panel A compares the percentage of top subprime observations according to the level of CEO’s equity and risk incentives. Two-sample tests of proportion indicates that in the presence of high CEO’s equity and risk incentives the percentage of top subprime securitizers is significantly higher than in the presence of low CEO’s incentives.
Table VIII. Panel A. The table has been created by classifying observations into four groups (High/High, High/Low, Low/High, Low/Low) according to the median value of CEO’s equity and risk incentives. A financial institution is classified as top subprime securitizer if it is disclosed as such in the Mortgage Market Statistical Annual edited by Inside Mortgage Finance Publications. Equity Incentives is the logarithm of the dollar change in the value of CEO's stock and option holdings that would come from a one percentage point increase in the company stock price; Risk Incentives is the Vega of CEO’s stock options divided by their Delta.
P-values are two tailed and are based on two-sample tests of proportion. The sample includes 526 firm-year observations.
Panel A
High Low
High 46% 38%
Low 16% 0%
[image:22.612.146.472.459.616.2]H0: (High/High) = (Low/Low) z = 5.550 p-value < 0.000
TABLE VIII
CEO Incentives and Subprime Securitization
% Top Subprime
Risk Incentives
Table VIII. Panel B. The table reports second-stage estimate results from probit model (3) estimated through 2SLS. In the untabulated first-stage we use as instrument for CEO’s equity incentives the level of equity incentives the same CEO had before 2000 and as instrument for CEO’s risk incentives the level of risk incentives the same CEO had before 2000.
Top Subprime is a dummy equal to one if the financial institution is listed as top subprime securitizer in the Mortgage Market Statistical Annual during the period 2000-2007; Equity Incentives is the logarithm of the dollar change in the value of CEO's stock and option holdings that would come from a one percentage point increase in the company stock price; Risk Incentives is the Vega of CEO’s stock options divided by their Delta; Log Age is the log transformation of CEO’s age; B_M is the book value of equity divided by its market value; Returns is annual returns; Size is thelogarithm of total assets; Change Assets is the percentage change in total assets with respect to the previous year; Change Tier 1 is the percentage change in Tier 1 with respect to the previous year; Interest Income is net interest income standardized by total revenues; GDP is the Gross Domestic Product. *,**,*** indicate statistical significance at 10%, 5%, 1% level, respectively.
Heteroskedasticity-robust standard errors clustered at firm-level are reported in brackets. P-values are two tailed.
Panel B
Dependent Variable:
[image:23.612.97.522.83.552.2]Equity Incentives 1.065*** 0.936*** 0.915*** 0.911**
[0.361] [0.331] [0.298] [0.387]
Risk Incentives 3.797*** 3.535** 2.708** 3.460*
[1.471] [1.714] [1.284] [1.845]
Log Age -1.908 0.114 -0.643 0.216
[2.550] [2.149] [2.201] [2.825]
B_M -0.051 1.868*** -0.102* 2.590**
[0.052] [0.715] [0.060] [1.143]
Returns 1.109* 1.840** 0.794 3.048**
[0.640] [0.872] [0.695] [1.232]
Size 0.271 0.602*** 0.467** 0.487**
[0.243] [0.205] [0.221] [0.205]
Change Assets 0.099 0.848 0.835 0.071
[0.812] [0.937] [0.912] [1.183]
Change Tier 1 0.470 -0.569 1.383* 0.330
[0.607] [0.554] [0.715] [0.850]
Interest Income -0.247 -0.620 0.644 -0.761
[1.566] [1.535] [1.724] [1.688]
GDP -4.474*** -2.838** -4.855*** -1.925*
[1.305] [1.355] [1.621] [1.096]
Year Dummies YES YES YES YES
Observations 526 387 208 163
Pseudo R2 61.8% 68.4% 50.1% 58.6%
(3) (4)
2SLS 2SLS
(2) Top Subprime
(1)
Full Sample Full Sample
Until 2007
2SLS 2SLS
TABLE VIII Subprime Securitization
Top Subprime Top Subprime Top Subprime
Only Securitizers
Only Securitizers
To investigate in a multivariate setting if CEO’s equity and risk incentives increase banks’ probability of being a securitizer of subprime loans we estimate model (1) through 2SLS using as dependent variable the dummy Top Subprime above defined:
Top Subprimei,t = γ0 + γ1Equity Incentivesi,t + γ2Risk Incentivesi,t + γ3Log Agei,t + γ4B_Mi,t +
γ5Returnsi,t + γ6Sizei,t + γ7Change Assetsi,t + γ8Change Tier 1i,t+ γ9Interest
Incomei,t+ γ10GDPi,t + εi,t (3)
Estimate results are reported in Table VIII, Panel B. Column 1 presents results for the full sample, column 2 restricts the sample to 2007, column 3 uses the full time period but tabulate results using only securitizing banks, and the last column uses securitizing financial institutions only and restricts the sample to 2007. Results on CEO’s equity and risk incentives corroborate findings from panel A and suggest that CEOs with high equity and risk incentives are more likely to engage in the securitization of subprime loans than executives with low incentives. Therefore results support both H1 and H2 pointing out to the pivotal role of CEO’s equity and risk incentives in boosting risky securitizations.
In order to further investigate the opportunistic behavior of highly incentivized CEOs when engaging into securitizations, we analyze bank’s disclosure about the amount of losses recorded by loans that have been transferred off-balance. SFAS 140 explicitly requires an entity that securitizes financial assets to disclose information about the quality of securitized assets, including the amount of credit losses11. Specifically we investigate if CEOs with high equity and risk incentives not only engage in risky securitization transactions but also hide the quality of loans securitized by providing external investors with less information about the riskiness of securitizations undertaken. For doing so we analyze the disclosure provided by financial institutions in their financial statements and score the quality of information on losses recorded on securitized loans on a 4-points scale as follows (Disclosure Index):
- 4 points if the amount of losses on securitized assets is disclosed in a table and the information is provided for each type of securitized asset (e.g. mortgages, credit cards etc…);
- 3 points if the amount of losses on securitized assets is disclosed in a table but the information is only provided at an aggregate level;
- 2 points if the amount of losses on securitized assets is not disclosed in a table and it has to be indirectly retrieved from information provided in the financial statements;
- 1 point if it is not possible to understand the amount of losses on securitized assets.
The median value of the Disclosure Index is 2.21 with a standard deviation of 1.06. In order to investigate the role of CEOs equity and risk incentives on the quality of information provided to investors, we estimate the following ordered probit model through 2SLS:
Disclosure Indexi,t = δ0 + δ1Equity Incentivesi,t + δ2Risk Incentivesi,t + δ3Log Agei,t + δ4B_Mi,t +
δ5Returnsi,t + δ6Sizei,t + δ7Change Assetsi,t + δ8Change Tier 1i,t + δ9Interest
Incomei,t + δ10GDPi,t + εi,t (4)
Estimate results are reported in Table IX. The coefficient on CEO’s risk incentives is negative and significant indicating that CEOs with high risk incentives not only securitize risky loans to
a larger extent than CEOs with lower incentives but they also provide external investors with lower information about the quality of loans securitized. On the contrary, we do not find the same effect when examining CEO’s equity incentives. This last result nicely fits with findings from Table V that suggested that CEO’s equity incentives, contrary to risk incentives, determine overall securitization activity and not only the securitization of risky loans. Results reported in Table IX further confirm the opportunistic behavior of CEOs when they engage into securitization transaction motivated by the structure of their incentive scheme.
Table IX. The table reports second-stage estimate results from the ordered probit model (4) estimated through 2SLS. In the untabulated first-stage we use as instrument for CEO’s equity incentives the level of equity incentives the same CEO had before 2000 and as instrument for CEO’s risk incentives the level of risk incentives the same CEO had before 2000.
Disclosure Index is a 4-point-scale variable that classifies the quality of information provided by the financial institution about the amount of losses recorded by securitized loans; Equity Incentives is the logarithm of the dollar change in the value of CEO's stock and option holdings that would come from a one percentage point increase in the company stock price; Risk Incentives is the Vega of CEO’s stock options divided by their Delta; Log Age is the log transformation of CEO’s age; B_M is the book value of equity divided by its market value; Returns is annual returns; Size is thelogarithm of total assets; Change Assets is the percentage change in total assets with respect to the previous year; Change Tier 1 is the percentage change in Tier 1 with respect to the previous year; Interest Income is net interest income standardized by total revenues; GDP is the Gross Domestic Product.
Dependent Variable:
[image:25.612.191.428.221.562.2]Equity Incentives 0.134 [0.105]
Risk Incentives -1.857**
[0.731]
Log Age -0.608
[1.553]
B_M 0.216*
[0.128]
Returns -0.593
[0.584]
Size 0.324**
[0.143]
Change Assets -2.897***
[0.746]
Change Tier 1 -0.925
[0.634]
Interest Income -0.335
[1.431]
GDP 4.349***
[1.638]
Year Dummies YES
Observations 208
Pseudo R2 8.2%
TABLE IX
CEO Incentives and Disclosure
Disclosure Index
*,**,*** indicate statistical significance at 10%, 5%, 1% level, respectively. Heteroskedasticity-robust standard errors clustered at firm-level are reported in brackets. P-values are two tailed. The sample only includes securitizers.
Finally, we test if banks involved in the subprime securitization indeed over performed other financial institutions before the crash of the subprime market in 2007 and if this relation changed once the subprime crisis has blew up. To shed light on this issue we analyze how stock returns and earnings per share of top subprime securitizers changed before and after 2007 with respect to other financial institution. Specifically, we fit the following OLS model in which the variable Crisis is a dummy that takes the value of 1 in years 2007-2009, zero otherwise, and Performance is either annual market returns or earnings per share (EPS).
Performancei,t = λ0 + λ1Crisisi,t + λ2Top Subprimei,t + λ3Crisis*Top Subprimei,t + λ4B_Mi,t +
λ5Sizei,t + λ6Change Assetsi,t + λ7Change Tier 1i,t + λ8Interest Incomei,t +
λ9Securitizationi,t + εi,t (5)