2212-8271 © 2017 The Authors. Published by Elsevier B.V. This is an open access article under the CC BY license (http://creativecommons.org/licenses/by/4.0/).
Peer-review under responsibility of the scientific committee of the 27th CIRP Design Conference doi: 10.1016/j.procir.2017.02.024
Procedia CIRP 60 ( 2017 ) 434 – 439
ScienceDirect
27th CIRP Design 2017
Design implications towards inspection reduction of large scale structures
Anastasia Ioannou
a*, Lin Wang
a, Feargal Brennan
aaCranfield University, School of Water, Energy and Environment, Cranfield, Bedfordshire, MK43 0AL United Kingdom
* Corresponding author. E-mail address: [email protected]
Abstract
Operational management is a key contributor in life cycle costs, especially for large scale assets which are in most times complex in structural hierarchy and with a large nominal service life. Decisions on the operational management may concern the number of inspections or maintenance strategies which may allow full utilization of structural capacity or sacrifice residual life in order to avoid an unscheduled intervention. Design of such assets is often governed by design standards which offer the designer the flexibility to take certain decisions that may affect the CAPEX to OPEX ratio such as that of building a more robust structure which may eliminate the need for costly inspection operations. This paper is investigating this approach, taking the example of offshore wind turbine support structures as the reference case, and examines the relevant provisions of the DNV-Os-J101 Standard with respect to the design implications that such a decision may have to the overall life-cycle cost of the structure. Assessment of the structural properties under different design conditions is evaluated through a combination of detailed cost model and an iterative optimization algorithm. The approach which is followed and documented, can be applicable to other complex structural systems for decision making through evaluation of service life costs.
© 2017 The Authors. Published by Elsevier B.V.
Peer-review under responsibility of the scientific committee of the 27th CIRP Design Conference.
Keywords: offshore wind energy, monopile, design optimisation, material safety factors, inspection and maintenance, cost model, genetic algorithm
1.Introduction
Complexity of structural systems, introduce a variety of factors that a designer should take into account during the design stage of the project which could in any way affect subsequent stages of the service life of an asset. Energy assets are in most cases characterized by increased complexity and hence decisions over their design and operation becomes even more demanding. Offshore wind energy structures is a representative example of this phenomenon, varying significantly from similar applications, such as those of the offshore oil and gas industry, in the sense that they are deployed in arrays of several units (this number can reach or exceed 100) hence the requirements in mass production, should be designed to accept higher risks due to their unmanned operation in normal conditions and the fact that they refer to a marginal business were profits are limited and highly uncertain. In particular, as of July 2016, 3,344 units were installed and grid connected across Europe, at an average distance to shore of 42 km and 25 meters of deployment depth, accounting of 11.5 GW
of total capacity [1] with ambitious targets for the foreseeable future (18 GW to be deployed by 2020) [2].
In this paper we consider the example of the frequency of inspection and maintenance of offshore wind support structures, usually determined by Industrial Standards such as the DNV-RP-J101 [3], recommending fixed intervals between consecutive inspections and outlining the design structural requirements of the wind farm turbines. Since certification is essential for an offshore wind farm to be eligible for insurance, it is of paramount importance for the wind turbines to acquire the certification needed through compliance to the underpinning standards. Although standards are in general very prescriptive, they often allow designer the flexibility to change the length of the inspection intervals by modifying the design of the substructure. As such, the designer can overdesign the support structure through higher material factors in order to expand the inspection intervals yielding significant inspection and potential maintenance cost gains. As a consequence, increasing the material factor of the structure is expected to
© 2017 The Authors. Published by Elsevier B.V. This is an open access article under the CC BY license (http://creativecommons.org/licenses/by/4.0/).
have an effect on the material volume of steel and therefore on the construction cost of the support structure.
This paper investigates the effect of material safety factors on fatigue design of offshore wind turbine monopiles and quantifies the cost implications associated with each case. Results of this work highlight the fact that design elements of offshore wind farms should be based on strategic decisions affecting the levels of CAPEX and OPEX over the lifecycle of an offshore wind farm.
Nomenclature
CAPEX Capital expenditures CVI Close visual inspection GVI General visual inspection OPEX Operating expenditures ROV Remotely Operated Vehicle
2.Inspection of offshore wind turbines
According to DNV-OS-J101 (Chapter 13) [3] periodical inspections should be performed during the design life of the offshore wind farm in the following components:
- wind turbines,
- structural system above water, - structural system below water, - submerged power cables.
The present paper focuses on the inspection of the structural system below water. Costs of subsea structural surveys represent around 1% of the total maintenance costs according to a report compiled by Garrad & Hassan [4]. Nevertheless, the high level of expenditure devoted for such investments render their limitation a rather important business.
Typical offshore subsea survey components for the inspection of the structure for the periodical inspections consist of the general visual inspection (GVI) and the close visual inspection (CVI) usually carried out through a Remotely Operated Vehicle (ROV).
One of the main issues of calendar-based maintenance of the subsea structural components is the determination of the interval between consecutive inspections. According to [3] inspection for fatigue cracks should take place at least every five years. However, the frequency of inspections may be waived according to the design philosophy that has been used for the structural components in question. As such, when the fatigue design of the component has been performed by using safety factors corresponding to a condition of no access for inspection operations, the inspections on the specific part could be eliminated. When, however, material factors are smaller, more regular inspections need to be performed. The Guidance note of the DNV-Os-J101 Standard with regards to inspections for fatigue cracks (section 13.3.7.2) recommends that the interval between consecutive inspections can be expressed in relation to the material safety factor ߛ as:
ൌ ή ߛହȀͳǤʹͷହ (1)
Therefore,
- when ߛ=1.25, inspections for fatigue cracks can be fully eliminated,
- when ߛ=1.15, inspections for fatigue cracks are needed every 13 years,
- when ߛ=1.0, inspections for fatigue cracks are needed every 7 years.
It becomes, thus, evident that overdesigning a monopile substructure could potentially reduce calendar-based maintenance costs. However, increasing the material factor would result in a higher volume of the steel quantity used for the construction of the substructure with a subsequent increase in the manufacturing and transportation costs.
3.Development of lifecycle cost model
In order to estimate the effect of the different design configurations on the cost of energy, a lifecycle cost model was developed.
Existing literature on the lifecycle costs of an offshore wind farm indicates that the cost drivers fall into the 5 main phases of the offshore wind farm’s life (as in [5-7]), characterized by different operating conditions and cost structures:
1. Development and consenting (D&C) 2. Production and acquisition (P&A) 3. Installation and commissioning (I&C) 4. Operation and maintenance (O&M) 5. Decommissioning and disposal (D&D)
Above cost categories are further broken down into their constituent elements, and accordingly a database is built with the related cost elements.
The cost of energy can be calculated by the following equation:
ൌ ሺሻ ሺ͉ሻ ൌ
ൌσ
ిఽౌు౪శోౌు౪శీ ሺభశఽిిሻ౪
౪సభ
σ ొు౪ ሺభశఽిిሻ౪
౪సభ (2)
Where ୲ is the capital costs in the year t, ୲: operations and maintenance costs, ǣ decommissioning costs, ୲: net electricity production in the year t, ǣ weighted average cost of capital.
It is noted that the calculation of total lifetime expenses is based on discounting annual financial flows, taking into consideration the time value of money.
The cost model aims at capturing the impact of applying a different design philosophy by using varying safety factors to the structure on the CAPEX and OPEX. Therefore, the cost components that are explicitly impacted by the design of the monopile are: (a) the cost of monopile steel mass, fabrication, transportation and installation, and (b) the subsurface inspection costs for fatigue cracks. To this end, these are the elements, which are further investigated within the context of this paper.
The following assumptions were applied for setting up the model with regards to the above parameters:
acquisition stage derives from the sum of fabrication ሺ ሻ and material cost (ሻ:
Ƭൌ (3)
The cost of monopile material is calculated by the following equation:
ൌ ή (4)
Where SQ is the steel quantity for the monopiles, SP is the steel price per ton. Cost of fabrication is empirically assumed to be priced twice the cost of the volume of steel required.
ൌ ʹ ή (5)
Ƭis added to the cost of installation of the monopile carried out during the installation phaseூ. It was assumed that a high-capacity jack-up vessel needs to be hired for the transportation and installation of the monopiles. The vessel’s
capacity was assumed to be 5 monopiles with a mobilization time of 3 days. Table 1 displays representative installation vessel day rates in relation to their crane capacity [8]. (b) Sub-surface inspection costs (ூƬ) are assumed to be carried out by a diving support vessel chartered on the spot market. Cost components of inspections of the structural system below water are summarized in Table 2. The rest of the model’s parameters were kept stable across the cases investigated.
Table 1 Approximate day-rates, in thousands £(Source: [8])
Vessel daily rates (thousands £) Jack-up vessel crane capacity (tones)
192.6 1,200
147.3 1,000
102.0 800
Table 2 Typical inspection costs for structural system below water (Source: [9])
Survey type Mob, £ Demod, £
Vessel day rate, £/day
Reports, etc. Structural:
GVI/CVI
120,000 60,000 25,000 10,000-15,000
4.A framework for design optimisation of offshore wind support structures
A structural optimisation model based on coupled FEA (finite element analysis) and GA (genetic algorithm) is used to determine the thickness distributions of monopiles.
4.1 Parametric FEA model of offshore wind turbine monopiles
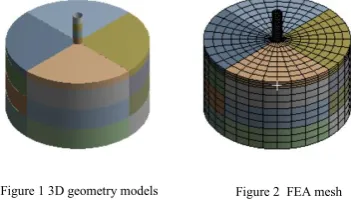
A parametric FEA model of offshore wind turbine monopiles was established using ANSYS, which is a widely used finite element (FE) software. The parametric FEA model enables the design parameters of wind turbine monopiles to be easily modified to create various monopile models. The 3D geometry model and FEA mesh are depicted in Figs. 1 and 2, respectively.
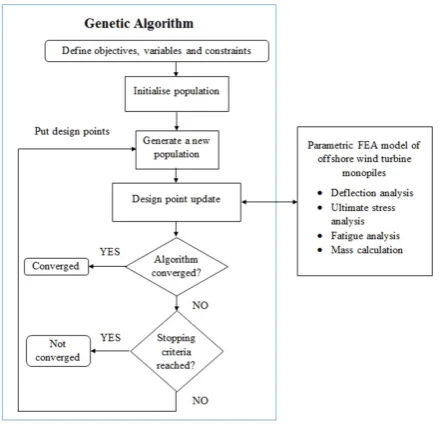
The flowchart of the parametric model of wind turbine monopiles is presented in Fig. 3.
4.2 Genetic algorithm
GA is a widely used search heuristic that mimics the process of natural selection. Due to its capable of handling large number of design variables and avoiding being trapped in local optima, GA has been employed in complex problems and has proven to be robust for practical engineering application [10], wind turbine composite blades [11] and OWT related studies [12,13]. In GA, a population of individuals (also referred to candidate solutions) to an optimisation problem is iteratively evolved toward better solutions. Each individual contains a set of attributes (such as its chromosomes and genotype) which can be mutated and altered. The evolution generally begins with a population of random individuals, and it progresses iteratively. The population in each iteration is called a generation, in which the fitness of each individual is evaluated. The value of the objective function in the optimisation problem being solved is generally taken as the fitness. The individuals having higher fitness are stochastically selected from the current population, and the genome of each individual is then modified (such as mutated and recombined) to form a new generation, which is then utilised in the next iteration. The GA generally terminates when either the number of generations reaches the maximum value or the current population achieves a satisfactory fitness level.
[image:3.595.313.489.73.173.2]GA searches for optimal solutions through an iterative way, which is summarised below:
[image:3.595.339.475.225.366.2]Figure 1 3D geometry models Figure 2 FEA mesh
1. Define optimisation objectives, design variables and constraints: The optimisation objectives, design variables and constraints are defined at the first step of GA.
2. Initialise population: Initial population (i.e. initial candidate solutions) is randomly generated in this step. 3. Generate a new population: In this step, a new population
is created through mutation and crossover.
4. Design point update: In this step, the design points in the new population are updated.
5. Convergence validation: The optimisation converges when convergence criteria have been reached. If the convergence criteria have not yet been reached, the optimisation is not converged and the evolutionary process of GA proceeds to the next step.
6. Stopping criteria validation: If the iteration number exceeds the maximum number of iterations, the evolutionary process is then terminated without having reached convergence. Otherwise, the algorithm returns to Step 3 to generate a new population.
[image:4.595.302.526.277.536.2]The above Steps 3 to 6 are repeated until the optimisation has converged or the stopping criterion has been reached.
Figure 4 Flowchart of the optimisation model
5.Case study
5.1.Presentation of the case study
In this section the aforementioned methodology is applied to a 500MW offshore wind farm, consisting of 83 turbines. There are numerous studies that have investigated an OWF of 500MW (for example in [4], [6, 14, 15]), allowing for the comparison of results. The wind farm design parameters of the cost model consider a distance to O&M port of 40km, average mean wind speed at 100m above mean sea level 9m/s, fixed monopile foundation type, water depth 20m, 25 years of asset life, nameplate capacity of 6MW and construction duration 5 years. Table 3 presents the distribution of cash flows during the
five lifecycle stages of the wind farm at a 30 year period, including 5 years of construction. This includes 5 years of building up the wind farm and 25 years of operation. The parameters that remain stable in the cost structure of the wind farm were adopted by literature sources such as [14] and [15] mostly for the CAPEX and decommissioning components (D&C, P&A, I&C, D&D), while [4] and [9] provided input for calculating the maintenance costs (O&M). The aggregated costs of constant parameters are illustrated in Most of them are presented in Table 4.
Table 3 Distribution of cash flow for the five economic evaluation stages (Source: [14, 16])
Investment year
0 1 2 3 4 5 6–
9 10–
29 30
Operational year
−4 −3 −2 −1 0 1 2– 5
6– 24
25
Stag
e Weighted investment distribution over the years D&C 34
%
2% 2% 21.5 %
40 %
0.5% 0 %
0% 0%
P&A 0% 0.1 %
16.3 %
37.3 %
43.4 %
3% 0
%
0% 0%
I&C 0% 1.65 %
1.66 %
32.5 %
61.4 %
2.8% 0 %
0% 0%
O&M 0% 0% 0% 0% 0% 0% 0
% 100 %
0%
D&D 0% 0% 0% 0% 0% 0% 0
%
0% 100 %
Table 4 Constant cost elements (Source: [14])
Lifecycle stage
Cost element Costs (£million)
D&C Project management 41.7
Legal authorization 16.5
Surveys 18.9
Engineering 1.1
Contingencies 124.6
P&A Wind turbines 420.3
Power transmission system 156.5
Monitoring system 2.5
I&C Port 14.7
Installation of the components 265.8-ூƬ
Commissioning 0.2
Insurance 20.8
O&M Onshore logistics, Workboats, Aviation, Crane barge services, etc.
Costs considered according to [4],[9].
D&D Port preparation 20.9
Removal operation 188.2
Waste management -13.9
Site clearance 3.6
Post-decommissioning monitoring 3.6
5.2.Geometry of the monopile
The monopile used in this study has an outer diameter of 6m and an overall length of 55m, consisting of eleven 5m-length segments with varied thicknesses. 35m of the monopile are embedded into the soil, and the remaining 20m covers the distance from seabed level up to the sea surface. Table 5 presents the initial dimensions of the monopile.
Table 5 Dimensions of monopile (bottom-up)
Segments Outer diameter (m) Length (m)
[image:4.595.69.289.301.513.2]5.3.Loading conditions
The design of the monopile considers both ultimate and fatigue load cases. For the ultimate load case, the extreme sea condition (i.e. 50-year extreme wind condition combined with extreme significant wave height) is taken as the critical ultimate load case. For the fatigue load case, both wind and wave fatigue loads for the normal operation of offshore wind turbine monopiles are considered. Table 6 lists the ultimate loads under extreme sea condition, and Table 7 presents the fatigue loads. The aerodynamic loads in Table 6 are taken from [17] for WindPACT 5MW wind turbine (making the assumption that a 6 MW will in practice undergo similar loading conditions), which is a reference wind turbine designed by NREL (National Renewable Energy Laboratory).
The wind turbine weight (including the tower head weight (480,076 kg), additional weight at transition connection (5,000 kg) and tower weight (539,000 kg)) with a value of 1,024,076 kg (10,035,945N = 1,024,076kg*9.8m/s2) is taken into account
[image:5.595.304.523.92.206.2]by adding a point load on the monopile top. For the ultimate load case, a load safety factor of 1.35 is applied to aerodynamic, wave and current loads. For the fatigue analysis, D curve in seawater with cathodic protection is chosen as the fatigue design curve.
Table 6 Ultimate loads under extreme sea condition
Item Aerodynamic loads [17]
Wave loads Current loads
x
F
(kN) 1,057 677 348y
[image:5.595.66.288.351.400.2]M
(kN-m) 135,000 - -Table 7 Fatigue loads (Note: subscript f denotes fatigue loads)
Item Aerodynamic loads [17]
Wave loads
f x
F
, (kN)197 210
f y
M
, (kN-m)29,874 -
6.Results
Three values of material safety factors are considered (i.e. 1, 1.15 and 1.25). The obtained thickness distribution of the monopile is presented in Table 8.
Table 8 Thickness distribution of the monopile
Segment ID Thickness [m]
Case A Case B Case C
1~7 0.074 0.083 0.089
8 0.060 0.067 0.077
9 0.054 0.055 0.067
10 0.052 0.053 0.056
11 0.045 0.051 0.052
The mass of the monopile, the mass increase in relation to the reference case, along with the resulting CAPEX to OPEX ratio and LCOE values under the different cases are presented in Table 9.
Table 9 Results of the analysis
Inspection scheme
Base case A: Every 7 years
Case B: Every 13 years
Case C: No inspections
Mass of the
monopile (kg) 535,230 592,500 642,420 Mass of
monopile and tower (kg)
89,161 93,915 98,058
Mass increase
(%) 0 6.5 12.2
CAPEX to (annual) OPEX ratio
ǡ ૡǤ ൌ Ǥ
ǡ Ǥ ૡ ૡǤ ૡ ൌ Ǥ
ǡ Ǥ ૡǤ ૠ ൌ Ǥ
LCOE
(£/MWh) 120.44 120.95 121.42
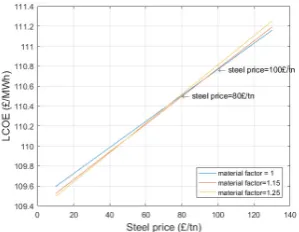
According to the derived results, despite the decrease in OPEX due to the wider fixed inspection intervals, employing higher material factors in the monopile structure is expected to increase the total cost of energy. Nevertheless, it is worthwhile noting that the cost model analysis is quite sensitive to a number of parameters, as outlined by literature [15], [6], and results are highly depended on the variability of these parameters, e.g. the discount rate, the O&M costs, the support structure cost, etc. The steel prices, which in the present analysis play an important role in the determination of the cost of energy under the different cases, for example are quite volatile and fluctuate considerably among countries as well as across different grades of steel, quality and transport options [6]. In the present analysis a base price of £690 per ton of bulk steel was assumed. Fig.5 shows that in order to breakeven the cost of energy between monopile designs with material factors 1 and 1.15 (when all other variables remain constant) the steel price needs to amount £100/ton; while the breakeven steel price for worth switching from 1 to 1.25 material factor is £80/ton.
Figure 5 Breakeven points of steel prices resulting in equal costs of energy under different material factors
7.Discussion
[image:5.595.333.483.413.529.2] [image:5.595.67.290.428.481.2]automation of manufacturing processes for monopiles are expected to reduce overall CAPEX, making the more conservative designs more attractive.
A different perspective suggests that more conservative designs could ultimately enable the consideration of the life extension of the asset, practice that has been extensively observed in oil and gas infrastructure with examples of assets which have doubled their nominal service life. Nevertheless, the financial impact of extending the fatigue life has to be evaluated by taking into consideration the additional revenues that would accrue from the additional energy production as well as the extra operating costs that are added. Moving towards deeper waters and considering XL monopiles, the exercise needs to be updated as both volume of material as well as extend of inspection will bear further complexities. On a similar logic and as the maturity of the industry increases, a new generation of smarter assets is expected to be developed,
adopting ‘smarter’ concepts such as structural health
monitoring for system prognostics. With consistent information about the performance of the assets, which can allow timely investigation of deviation of normal operation, the requirement for more conservative designs is alleviated and hence designs can be informed accordingly, once again affecting the CAPEX to OPEX ratio. The authors are currently investigating the cost/benefit balance of such design decisions in parallel studies.
8.Conclusions
The present study investigates the impact that different monopile designs can have, based on relevant provisions of design standards, on the life cycle costs of an offshore wind farm by developing a structural optimisation model based on FEA (finite element analysis) and GA (genetic algorithm) to determine the optimized thickness distributions under different material safety factors, coupled with a cost model which enables to detect the effect of above design elements on the capital and inspection and maintenance costs and, as a result, on the levelised cost of energy of the technology.
Application of the method on a hypothetical 6 MW offshore wind turbine, draws the following useful conclusions: - Despite the decrease in OPEX, employing higher material
factors in-line with the provisions of design standards, is expected to increase the total cost of energy.
- Variability of key design parameters, e.g. the discount rate, the O&M costs, the support structure cost, etc. may highly affect the confidence of the assessment.
- The optimization algorithm and cost model that have been developed are found to be sufficiently robust and can be employed for the evaluation of similar design variations, i.e. optimizing thickness to diameter ratio, piling length, longitudinal stiffeners consideration, consideration of integrity monitoring etc., towards reducing the LCOE. It becomes apparent from the present study that the design options can have cost implications which need to be evaluated throughout the service life of the asset, in order to adequately support decisions.
Acknowledgements
This work was supported by grant EP/L016303/1 for Cranfield University, Centre for Doctoral Training in Renewable Energy Marine Structures (REMS) (http://www.rems-cdt.ac.uk/) from the UK Engineering and Physical Sciences Research Council (EPSRC).
References
[1] Wind Europe (2016). The European offshore wind industry – key trends and statistics 1st half 2016. Available at: https://windeurope.org/about- wind/statistics/offshore/european-offshore-wind-industry-key-trends-statistics-1st-half-2016/ (Accessed 11/2016)
[2] Department of Energy & Climate Change (DECC) (2011). UK Renewable Energy Roadmap.
[3] DNV (2014). Offshore Standard. DNV-OS-J101. Design of Offshore Wind Turbine Structures. May 2014.
[4] Garrad Hassan GL (2013) A guide to UK offshore wind operations and maintenance. Scottish Enterprise and The Crown Estate, UK
[5] Castro-Santos, L., Diaz-Casas, V. Life-cycle cost analysis of floating offshore wind farms, Renewable Energy, Volume 66, June 2014, Pages 41-48.
[6] Myhr, A., Bjerkseter, C., Ågotnes, A., Nygaard, T.A. (2014). Levelised
cost of energy for offshore floating wind turbines in a life cycle perspective.
Renewable Energy 66 (2014), Pages 714-728
[7] Effiom, S.O., Nwankwojike, B.N., Abam F.I. (2016). Economic cost evaluation on the viability of offshore wind turbine farms in Nigeria, Energy Reports, Volume 2, November 2016, Pages 48-53.
[8] Dalgic, Y., Lazakis, I. & Turan, O. (2013). Vessel charter rate estimation for offshore wind O&M activities. 15th International Congress of the International Maritime Association of the Mediterranean IMAM 2013 - Developments in Maritime Transportation and Exploitation of Sea Resources, At A Coruna, Spain. October 2013. DOI: 10.1201/b15813-113 [9] Thomsen K., 2014. Offshore Wind: A Comprehensive Guide to Successful Offshore Wind Farm Installation. Oxford, England: Academic Press. ISBN 978 0 12 385936 5
[10] Yang, X.-S. and Koziel, S. Computational optimization and applications in engineering and industry vol. 359: Springer Science & Business Media, 2011.
[11] Wang, Lin, et al. "Structural optimisation of vertical-axis wind turbine composite blades based on finite element analysis and genetic algorithm." Composite Structures, vol. 153, pp. 123-138, 2016.
[12] Yoshida, S., "Wind turbine tower optimization method using a genetic algorithm," Wind Engineering, vol. 30, pp. 453-469, 2006.
[13] Martinez-Luengo, M., Kolios, A., and Wang, L. "Structural health monitoring of offshore wind turbines: A review through the Statistical Pattern Recognition Paradigm." Renewable and Sustainable Energy Reviews 64 (2016): 91-105.
[14] Shafiee, M., Brennan, F.& Espinosa, I. A. (2016). A parametric whole life cost model for offshore wind farms. Int J Life Cycle Assess (2016) 21:961–975
[15]Ioannou, A., Angus, A., Brennan, F., (2016). Stochastic prediction of offshore wind farm LCOE through an integrated cost model. The 3rd International Conference on Energy and Environment Research (ICEER 2016) September 7-9, 2016. UPC, Barcelona, Spain.
[16]Effiom, S.O., Nwankwojike, B.N., Abam, F.I. (2016). Economic cost evaluation on the viability of offshore wind turbine farms in Nigeria, Energy Reports, Volume 2, November 2016, Pages 48-53.