1
INTRODUCTIONThe majority of the accidents are attributed to human and organizational factors (Arslan et al., 2016). The entire maritime stakeholders are working towards a safer, resilient and greener shipping industry. However, the envisaged level of safety has not been achieved yet. Therefore, the maritime industry is starting to implement proactive approaches and has tried to avoid reoccurrences by implementing an appropriate safety culture. The safety culture norm was first used Chernobyl accident in 1986 by the International Atomic Energy Agency (IAEA, 1986). Safety culture is a part of overall culture in organizations and it reflects shared belief and values amongst organizations. The term safety climate is mostly used to describe the attitudes and the perceptions of the employees within an organization
1.1
Safety Culture Approach in the Maritime Industry Several companies are distributing safety climate questionnaires and trying to collect safety related KeyPerformance Indicators (KPIs) to gain more insight into their operational performance.
Questionnaires are broadly utilized to depict the general perceptions and attitudes of seafarers to gain insight into existing safety culture maturity levels in shipping and they were widely used by different researchers, institutions and companies. 40 items questionnaire was developed to be distributed at a seminar in Manilla and management attitude to safety, safety behavior, knowledge, attitudes towards safety rules/instructions and employee satisfaction were defined as
Lappalainen (2016) investigated the impact of the ISM Code on Finish maritime personnel’s attitudes and perceptions by arranging 94 thematic interviews in seven Finish shipping company. In another study, 508 employees filled questionnaires on board six Swedish passenger ships and the safety culture perceptions of the employees were compared with air traffic control and airport ground handling employees (Ek* and Akselsson, 2005).
Gaining Insight into Safety Culture Maturity Levels in Shipping
Organizations: Questionnaires vs Key Performance Indicators
V. Arslan, R. E. Kurt, E. Boulougouris and O. Turan
Department of Naval Architecture and Marine Engineering, University of Strathclyde, 100 Montrose Street,
Glasgow G4 0LZ, UK, [email protected]
ABSTRACT: Safety is of the utmost importance in the maritime industry and shipping organizations are looking for means to continuously improve their safety performances. It has also been dictated by the ISM Code that shipping companies need to implement an “effective safety culture”. Therefore, shipping companies are trying to identify the areas which require further improvements to reach to the desired level of safety within their organizations. Safety culture surveys, interviews and observations are introduced to gain insight into company safety culture maturity levels in shipping, but yet, there is no an available industry wide benchmark for shipping companies in order to determine their current status within the industry and improve their safety culture maturity levels accordingly.
The aim of this study is to develop a benchmark for the safety climate questionnaires amongst the shipping companies where they can compare their safety performance data with other shipping companies according to significant safety attributes/dimensions. This study is a part of the overall safety culture assessment and implementation framework which described briefly in the following sections. The overall framework aims to assess the current safety culture maturity level in a company and develop action plans to improve identified vulnerable areas.
Key Performance Indicators were also used to monitor the safety performance of the companies. The website (https://www.shipping-kpi.org/) which is owned the Baltic and International Maritime Council (BIMCO), provides 64 Key Performance Indicators for shipping companies in order to compare their business performance. One of the leading classification society, Lloyd’s Register, also developed a set of KPIs for an oil and gas company in order to provide means to improve operational safety. In total, 73 safety related KPIs had been identified for the company which currently establish the data collection system to utilize those KPIs (Brown, 2009). ABS (2012) developed a comprehensive and detailed leading indicators model for the shipping industry. They proposed 30 subsidiary KPIs and 29 core KPIs to monitor a shipping company’s safety culture level and identify the metrics which of them have a positive impact on safety performance. Banda et al. (2016) also identified 53 KPIs to gain insight into safety management system of a shipping company.
All these efforts are being held in order to comply with the safety culture requirements of the International Safety Management Code. The effects of the International Management Code on safety are described in detail at the next section.
1.2
Effects of the International Safety Management
(ISM) Code on Safety Culture
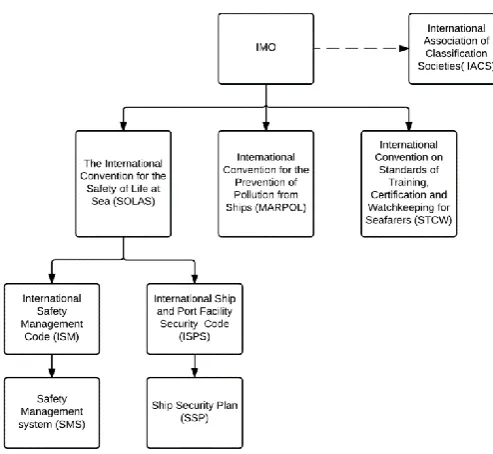
The International Maritime Organization (IMO) developed the International Safety Management (ISM) Code to ensure safety at sea, prevent loss of life and avoid possible injuries of seafarers (Maritime and Costguard Agency, 2015) and became mandatory in 2002 for all ships in operation(International Maritime Organization, 2014). Shipping companies develop their own Safety Management Systems (SMS) and subsequently their SOPs to meet the standards of the ISM Code (Lappalainen, 2008). The implementation of the ISM Code should support and encourage the development of a safety culture in shipping. Success factors for the development of a safety culture should include: commitment, values and beliefs (European Maritime Safety Agency, 2014).
[image:2.595.308.555.29.256.2]The hierarchal representation of the governing rules and regulations in order to maintain an appropriate safety culture is given in Figure 1:
Figure 1 the Hierarchal Representation of the Governing Rules and Regulations
SMS is widely used across the industry and these are used to help direct companies to take a systematic approach to managing safety within their organization. Mearns et al. (2013) recognize that a SMS without a suitable level of organizational culture will certainly not be enough. All these aforementioned issues highlight the requirement of an overall framework to assess and implement the safety culture.
2
METHODOLOGYThe proposed safety culture assessment and implementation framework has three main levels as described:
1. Safety Climate Assessment
2. Safety Related Key Performance Indicator Assessment
3. Observation Study
All three categories are described in more detail in
following sections.
2.1
Safety Climate Assessment
Figure 2 Safety Climate Assessment Framework
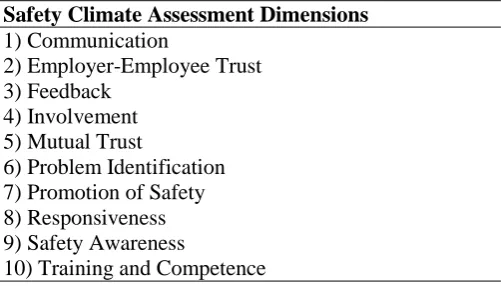
[image:3.595.309.558.196.387.2]Two online questionnaires, one for crew members, one for shore personnel, were developed. A detailed literature review was performed not only in the maritime industry but also in other industries to identify the requirements of an appropriate safety culture questionnaires and assessment methods. Once the questionnaire was finalized, it was distributed to the cadets who have seagoing experience in order to test the questionnaires. The required time to complete the questionnaire was also considered as a vital factor in order to get more results within a shipping company because It is a well-known fact that seafarers deal with excessive amount of paperwork and they don’t want to spend their free time by filling questionnaires The questionnaire statements are grouped under the ten significant dimensions as shown in Table 1.
Table 1 Safety Climate Assessment Dimensions
Safety Climate Assessment Dimensions 1) Communication
2) Employer-Employee Trust 3) Feedback
4) Involvement 5) Mutual Trust
6) Problem Identification 7) Promotion of Safety 8) Responsiveness 9) Safety Awareness
10) Training and Competence
The ultimate aim of the safety climate assessment is to develop an industry wide benchmark which can assist companies to monitor their current safety level. It is therefore of importance to distribute the questionnaire s to all different shipping companies such as tanker, cruise, bulk carrier and container in order to reflect all aspect of the shipping.
2.2
Key Performance Indicators
The second part of the overall safety culture framework is the KPI assessment. The first intention of this method is to analyze organizational data and identify the KPIs which have positive impact on safety performance of the company. Second intention is to compare questionnaire results and the safety related KPIs in order to validate the survey results. The KPI development stage is depicted inFigure 3
Figure 3 KPI Development Flow
2.3
Observations
After capturing the attitudes and perceptions of the employee’s and validating those subjective results with objective safety related key performance indicators, It is of paramount importance to arrange on board observational studies to identify crucial parameters which affect seafarers’ adherence to safety management rules. First aim was to identify if the allocated time gives them opportunity to perform their tasks safely. Second aim was to analyse each crew member’s workload distribution. These studies will allow seafarers rearrange crew member’s safety critical tasks and enhance their performance.
The study also aims to compare overt observations with the workload analysis questionnaire that they filled at the end of each day.
3
PRELIMINARY RESULTS [image:3.595.31.282.512.655.2]Table 2 Return Rates of the Questionnaires
Shipping Companies Return Rates Container Shipping Company 23%
Bulk Carrier Company 100% LNG & Chemical Carrier 71%
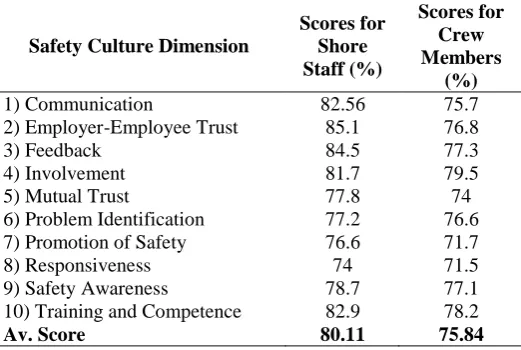
[image:4.595.31.292.379.554.2]In total, 1745 employees answered to the safety culture questionnaires. This number is expected to increase after the distribution of the questionnaires to a cruise or ferry operator in order to reflect all the major shipping operation types. The safety climate analysis is an ongoing work at this stage. An assessment report together with the action plans was sent to the container shipping company. Other two individual assessments will be sent to the companies after detailed analysis. This questionnaire was distributed as a trial study to test the efficacy of it. The feedback was provided by seafarers and managers and no amendments were suggested. The brief representation of seafarers’ results of the container shipping company were given in Table 3
Table 3 Overall scores of shore staff and crew members
Safety Culture Dimension
Scores for Shore Staff (%)
Scores for Crew Members
(%)
1) Communication 82.56 75.7
2) Employer-Employee Trust 85.1 76.8
3) Feedback 84.5 77.3
4) Involvement 81.7 79.5
5) Mutual Trust 77.8 74
6) Problem Identification 77.2 76.6 7) Promotion of Safety 76.6 71.7
8) Responsiveness 74 71.5
9) Safety Awareness 78.7 77.1
10) Training and Competence 82.9 78.2
Av. Score 80.11 75.84
It can be seen from the given table that shore staff have better safety attitudes and perceptions on several safety related factors than crew members. Shore staff achieved the best score on employer-employee trust with the 84.5 and the lowest one on responsiveness with 74. Crew members achieved the best score on involvement with the 79.5 and the lowest one on responsiveness with 71.5. Both employees got the lowest scores on responsiveness and therefore the company needs to invest some time and money to this safety factor in order to enhance the level of safety in the company. The second obvious fact can be seen from the table that crew members’ scores are lower on all of the safety factors than shore staff. The company needs to focus on enhancing crew members’ level of safety in order to improve this situation. Another striking
result which can be obtained from the survey results that the biggest difference between crew members and shore staff is recorded with 8.3 percent on employer-employee trust. This clearly identifies a significant issue that even though shore staff thinks that there is a good trust between workers and managers, crew member’s opinions are significantly different in this case.
Statistical analysis to identify differences between shore staff and crew members has been conducted for the all statements. Due to the high number of questions asked in the questionnaire, all of the results won’t be given in this paper. Mann Whitney U Test, which is very common method to compare groups in a non-parametric data, has been performed in order to identify statistical differences between shore staff and crew members on the question 3. ρ value has been found as 0.02 with a two tailed test with 95% confidence level. It can be concluded as there is sufficient evidence to reject the null hypothesis and therefore, a statistical difference has been found between shore staff and crew member on the question 3. This result identifies very crucial problem that how crew members and shore staff have different perceptions about safety and how they interpret the cooperation levels between each other.
The questionnaires will also be distributed a passenger ships to create a pool of survey data for benchmarking purposes. The ultimate aim is to generate industry level benchmarking for the operators of different ship types. Secondly, KPIs were collected in a shipping company to gain insight into their operational performance. A comprehensive and tailored set of KPIs were developed in order to conduct the analysis successfully. 40 KPIs were already in use in the company however, there was a requirement of another 46 safety related KPI collection to perform more accurate results. KPI analysis couldn’t reach to its envisaged maturity due to the lack of data collection. It clearly demonstrated that without a good data collection strategy in an organization, it is difficult to identify all relations of the crew member’s attitudes and ships’ operational performance.
members are quite competent and strictly follow the standard operating procedures, they sometimes need to find an alternative way to perform their tasks to the extensive amount of paperwork and time limitations. Majority of the data are already available in electronic environment on board ships and therfore just by utilizing automation on board operations could decrease the amount of paperwork and could enhance the safety in shipping. SEAHORSE Project’s solutions such as automated procedure improvement tool or aviation based checklists decrease the paperwork without putting safety at stake.
4
IMROVEMENT STRATEGIES AND ACTION
PLANS
After the identification of the vulnerabilities in a company, improvement methodologies will be developed to enhance the level of safety. Database of solutions listed below, will be utilized to enhance safety culture in shipping organizations. Tailored action plans will be implemented to increase the score of lower dimensions continuously:
Development of more resilient and safer Standard Operating Procedures ( Utilizing the novel SEAHORSE Procedure Improvement Methodology
Trainings on lower dimensions of the safety culture
Transfer of the developed solutions from aviation to maritime based on the safety critical dimensions
5
CONCLUSIONSSafety culture enhancement requires commitment of the entire company from the management level to the cadet level. It is of paramount importance to continuously monitor the safety performance of the organization and develop appropriate methodologies to make the shipping operations safer, resilient and more practical. Shipping companies strive to be more competitive in the current market. Achieving and retaining an appropriate safety culture doesn’t only lead to a lower number of accidents and incidents, it also allows company to be more desirable according to costumers in the market
All these efforts aims to shed light on vulnerabilities which requires further improvement in organizations. One of the novelty of this study is to provide an industry wide benchmark for the safety climate assessment in the shipping industry. This will lead companies to compare their crew’s performance with other shipping companies. The benchmark will also assist them to identify which areas they need to invest more in order to reach to an industry wide standard.
There is also a distinct lack of studies that employ an observational method to capture the common practices which drives the performance of the crew members and capture what really dominates their workload. Observation study highlighted that the excessive amount of paperwork hamper their safety awareness on board operations. It was identified that automation of paper-based procedures and checklists could provide safer and practical shipping operations.
One of the biggest challenge for the safety culture assessment framework is the existing blame culture in the maritime industry. This drastically affects the quality of the reporting and data collection methodologies.
ACKNOWLEDGEMENT
The research leading to these results has received funding from the European Community’s Seventh Framework Programme (FP7-SST-2013-RTD-1) under Grant Agreement Number SCP-GA-2013-605639-SEAHORSE. The authors would like to acknowledge the assistance of all consortium members and questionnaire distributor for their time and help. None of the authors in this paper are affiliated with the company that provided the data for the safety climate assessment.
6
REFERENCES
ABS 2012. Safety Culture and Leading Indicators of Safety.
ARSLAN, V., KURT, R. E., TURAN, O. & WOLFF, L. D. Safety Culture Assessment and Implementation Framework to Enhance Maritime Safety. Transport Research Arena, 2016 Warsaw, Poland
BANDA, O. A. V., HÄNNINEN, M., LAPPALAINEN, J., KUJALA, P. & GOERLANDT, F. 2016. A method for extracting key performance indicators from maritime safety management norms. WMU Journal of Maritime Affairs, 1-29.
BROWN, M. 2009. Developing KPIs That Drive Process Safety Improvement. IChemE, SYMPOSIUM SERIES.
EK*, Å. & AKSELSSON, R. 2005. Safety culture on board six Swedish passenger ships. Maritime Policy & Management, 32, 159-176.
EUROPEAN MARITIME SAFETY AGENCY, E. 2014. Annual Overview of Marine Casualties ans Incidents. In: EMSA (ed.). Lisbon.
IAEA 1986. Summary Report on the Post-accident Review Meeting on the Chernobyl Accident, International Safety Advisory Group. Safety Series 75-INSAG-1. Vienna.
LAPPALAINEN, J. 2008. Transforming Maritime Safety Culture. Evaluation of the impacts of the ISM Code on maritime safety culture in Finland. LAPPALAINEN, J. 2016. Finnish Maritime Personnel's
Conceptions on Safety Management and Safety Culture.
MARITIME AND COSTGUARD AGENCY, M. 2015. International Management Code for the Safe Operation of Ships and for Pollution Prevention (The ISM Code) - Instructions for the Guidance of Surveyors. In: AGENCY, M. C. (ed.). Southampton.