City, University of London Institutional Repository
Citation
:
Faggio, G. (2016). Relocation of Public Sector Workers: Evaluating a place-based policy (16/10). London, UK: Department of Economics, City, University of London.This is the published version of the paper.
This version of the publication may differ from the final published
version.
Permanent repository link:
http://openaccess.city.ac.uk/16510/Link to published version
:
16/10Copyright and reuse:
City Research Online aims to make research
outputs of City, University of London available to a wider audience.
Copyright and Moral Rights remain with the author(s) and/or copyright
holders. URLs from City Research Online may be freely distributed and
linked to.
Department of Economics
Relocation of Public Sector Workers:
Evaluating a place-based policy
Giulia Faggio
1 City, University of LondonSpatial Economics Research Centre, London School of Economics
Department of Economics
Discussion Paper Series
No. 16/10
1 Corresponding author: Giulia Faggio, Department of Economics, City, University of London, Northampton Square, London EC1V 0HB, UK.
Relocation of Public Sector Workers:
Evaluating a place-based policy
*Giulia Faggio
Department of Economics City, University of London
Northampton Square, London, EC1V 0HB, UK Tel.: +44 (0)20 7040 3634
and
Spatial Economics Research Centre, London School of Economics, Houghton Street, London, WC2A 2AE, UK
October 16, 2016
Relocation of Public Sector Workers:
Evaluating a place-based policy
°Abstract
This paper investigates the local labor market impact of a UK relocation initiative, the 2004 Lyons Review.
The review resulted in the dispersal of about 25,000 civil service jobs out of London and the South East
towards other UK destinations. The paper aims to detect whether inflows of public sector jobs have
crowded out private sector activity or stimulated the local provision of jobs in the private sector. Focusing
on short-term effects, I find that the relocation programme raised private sector employment in the
receiving areas and changed the sectoral distribution of local employment towards services and away from
manufacturing.
JEL classification: O1, R23, R58, J61
Keywords: Economic development; regional labour markets; regional government policy; job displacement
1 1. Introduction
Governments design a variety of place-based policies attempting to reverse the fate of
economically declining areas and create employment opportunities for local residents. In the US,
Enterprise and Empowerment Zone programmes spur the creation of jobs by providing tax incentives to
businesses located in designated areas.1 Similarly, French Enterprise Zone programmes are targeted at
discretely bound areas.2 The UK government follows a slightly different approach by designing either
place-based policies with no-predetermined spatial scale (the Single Regeneration Budget or SRB
programme), or spatially-bound policies whose funding goes indirectly to businesses through local
government (the Local Enterprise Growth Initiative or LEGI).3 The UK government also uses relocation
programmes of public sector workers to address regional employment problems and to reduce spatial
disparities in income. Strictly speaking, relocation programmes of public sector workers are not ‘pure’
place-based policies. They address a variety of objectives, including delivering cost savings, re-organising
the government estate, and enhancing devolution.
When a public sector job is created in an area, it may have a local ‘multiplier effect’: It may create
additional local jobs as a result of the increased demand for locally-produced goods and services.
Conversely, a rise in public sector employment may trigger general equilibrium effects in the form of
higher housing prices or higher local wages (see Moretti, 2010; Faggio and Overman, 2014). These general
equilibrium effects may be stronger than the multiplier effect and result in a crowding out or displacement
of local businesses.
The debate on the use of public sector worker relocations as a tool to boost regional development
is not new. The UK first government-sponsored review was commissioned in the 1960s (Flemming
Review, 1963), followed by the Hardman Review (1973) and by the Lawson-Thatcher Review (1988).
Notwithstanding the attention given by the government to the subject, there is scarce evidence of the effects
of a public sector relocation programme upon local labour markets. This study tries to fill this gap by
assessing the local labour market impact of a public sector relocation initiative labelled the Lyons Review.
In 2004, Sir Michael Lyons led a UK government-sponsored independent study on the scope for
public sector relocations out of London and the South East towards other UK destinations. The review
proposed a relocation of about 20,000 civil service jobs within a six-year period. Thanks to the adoption
of effective ‘push’ factors (such as relocation targets and property controls), the original target was
delivered nearly a year ahead of schedule. By March 2010, the programme had relocated more than 25,000
jobs. The 2004 relocation programme addressed a variety of objectives including the government desire to
stimulate economic activity in less-prosperous areas and, thus, reducing spatial imbalances between
1 See, for recent evaluations of the US programmes, Neumark and Kolko (2010) and Busso et al. (2013). 2 See, e.g., Gobillon et al. (2012) and Mayer et al. (2012).
2 London and periphery areas. To the extent that the relocation programme had any impact on local economic
conditions, this paper aims to detect the causal effects of the intervention.
In order to detect any causal impact, I use panel data at a detailed geographical scale (2001 Census
Output Areas) and covering years before and after the implementation of the programme. My analysis is
complicated by two factors: (1) the geographical spread of the policy is unknown a priori; (2) destination
areas are not randomly chosen. To solve these issues, I firstly construct treatment intensity variables:
adapting the approach from Gibbons et al. (2011), I construct a measure of treatment intensity that is a
non-parametric function of the distance to a relocation site. In other words, I assume that effects are
additive and vary by distance. Secondly, I compare neighbouring areas at increasing distance from a
relocation site. In doing so, I also restrict the comparison to areas that are similar in terms of initial
socio-economic and demographic characteristics. My empirical strategy is to apply a treatment intensity
approach, which can be considered an extension of a difference-in-difference approach with heterogeneous
(rather than constant) treatment effects (see Angrist and Imbens, 1995). Similarly to a
in-difference approach, I exploit the temporal and spatial variation in the data. Differently from a in-
difference-in-difference approach, I cannot clearly distinguish between ‘treated’ and ‘untreated’ areas. In fact, all
areas can be considered as treated, but they are treated at a different level of intensity. Areas close to a
relocation site should be affected (i.e. treated) more intensively than areas further away with intensity
decreasing monotonically with distance.
The policy stretches over an eighth-year period (2003-2010). Given the complexities surrounding
the 2008 recession, this study provides short-run estimates of the policy effects. It finds that the dispersal
of public sector jobs that followed the implementation of the Lyons Review (2004) has an overall positive
impact on private sector employment at the local level. Results suggest that the arrival of 10 civil service
jobs in an area spurs the creation of about 5.5 jobs in the private sector. It also affects the sector composition
of local jobs: it stimulates services, whereas it has a negative but weaker impact on manufacturing. The
study also finds evidence of displacement – particularly for local services. There is, in fact, a tendency for
private businesses to locate closer to a relocation site, moving out of areas at 1-2km distance and into areas
at 0-1km distance. In addition, the study finds that effects are highly localised: i.e. the largest impact is
found in areas that received the relocated jobs; spillover effects for an average OA are substantially smaller
than the direct effect; and spillover effects reduce sharply over distance. There is no impact beyond the
0-2km ring.
These findings seem robust to a series of checks: verifying that central government employment
indeed expanded in areas that received the relocated jobs; conducting a falsification or placebo test by
estimating the impact of the relocation programme on changes in outcomes during a pre-treatment period
(2000-2001); and replicating the analysis using a courser geographical scale (2001 Lower Layer Super
3 associated with a larger policy impact and to explore which demand channel (either consumer demand or
intermediate demand) is more likely to explain the positive impact on services.
This paper contributes to the growing literature on the evaluation of place-based government
policies. As also noted by Einio and Overman (2012), earlier studies were impaired by the problem of
non-random placement.4 Later studies have combined data at a finer spatial scale with well-designed
identification strategies to overcome the problem of causal inference in non-experimental settings. In the
US, Enterprise and Empowerment Zone programmes have been successfully evaluated by Neumark and
Kolko (2010); Busso and Kline (2008); and Busso et al. (2013). Other less well-known programmes, like
the New Market Tax Credit, have also been carefully evaluated (see Freedman, 2012 and 2015). In Europe
and the UK, evaluations of the French Enterprise zone programmes, the UK LEGI and the UK Single
Regeneration Budget stand out for accuracy.5 To help identification, this study combines a treatment
intensity approach with fine spatial scale data as presently available.
This paper also makes an original contribution to the literature on the dispersal of public sector
workers. To my knowledge, no previous study has looked at the local impact of a public sector relocation
programme using detailed spatial data and taking identification issues seriously. Previous out-of-London
relocation studies have focused on the financial costs and benefits of the moves (see, among others,
Goddard and Pye, 1977; Ashcroft et al., 1988; Marshall et al., 1991; Deloitte, 2004); some have provided
descriptive evidence usually based on interviews with internal managers responsible for implementing
relocations and/or secondary data sources (see, e.g., Marshall et al., 2003; Experian, 2004); others have
used regional input-output models6 aimed at ex-ante predicting the local multiplier impact of proposed
dispersals (see, also, Ashcroft and Swales, 1982a and 1982b).
In addition, the paper contributes to a small literature (Rosenthal and Strange, 2003, 2008; Arzaghi
and Henderson, 2008; Andersson et al., 2004, 2009) on the spatial range of agglomeration effects. These
effects seem to be local. Looking at the impact of additional employees on small new establishments in the
US, Rosenthal and Strange (2003) suggest that external economies of agglomeration are sharply attenuated
by distance. When studying the case of New York City, Arzaghi and Henderson (2008) document
significant productivity gain from the co-location of firms in Manhattan, but gains attenuate rapidly over
space. Turning to Sweden, Andersson et al. (2004, 2009) investigate the impact of university
decentralization and find substantial but highly localized spillovers on firm productivity over distance. The
present study also finds that effects are concentrated within the first few kilometres from a relocation site.
Faggio and Overman (2014) is the paper most closely related to the present one. Using
geographical information on 352 English Local Authorities (LAs), they look at the impact of changes in
public sector employment on the local labour market. They find that public sector employment has no
4 As pointed out by the literature on program treatment effects (see Heckman et al., 1999; DiNardo and Lee, 2011), the problem of causal inference in non-experimental evaluations can be substantial.
5 See Gobillon et al. (2012); Mayer et al. (2012); Einio and Overman (2012); Gibbons et al. (2011).
6 There is an extensive literature on regional input-output models. See Miller and Blair (2009) for a textbook reference
4 impact on total private sector employment at the LA level. They do find, however, that public sector
employment changes the local composition of private sector jobs: it stimulates the provision of
locally-produced services, while it has a negative effect on manufacturing jobs. The results in this paper are largely
consistent with those found in Faggio and Overman (2014).
There are, however, important differences between the two studies. Firstly, Faggio and Overman
(2014)’s analysis is not a policy evaluation. They do not explore the specific impact of the Lyons Review
or of any other place-based policy, but they look at 2003-2007 changes in total public sector employment
at the local level. As documented in Cribb et al. (2014), these changes were largely driven by the UK
public sector expansion in health and education.7 Conversely, this study provides the first thorough
evaluation of a relocation programme and focuses on the dispersal of 25,000 central government jobs.
Secondly, as already noted, they conduct the analysis at a much higher level of aggregation (using 352
English LAs) than the one used here (based on about 167,000 Output Areas covering England, Wales and
Scotland). Thirdly, they apply a Bartik-IV estimation approach, whereas this study uses treatment intensity
variables and exploits data variation across space and over time. As for the results, Faggio and Overman
(2014) find that 100 additional public sector jobs in an area spurred the creation of about 50 service jobs
while crowding out 40 manufacturing jobs. The present study finds that the dispersal of civil service jobs
has an overall positive impact on total private sector employment. It also provides evidence that the positive
impact on services more than compensates the negative impact on manufacturing.
It is worth noting that the debate on public sector relocation is not limited to the UK.8 Little
attention, however, has been paid in previous (largely European) research to estimate the local labour
market impact of a relocation programme. An exception is the paper by Becker et al. (2012), which looks
at the rise of Bonn as the new federal capital of Western Germany at the end of World War II. Becker et
al. (2012) investigate how this historic government relocation from Berlin to Bonn changed the local
economic structure of the new capital relative to other cities of similar initial size and demographic
characteristics. They find limited effects, given the extent and relevance of the relocation.
The remainder of the paper is structured as follows: Section 2 provides background on the
relocation program, Section 3 discusses a simple conceptual framework and Section 4 introduces the
7 Using ONS Public Sector Employment Statistics, Cribb et al. (2014) document that the majority of public sector jobs were created in health and education during the 2000s. While the number in public administration remained stable at around 1.2-1.3 million, NHS workforce grew by 33.3% (from 1.2 million in 2000 to 1.6 million in 2010) and education grew by 14.3% (from 1.4 to 1.7 million during the same period). Hence, Faggio and Overman (2014)’s measure of public sector growth is more likely to pick up the expansion in health and education than any dispersal of central government workers.
8 See, among others, Daniels (1985), Clarke (1998), and Guyomarch (1999) for France; Cochrane and Passmore
(2001), Haeussermann and Kapphen (2003) for Germany; Myung-Jin Jun (2007) for Korea. As of April 2015, the Danish parliament is debating the relocation of 4,000 jobs out of Copenhagen to less prosperous areas (see Christiansen, F., 2015, http://www.pressreader.com/denmark/politiken/20151011/281522224919239/TextView,
5 empirical strategy. While Section 5 describes the data used, Section 6 presents the results. Section 7
6 2. The institutional setting
In 2004, Sir Michael Lyons led a government-sponsored review on the scope for relocating central
government activities out of London and the South East to more peripheral regions. The review proposed
the dispersal of about 20,000 civil service jobs within the six-year period ending in March 2010. The
programme developed very strong ‘push’ factors, like relocation targets and property controls, to drive
posts out of London at an early stage. Such targets were agreed with departments as part of the review
process. Each department was then accountable for delivering its own target by March 2010. Property
controls stipulated that any government agency wishing to extend the government’s property commitment
in London or in the South East submit a formal business case for approval. This requirement changed
expectations across government: departments needed to justify their presence in London on the grounds of
business needs. Thanks to these push factors, the original target was delivered nearly a year ahead of
schedule. By its end, the programme relocated more than 25,000 jobs.
The Lyons Review had several main objectives: delivering cost savings to taxpayers by reducing
accommodation and labour costs; allowing the modernization of public services; enhancing devolution;
and boosting regional development.
Property costs tend to be higher in London than elsewhere in the country and, most crucially, 14
per cent of government offices (25 per cent of national expenditure) are located in the prime-cost areas of
Central London (see Smith, 2010). Despite the national pay scheme, public sector wages also tend to be
higher in London than in the rest of the UK because of the London weighting allowance.9 Due to the allure
of private sector job opportunities in the capital, there are higher retaining and turnover costs.
In the Experian (2004) report (which provides background research for the Lyons Review),
relocation is also described as a catalyst for re-organising public services and adopting a
performance-driven culture across government departments. It is not accidental that the Lyons Review recommendations
were implemented as a strand of the Gershon Efficiency Review (2004) whose primary objective was civil
service modernisation.
The primary government benefits of devolution, namely reducing cost pressures and relieving
spatial constraints, moves hand in hand with the public benefits of important central government organs
being close to the people; increased confidence and transparency in government decisions; and an
increased sense of belonging. An additional purpose of public sector relocation is to boost regional growth
in UK peripheral areas in an attempt to correct the spatial imbalance between a rich South-East and less
9 The London Weighting is an allowance paid to people who work in London’s public sector. Its purpose is to
7 prosperous regions in the North and the West. This study is about evaluating the programme in light of its
ability to achieve this last objective.
Larkin (2010) notices that the size of the government’s relocation programme was fairly small.
Over the period 2003-2010, the programme dispersed 25,420 jobs out of London and the South East.10
This figure represents about 5 per cent of total civil service employment (full-time equivalent) working in
Britain before the relocations began (Civil Service Statistics, 2003). Looking at the statistics in context,
however, reveals that less than one fifth of all civil servants worked in the capital in 2003 and over 70 per
cent worked outside London and the South East. Therefore, the programme relocated about 20 per cent of
all government jobs initially housed in London or around 17 per cent of those in London and the South
East.
What is interesting is the average number of jobs that successful Travel-to-Work-Areas (TTWAs)
managed to attract under the relocation process. TTWAs are a measure of local labour markets defined
such that at least 75% of the resident population works in the area and 75% of the people working in the
area reside there. These areas are obviously much larger than Output Areas (OAs), containing an average
of about 1,650 OAs each, and vary in size.11 There are a total of 232 TTWAs in England, Wales and
Scotland, with 26 of these covering London and the South East. Out of 206 potential destination areas, 124
TTWAs received no relocated jobs whereas 82 TTWAs attracted on average 304 jobs with a standard
deviation of 455. The dispersion is large: those 82 TTWAs received between 1 and 1,948 full-time
equivalent jobs. At the OA level, the average number of jobs moved was 89 (equivalent to half the number
of 2001 public sector workers in these receiving areas as recorded in the Census) with a standard deviation
of 181. 281 OAs (out of about 167,000)12 were chosen as the preferred destination of between 1 and 1,276
full-time equivalent civil service jobs.
When reading background documentation to the Lyons Review (see, e.g., Experian, 2004;
Deloitte, 2004), it is not clear why some destinations were chosen instead of others. Experian (2004)
recommends the government ‘not to choose a building just because it is available’, thus suggesting that
this might have been the case in past relocations. In addition, it also recommends phasing staff moves in
manageable chunks, again endorsing the idea of choosing buildings with a long-run perspective.
Furthermore, limited information is available on how relocation decisions were made. Although the Office
of Government Commerce (OGC) had the overall responsibility to rationalise the civil service estate and
10 I could collect information on the original locations of 20,550 jobs (out of 25,420). While 82 percent of these moves
were out of London, 18 per cent were out of the South East region.
11 Out of London, the smallest TTWA contains 34 OAs whereas the largest has 5,500 OAs. Output Areas are very
small geographical areas built from clusters of adjacent unit postcodes. See Section 5 for further details.
12 There are about 218,000 Output Areas covering England, Wales and Scotland; about 50,300 of these are in London
8 oversee departmental relocations, each individual department was accountable for managing its own
relocation programme, including filling posts that were transferred, or created, in the new location.
The Smith Review (2010), which followed in the footsteps of the Lyons Review, documents that
the implementation process lacked transparency: there was no government strategic or unified framework
according to which all relocation decisions should have been made. Even within departmental families,
departments did not take direct responsibility for the location choices of their own agencies and
Non-Departmental Public Bodies (NDPBs). Again, information regarding potential destination sites was not
collected and made available to all departments in a transparent way. On the contrary, relocation
decision-making was open to marketing campaigns (often generic) of individual cities, which used substantial
amounts of public money (see Larkin, 2009; Smith, 2010). Lastly, there is no central record of how many
workers actually moved with their job and there are no details of relocation packages offered or
compensations taken. This lack of planning and transparency resulted in higher-than-expected upfront
relocation costs (Smith, 2010).
3. Conceptual Framework
This section presents a simple theoretical framework. The objective is to outline the mechanisms
through which local multiplier effects or crowding-out/ displacement effects may come about. Extending
the work by Moretti (2010), and Faggio and Overman (2014), I discuss the case of a small geographical
area characterised by a fixed amount of land and the arrival into the area of public sector workers offering
a tradable service. My purpose is to detect the implications of such a move for local businesses.
A nationwide economy is made up of many cities j. Each city consists of Nj output areas, where Nj
is large. Output areas are characterised by Labour (L) and Terrain (T). Labour is free to move across output
areas within a city and across cities. The assumption of perfect worker mobility within a city appears
justifiable, as workers commute to work from outlying residential areas to the business district, typically
located in the city centre. The assumption of perfect worker mobility across cities is, in this context, partly
justifiable. Worker relocation programmes implies a certain degree of worker mobility from origin
addresses to destination areas. Even though the Lyons Review did not provide information on how many
people move with their job, the design of the programme envisaged the possibility that people would move
across cities in order to keep their job, being compensated for the cost they would face.
Terrain is an area-specific factor. Each OA is characterised by an endowment of terrain, T. OAs
are small geographical areas of about 1km2, on average, and 7km2 in standard deviation. Real estate space
for both residential and commercial purposes needs terrain to be built (i.e. land scarcity) and the availability
of developable land is further constrained by planning restrictions. Planning restrictions are particularly
binding in the UK: recent studies (e.g., Cheshire and Sheppard, 2002; Cheshire and Hilber, 2008; Hilber
and Vermeulen, 2016) have documented a substantial impact of regulatory constraints on office space costs
and house prices across UK cities. Cheshire and Sheppard (2002) evaluate the net welfare costs these
9 show how regulatory constraints explain the higher cost of office space in Britain relative to other European
business locations. Given this evidence, it seems reasonable to assume that the supply of residential and
non-residential property is inelastic for any OA in the UK, particularly for the short five-year period
considered here.
There are three sectors in the local economy: a public sector which provides a tradable service; a
private sector which provides a non-tradable service; and a private sector which provides a tradable good.
A tradable public sector
This sector consists of service jobs in the public sector that do not require face-to-face contact with
the public on a regular basis. Therefore, their service could equally be provided in the capital or anywhere
else in the nation. This sector includes, for instance, statistician jobs at the Office for National Statistics;
accountant jobs at the HM Revenue & Customs; and economist jobs at the Office for Fair Trading. These
jobs are likely to involve positions in government and non-ministerial departments, executive agencies and
NDPBs, i.e. organisations characterised by a limited contact with the general public. These are precisely
the types of public sector jobs involved in the relocation programme (see Section 5). Given the nature of
these jobs and the fact that they were actually moved, these jobs must offer a tradable service. I abstract
from considering the presence of a public sector providing a non-tradable service. Non-tradable service
jobs are those in public schools, NHS trusts, police forces, fire stations, post offices, etc. They typically
involve a direct involvement with the general public. Neither were they the focus of the Lyons Review,
nor are they the focus of this analysis.
A non-tradable private sector
This sector consists of local service jobs in consultancy, real estate, finance and insurance. These
jobs tend to be spatially concentrated, typically around the city business district, and serve a relatively large
business community. The sector also consists of local service jobs in catering, dry-cleaning and other
personal services, which are spread out more evenly across space driven by population demand.
The arrival of a substantial number of public sector jobs in an area could stimulate (through a local
multiplier effect) the local demand for intermediate inputs in terms of consultancy, legal, accounting and
real estate jobs. Alternatively, the arrival of public sector jobs could increase the consumer demand for
catering, hairdressing and other personal services. Considering the spatial distribution of service jobs,
increases in intermediate demand are likely to occur near the relocated workplace, spillovers in consumer
demand are expected to be more ubiquitous. They could partly occur near the relocated workplace and
partly occur near worker homes. In the empirical analysis, I will test whether effects are highly localized,
i.e. concentrated around OAs receiving the relocated jobs. If this were the case, I would expect the analysis
to capture mostly the impact on intermediate demand instead of consumer demand.
Assuming that the rise in intermediate demand dominates, the arrival of civil servant jobs into an
area will result in an increase in revenues paid to the non-tradable private service sector. This surge in
revenues will likely spur the sector’s jobs. Coupled with this, there will be an increase in the demand for
10
workers look for housing. Given the supply of T is fixed, the increased demand for T will result in upward
pressure on housing costs. Higher rents might drive employers and workers out of the area. The positive
effect on revenues and jobs in the private sector is the so-called ‘local multiplier effect’; the moving-out
of local businesses associated with rising housing costs has been labelled ‘crowding-out effect’.
A tradable private sector
I also consider a local private sector which sells a homogenous good which is tradable. Production
firms can move anywhere across OAs within a city and across cities. In the empirical analysis (see Section
6), I take the conventional view and consider manufacturing activities as providing a tradable good and
private service activities as providing a non-tradable service, although recent work in the offshore literature
has suggested that service activities can also be ordered by various degree of tradability (see Jensen and
Kletzer, 2006).
According to the simple framework sketched so far, the arrival of additional civil servant jobs into
an area might also stimulate the demand for the tradable good (e.g., bread, clothing, or cars). Since the
local production of the homogenous good is small relative to total production, any rise in local demand is
likely to be satisfied by national (rather than local) supply. As a consequence, in this case, the effect on T
is likely to dominate any positive impact on demand. Because of higher housing rents, manufacturing
employers may decide to relocate themselves moving out of costly locales and into less costly areas. In
other words, for the tradable private sector, the crowding-out effect tends to dominate any local multiplier
effect.
To summarise, the inflow of additional public sector workers into a small geographical area is
likely to raise housing costs, creating incentives for local employers to move out of the area (i.e. a
crowding-out effect). In addition, it might stimulate the demand for tradable goods and for
locally-produced services (i.e. local multiplier effects). For the manufacturing sector, the crowding-out effect is
likely to dominate (being the local demand a very small fraction of total demand). For the service sector,
it is hard to know a priori which effect will prevail. Local service firms face a trade-off between incurring
higher rental costs and satisfying a larger customer base.
4. The Empirical Strategy
There are methodological problems associated with ex-post evaluations and the two concepts of
additionality and deadweight may be the most challenging of them. Additionality refers to the outcome of
a policy as compared with what would have occurred without the government intervention. Needless to
say, it is impossible to know what would have happened in any of the chosen locales had they not been
allocated any public sector jobs. In the literature on causal inference (see Heckman et al., 1999, DiNardo
and Lee, 2011), a way of solving this additionality problem is by comparing treated sites with a suitable
control group, but this approach in its simplest form is not viable here.
The related concept of deadweight can be defined as “that part of a public expenditure programme
11 (Mceldowney, 1997, p177). Some amount of deadweight is inevitable in any policy intervention. It is often
difficult to evaluate the extent of the loss. Special forms of deadweight are displacement and crowding out.
As noted in the theoretical framework, public sector employment might put upward pressure on local rents
forcing local businesses to move out of the areas into less costly locales (crowding out effect).
Alternatively, businesses might decide to relocate in the proximity to a treated site where their product
demand is higher, pulling up employment in nearby areas and down in areas further away (displacement
effect). Evaluating the extent of additionality, crowding out and displacement are the main issues of this
paper.
My ex-post evaluation has additional methodological challenges. First, area-based policies raise
questions about ‘people versus area’ effects (see Glaeser and Gottlieb, 2008). When investigating a
place-based intervention, we are often interested in detecting its impact on the people originally living or working
in the area. Unfortunately, area level statistics may be contaminated by people leaving the treated areas
during the implementation of the policy; thereby reflecting both the change in neighbourhood composition
and the extent of any policy impact.
Second, it is hard to measure the causal impact of interventions that are not randomly assigned
(see DiNardo and Lee, 2012). Recent studies (see, e.g., Busso and Kline, 2008; Busso et al., 2013; Neumark
and Kolko, 2010; Einio and Overman, 2012) have successfully combined empirical strategies such as
comparisons of policy applicants and grant recipients; early and late policy rounds; and spatial
differencing, with institutional details for helping identification. In this study, limited information is
available on how government selected relocation sites. Particularly, I do not know how many potential
places were initially considered and according to what criteria the final ones were chosen. This lack of
information hampers the possibility of adopting an applicant-recipient or loser-winner comparison. What
I know is that about two-third of all destinations were hit by multiple job moves. This last institutional
detail hinders the possibility of using early and late policy rounds.
Third, worker relocation programmes like the Lyons Review are policies with a potential
nationwide impact and of which the geographical spread is not known at the start. As a consequence, the
use of spatial differencing is unsuitable in this case. Spatial differencing (i.e. measuring the difference
between an area and its neighbour) is explicitly about evaluating local effects. It cannot be used to assess
the effects of policies that have a national impact, since it relies on (untestable) assumptions that the
spillovers of these policies are limited geographically.
One way of solving these issues is to apply a treatment intensity estimation approach, which allows
areas to be treated at a different level of intensity instead of assuming a constant treatment effect (see
Angrist and Imbens, 1995). In other words, it replaces (or combines) a treatment dummy, typical of a
standard difference-in-difference approach, with treatment intensity variables. In constructing these
12 areas can be treated, although areas close to a relocation site are affected (i.e. treated) more intensively
than areas further away with intensity decreasing monotonically with distance.
In formal terms, this study investigates the impact of a treatment variable and several treatment
intensity variables on outcome (e.g., local private sector employment) using the following estimation
equation:
∆𝒚𝒊 = 𝜸𝟎∆𝑵 𝒊
𝟎+ ∑ 𝜸𝒄∆𝑵 𝒊 𝒄
𝒄 + ∑ 𝜷𝒏 𝒏𝑿𝒊,𝟐𝟎𝟎𝟏 (𝒐𝒓 𝟏𝟗𝟗𝟏)𝒏 + ∆𝜺𝒊 (1)
where ∆𝒚𝒊is the raw change in the outcome measure of interest over the period 2003-2008 in a Output
Area i. ∆𝑵𝒊𝟎 refers to the total number of jobs moved (i.e. the size of the relocation) an OA i received
between 2003 and 2007. Since the OA i could be hit by multiple rounds of relocations during the
2003-2007 period, ∆𝑵𝒊𝟎 refers to the cumulative sum.13∆𝑵
𝒊
𝒄 refers to the total number of jobs moved an OA i
faces within distance band c, with 𝒄 ≥ 𝟏. All buffers have a 1km width. ∑ 𝑿𝒊,𝟐𝟎𝟎𝟏(𝒐𝒓 𝟏𝟗𝟗𝟏)𝒏 refers to a set
of pre-treatment (either 2001 or 1991) area characteristics that include economic activity of residents, age
structure, population density, education shares, household size and dwelling characteristics.14𝜺
𝒊 is an error
term. All specifications also include Travel-To-Work-Area fixed effects and standard errors are clustered
at the TTWA level. In an alternative specification, I assume equal size across all relocations so that the
binary indicators 𝑰𝒊𝒄 are also used as treatment intensity variables. 𝑰𝒊𝒄 is a binary indicator for OA i and
distance band c, equal to 1 if the OA faces at least one relocation site within distance c and equal to 0
otherwise. Similarly, 𝑰𝒊𝟎 refers to a binary indicator for OA i equal to 1 if the OA was chosen as a destination.
The first treatment variable (∆𝑵𝒊𝟎) identifies the treatment effect on OAs that received public sector jobs during 2003-2007 relative to areas that did not receive such jobs. This is equivalent (apart from
measuring the size of the relocation rather than the status of being treated) to a typical treatment dummy
in a standard difference-in-difference approach. If the analysis focused exclusively on this variable, it
would only capture the policy impact on receiving areas. By introducing treatment intensity variables, the
analysis allows for potential spillovers into neighbouring areas to be identified.
In investigating the impact of subsidizing commercial space in deprived areas, Gibbons et al.
(2011)’s analysis is also impaired by not knowing a priori the geographical scale of the treatment. To solve
this issue, they introduce a set of treatment intensity variables to capture the intensity of the effect for each
location by recording the number of subsidized sites within distance bands. Adapting Gibbons et al.
(2011)’s intuition, I construct a set of treatment intensity variables defined as a non-parametric function of
13 While local employment is computed as a change between April 2003 and April 2008, the total number of jobs
moved is aggregated up over the period June 2003-December 2007. In doing so, I leave a three-month period between counting the jobs moved and analyzing the impact.
13 the distance to a relocation site. I proceed as follows: I split Britain into about 218,000 census Output Area,
which is the unit of observation chosen for the analysis (see Section 5 for more details); I measure the
centroid of each OA; I compute the Euclidean distance between each government relocation site and all
OA centroids (both expressed in National Grid references); I then draw 1km-wide buffers from each OA
centroid and count the total number of jobs moved in each buffer. In doing so, I make the assumption that
the effects are additive. I then measure the treatment intensity as an interaction between distance and size,
where size refers to the number of jobs moved.
It is worth noting that the treatment intensity variables included in the estimation are constructed
in a cumulative way: ∆𝑵𝒊𝟏 refers to all relocations (and the associated number of jobs moved) that an OA
i faces within a 0-1km distance band, but outside the OA boundaries.15 The comparison group consists of
OAs that do not face relocations within the 0-1km band, but face relocations at a greater distance. ∆𝑵𝒊𝟐
refers to all relocations that an OA i faces within a 0-2km distance band (which also includes relocations
considered in the 0-1km ring) relative to areas that face relocations beyond the 0-2km ring. ∆𝑵𝒊𝟑 refers to
all relocations an OA i faces within 0-3km band (which also includes relocations considered in the 0-1km
and 1-2km rings) relative to areas that face relocations further away, and so forth. A graphical
representation helps clarify (see Figure 1). Consider two Output Areas, area A and area B, and two
relocation sites, site LL137YY and site LL111BW (in Figure 1, sites are identified by postcodes).
Remember that buffers or distance bands are constructed around OA centroids and not around relocation
sites. If I consider only three 1km-wide buffers, the three treatment intensity vectors in this graphical
representation (with the first element referring to area A and the second element referring to area B) are:
∆𝑵𝟏= (1,0); ∆𝑵𝟐= (2,1); ∆𝑵𝟑= (2,2).
Defining treatment intensity variables in a cumulative way allows me to identify the effects of
relocations within a given distance band (and related 𝜸𝒄 parameters) separately from one another. Consider
the first two treatment intensity variables, ∆𝑵𝒊𝟏and∆𝑵𝒊𝟐,includedin equation (1). 𝜸𝟏 measures the policy
impact for OAs that face relocations within a 0-1km distance band. Even though ∆𝑵𝒊𝟐 includes relocations
at both 0-1km and 1-2km distance bands, 𝜸𝟐 picks up the policy impact for OAs facing relocations at
1-2km distance band only, since the 0-1km impact is already captured by 𝜸𝟏. The same line of reasoning
applies to all subsequent treatment intensity variables.
In principle, equation (1) could include all treatment intensities from 0-1km distance to the
maximum distance and each variable would pick up the impact of relocations on outcomes within a given
distance band. In practice, this over-parameterisation is not necessary. On one hand, it would not be needed
if effects were highly localised. On the other hand, equation (1) could simply include the first 5km or 10km
treatment intensities and then a cumulative treatment intensity variable picking up the policy impact from
5km (or 10km) onwards. For tractability, I will consider 50km as the maximum distance in the empirical
15 In other words, ∆𝑵
𝒊
0 is not included in ∆𝑵 𝒊
1(and in any subsequent ∆𝑵 𝒊
14 analysis and include the first 5km treatment intensity variables as well as a cumulative 5-50km impact
variable in the main specification.16
5. Data Construction
This study uses three data sources: Government relocation data provided by the UK Office of
Government Commerce (OGC)17; the Business Structure Database (BSD); and the UK 1991 and 2001
Censuses of Population.
The Government relocation data are comprehensive: They list the total number of actual job moves
within government departments following the implementation of the Lyons Review (2004). They provide
information on 25,408 public sector jobs relocated out of London and the South East into other UK
destinations between June 2003 and December 2010. The data give details on the date of the move; the
government department and business unit involved; the origin or exporting address of the building from
which a job was relocated; and the destination or importing address of the building receiving the job. Not
all public sector workers were involved, but only those civil servants working for central government
(including government departments, non-ministerial departments and executive agencies) or for special
entities called executive Non-Departmental Public Bodies (NDPBs). UK NDPBs are, for instance, the Care
Quality Commission or the Competition Commission.18
In a substantial number of cases, the geographical information on origin and destination addresses
was missing or misreported. I checked every address in the dataset and filled out the postcodes when
missing, using old government archives, internet search engines and government agency websites. Since
staff moves were phased in manageable chunks, I could identify 1,486 distinct relocations defined by a
moving date, the number of jobs moved and a destination address. The majority of these destinations were
in England (1,126), followed by Wales (222), Scotland (119), and Northern Ireland (19). Given the limited
numbers of relocations into Northern Ireland and the usual difficulties in collecting good quality data for
this country, I exclude Northern Ireland from the final sample, which consists of 1,467 relocations,
involving 24,950 job moves within 20 government departments. The bulk of these changes (about 64% of
16 I have also experimented with alternative ways of aggregating treatment intensities over the 5-50km distance
(5-10km, 10-30km and 30-50km). Since effects are highly localized, it makes no difference.
17 When the Coalition Government came to power in May 2010, the OGC was dismantled and its main functions
became part of the Efficiency and Reform Group at the Cabinet Office.
18 The Lyons Review (2004) gave guidance for the dispersal of civil servants working in government departments
15 relocations and about 65% of job moves) occurred between June 2003 and December 2007 (see Figures
A.3 and A.4).19
It is worth noting three things: First, my analysis focuses on destination areas. It investigates what
happens in areas receiving the additional public sector jobs; it does not try to identify a policy effect in the
capital where there are buoyant private sector opportunities easily filling up vacant buildings as they
appear. Second, it proved harder to identify the exact postcodes in London or the South East where jobs
originated. Out of 1,522 moves, 407 origin addresses report no geographical detail. Conversely, only 36
destination postcodes were not identified. Lastly, the data provides information on the number of jobs (not
workers) moved. I do not know whether a worker who filled the job in London (or in the South East)
actually moved with the relocated job.20 What I know is that civil servant numbers fell by about 16,500
FTE21 workers in London and the South East during 2002-2010 against an increase of about 18,900 in the
rest of England, Wales and Scotland (Civil Service Statistics, 2002-2010).
The second database I use is the Business Structure Database (BSD), which contains information
on about 2.4 million business establishments per year over the period 1997-2011 and includes information
on each business’ date of birth, date of death, postcode, sector of activity (up to 5-digit SIC 2003 code)
and total employment.22 Geocoding the postcodes, I assign each local unit active in England, Wales and
Scotland to a 2001 Census Output Area.
BSD data classify establishments according to their ownership status, distinguishing between
private sector and public sector type.23 Since the study looks at the policy impact on private businesses, I
focus on the former group of establishments and also exclude private sector plants operating in two sectors:
Private Households with Employees (SIC95) and Extra-Territorial Organizations and Bodies (SIC99).
From the UK 2001 Census, I select a rich set of Output Area variables measuring local labour
market characteristics; demographics and population density; household size and types of dwelling; means
of transport and average commuting distance.24 Figures are available for a range of geographical
boundaries. I choose the most local, the 2001 Census Output Area, which builds to larger areas, such as
wards, local authorities and commuting zones. The UK 1991 Census also provides a rich set of similarly
defined area characteristics. The smallest level of geography available in this older Census is the 1991
Enumeration District for England and Wales and 1991 Output Area for Scotland. In order to apply a
19 The first job moves were recorded in June 2003, thus preceding the publication of the Lyons Review (2004). 20 Civil servants were firstly asked to move with the job. If they did not agree, they could either accept a redundancy
package or apply internally for openings in other departments. Anecdotal evidence suggests that a relatively small number of employees actually moved with the job, them being usually young and of junior rank.
21 Staff numbers on a full-time equivalent basis.
22 The initial raw data includes approximately 3 million local units every year. However, I carry out a series of checks
and drop a number of units as detailed in Appendix A: Data Construction.
23 The private sector consists of all plants registered as Company, Sole Proprietor, Partnership, Non-profit Making
Body or Mutual Association. Public sector plants are those defined as Public Corporation/ Nationalized Body, Central Government, and Local Authority.
16 consistent geography over time, 1991 Census data were retrieved at the Enumeration District (and at the
1991 Scottish Output Area) level and then mapped into 2001 Output Areas.25
Introduced in England and Wales in 2001, OAs are built from clusters of five or six adjacent unit
postcodes. They were designed to have similar population sizes26 and be as socially homogenous as
possible (based on tenure of household and dwelling type).27 When first delineated, OAs largely consisted
of entirely urban postcodes or entirely rural postcodes. In total, there are 165,665 OAs in England; 9,769
in Wales; and 42,604 in Scotland.
The final data issue to be resolved concerns the choice of the time period. Figure 2 (Panel 1)
compares the evolution of central government employment between receiving and non-receiving OA over
1998-2011. During the first five years of the programme (2003-2007), central government employment
increased substantially in receiving OAs, rising from an average number of 124 workers in 2002 to about
470 in 2007. During the same period, central government employment in non-receiving OAs rose from 84
to 96 workers. After 2007, although the relocation programme was still active, employment numbers in
receiving OAs remained roughly constant at 400-450. Non-receiving OAs registered another small
increase (from 96 to 114) between 2007 and 2011. It is unclear why the number of civil service workers
did not continue to rise in receiving areas after 2007. The OGC relocation data show that job moves were
recorded during 2008-2010. Alternative explanations are possible: inconsistencies between BSD and OGC
data; job moves were scheduled but did not take place; job moves occurred but were offset by the impact
of other policies. The 2008 recession and the financial crisis that preceded it might have played out
unevenly across space.28 In addition, government austerity measures might have been more detrimental to
areas that have previously benefited from public investment. With the data currently available, I cannot
distinguish between alternative hypotheses. Nonetheless, Figure 2 (Panel 1) validates the choice of
focusing on a shorter time period.
The main analysis looks at the impact of government relocations after the first five years of the
programme (2003-2007) and focuses on 2003-2008 changes in total private sector employment as the
outcome variable. To this end, I aggregate employment data for all BSD establishments that operate in the
private sector (SIC11-SIC93) and belong to a given OA. In addition, I aggregate employment data
25 Enumeration Districts (ED) are the smallest areal unit used in the 1991 Census for England and Wales. These
countries are divided into 106,865 EDs with an average size of 420 residents or 175 households.
26 OAs are required to have a specified minimum size to ensure the confidentiality of data. In England and Wales, the
minimum OA size is 40 households and 100 residents, but the recommended target is rather larger at 125 households. UK OAs are significantly smaller than US Census tracts, which usually have between 2,500 and 8,000 resident persons.
27 OAs were introduced in Scotland with the 1981 Census, although their definition changed over time. In Scotland,
OAs are of relatively smaller size (the minimum OA size is 20 resident households and 50 resident people, with a target size of 50 households) than those in England and Wales. In addition, social homogeneity was not used as a factor in designing Scottish OA boundaries.
28 The 2008 recession was triggered by the global financial crisis of 2007-2008. During those years, the UK
17 distinguishing between manufacturing and services, holding the conventional view that classifies the
manufacturing sector as the tradable sector whereas the service sector as the non-tradable sector. The
former consists of employment in all manufacturing industries (SIC15-SIC37); the latter includes
employment in construction (SIC45); transport (SIC60-SIC64); finance, insurance, real estate (FIRE) and
business activities (SIC65-SIC74); and trade, catering and personal services (SIC50-SIC55;
SIC92-SIC93). More refined industry splits are also considered.
6. Results
6.1. Preliminary steps
As a first preliminary step, I conduct a direct test of the treatment, empirically confirming what
observed in Figure 2 (Panel 1). During 2003-2008, central government employment indeed expanded in
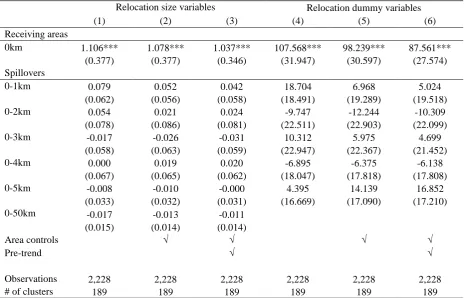
OAs receiving the relocated jobs relative to non-receiving areas. Looking at Table 1 (Columns 1-3), there
is about a 1:1 correspondence between central government employment and the size of the relocation. The
arrival of one civil servant job in an area resulted in one additional employee working locally for the central
government. The coefficient of 1.0-1.1 is highly statistically significant and robust to the inclusion of initial
area characteristics and pre-trend changes in central government employment. Also as expected, there are
no spillover effects: none of the coefficients on the treatment intensity variables included in Table 1 is
statistically significant. Furthermore, findings are robust to the adoption of an alternative specification that
expresses treatment variables as binary indicators. The binary indicator for receiving areas (at 0km) is
reported in the top panel of Table 1, Columns 4-6. A coefficient of 87-107 indicates that central government
employment on average expanded by between 87 and 107 workers during the period 2003-2008 in
receiving versus non-receiving areas. Again, there are no spillover effects.
As a second step, I provide evidence on pre-trends of the main outcome variables (total private
sector employment, manufacturing employment and service employment). Looking at the years preceding
the relocation programme (up to 2002), receiving and non-receiving OAs show similar trends in the
evolution of these variables (see Figure 2, Panels 2-4). For instance, the average number of workers in
private services changed little during 1998-2002 in both receiving and non-receiving OAs: it decreased by
1.34% in the former; it increased by 0.67% in the latter. As for manufacturing, average employment
decreased for both groups between 1998 and 2002: it dropped by 14.5% and 16.3% in receiving and
non-receiving areas, respectively.
Figure 2 also shows the evolution of the outcome variables during the policy implementation.
Looking at the first five years (2003-2007) into the relocation programme, both total private sector
employment and service employment rose more substantially in receiving than non-receiving areas.
Between 2003 and 2007, total private sector employment rose by 20.7% and 9.6% in receiving and
18 for manufacturing, average employment decreased by 2.5% in receiving OAs while it increased by about
the same amount (2.1%) in non-receiving areas.
The picture drastically changed in 2008. Between 2007 and 2008, receiving OAs experienced a
fall in average employment across all sectors of the economy, with the largest drop recorded in
manufacturing (-26.7%). A possible explanation is as follows: as the financial crisis deepens and the
recession kicks in, cost-cutting strategies lead employers to move out of costly areas into less expensive
areas. The reality of a recession approaching tilts the balance towards crowding-out effects and away from
local multiplier effects. Manufacturing employers, who are particularly sensitive to crowding-out effects,
are affected the most. It is worth noting that crowding-out effects appear to dominate six years into the
programme and only when general economic conditions deteriorate.
Looking at service employment, the 2008 drop in employment is relatively smaller (-10%) than
manufacturing. As the financial crisis deepens, it is possible that cost-cutting strategies become attractive
to local service firms too. It is also possible that during the initial phase of a relocation programme, the
government outsources some activities to the private sector, thus generating an extra-boost for the local
economy. As the programme enters a more mature phase and services are again insourced, this boost is
likely to fade. Given the difficulty in distinguishing between alternative hypotheses and the complexities
surrounding the recession, the remainder of the paper focuses on 2003-2008 changes, thus providing a
short-term analysis of the relocation programme.
6.2.Main analysis
The main objective of this study is to evaluate whether the arrival of public sector workers into an
area had any impact on local private businesses. In the analysis that follows, I report results with treatment
intensity variables defined as the total number of jobs moved within a given distance band.29 It seems
plausible to expect that not only receiving a relocation, but also the number of jobs moved matters for a
local area.
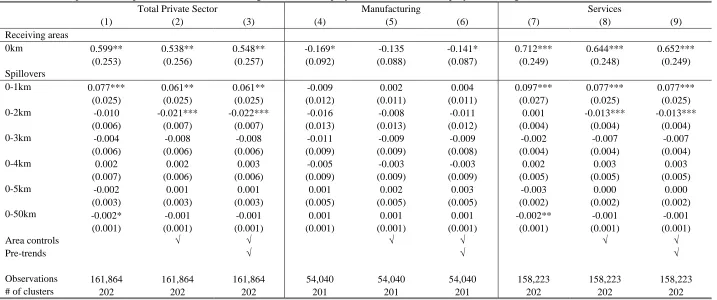
Table 2 shows results for three outcome variables: total private sector employment, manufacturing
employment and service employment. Table 2 is organised as follows: Columns (1), (4) and (7) report
baseline results without controls; Columns (2), (5) and (8) include pre-treatment area characteristics as
controls; Columns (3), (6) and (9) include both area characteristics and pre-trends. There are concerns that
the negative trend in manufacturing employment that started in the 1980s (and continues today) could
affect the estimation. In addition, area-specific shocks could be driving the response of businesses in areas
local to a relocation site. Therefore, I construct pre-trend variables measuring the changes in total private,
manufacturing and service employment during 1998-2002, a period before the implementation of the
programme. I then include the 1998-2002 changes in total private sector employment as an additional
19 control in Columns (3). Pre-trends for manufacturing and service employment are added to Columns (6)
and (9), respectively.
I start presenting results for total private sector employment across all sectors of the economy (see
Table 2, Columns 1-3). Evidence suggests that the implementation of the Lyons Review had a positive
impact on total private sector employment in areas that received the relocated jobs (see Table 2, Column
1, top panel). A coefficient of 0.599 (s.e. 0.253) implies that the arrival of 10 public sector jobs in an area
triggered the creation of 6 additional jobs in the private sector. Estimates are slightly lower (coeff. 0.548;
s.e. 0.257) when both area characteristics and pre-trends are included in the estimation. Looking at
spillovers (see Table 2, Column 3, bottom panel), there is evidence of displacement: the policy had a
positive impact on private sector employment in areas within a 0-1km distance to a relocation site, whereas
it had a negative impact on areas at 1-2km distance.
Treatment intensity parameters in Table 2 capture the average impact on an OA within a given
distance band. Nonetheless, the number of OAs contained in each band increases with distance. For
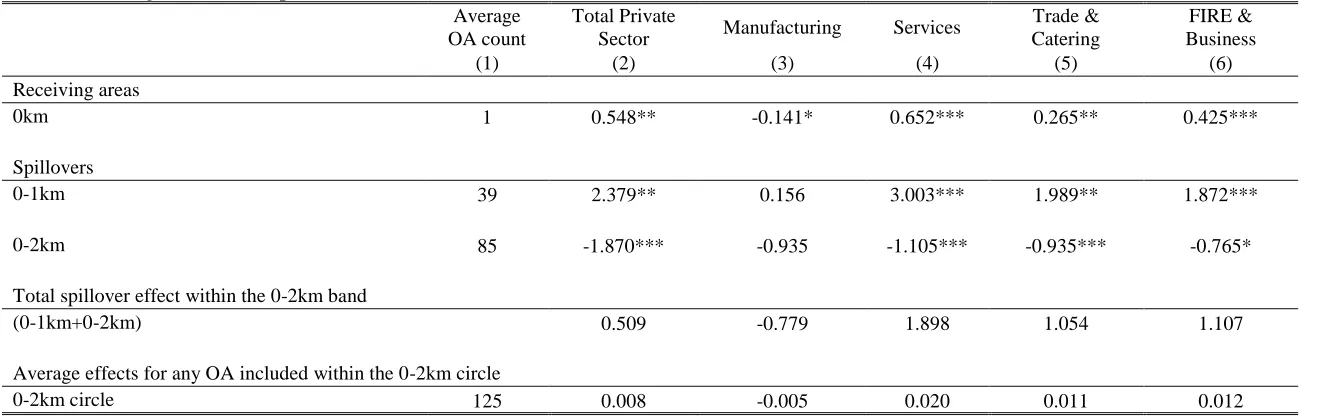
example, the first and the second rings consist of about 39 and 85 OAs, respectively. By multiplying the
coefficients reported in Table 2, Columns (3) with their corresponding counts of OAs, I obtain average
total effects of 2.379 and -1.870 for the 0-1km and 1-2km ring, respectively (see Table 3, Column 2). These
coefficients suggest that the arrival of 10 civil service jobs in an area spurs the creation of about 24
additional jobs in the private sector within the first distance band and the destruction of about 19 jobs
within the second band. These results also indicate that displacement is not complete: the positive impact
within the 0-1km band more than compensates the negative impact within the (larger) 1-2km band.
Furthermore, I can compute the average effect for any OA included within the 0-2km circle as a weighted
average of direct and indirect effects.30 By using the coefficients reported in Table 2, Column (3) (0km,
0-1km and 0-2km rows), I obtain an average effect of 0.008. That is, the arrival of 100 civil servant jobs in
an area (central to the 0-2km circle) spurs the creation of 0.8 new jobs in the private sector in any of the
125 OAs within the 0-2km space.
Consider now the results for manufacturing employment. Looking at receiving OAs (see Table 2,
Columns 4-6, top panel), the dispersal of public sector jobs had a negative but limited impact on
manufacturing employment. The estimate in Column (4) is -0.169 (s.e. 0.092) suggesting that for 10 new
central government jobs created in an area, manufacturing employment on average falls by 1.7. When
including both area characteristics and pre-trends (see Column 6, top panel), estimates become smaller and
20 turn borderline significant (coeff. -0.141; s.e. 0.087). For manufacturing, there are no significant spillover
effects.
Turning to services (see Table 2, Columns 7-9), I detect a positive impact of the relocation
programme. Results without area controls (see Columns 7, top panel) suggest that the arrival of 10
additional public sector jobs in an area triggered the creation of 7 additional jobs in local services. As area
controls and pre-trends are included in the estimation (see Columns 8-9, top panel), coefficients decrease
in size, but remain highly significant. There is also evidence of a displacement effect, i.e. a tendency for
private businesses to locate closer to a relocation site. As noted earlier, displacement is not complete: by
taking into account the average number of OAs in the first two rings, the average total effect within the
first band (3.003) is more than double the negative effect within the second (-1.105). Moreover, the average
effect for any OA included within the 0-2km space is 0.020 (see Table 3, Column 4). In other words, the
arrival of 100 civil servant jobs in an area (central to the 0-2km circle) spurs the creation of 2 new jobs in
local services in any of the 125 OAs contained in that circle.
Consistent with Faggio and Overman (2014), the results presented in Table 2 indicate that public
sector dispersal affects the sector composition of local jobs. While it stimulates local services, it has a
negative but weaker impact on manufacturing employment. Differently from Faggio and Overman (2014),
Table 2 shows that the dispersal of public sector jobs has an overall positive impact on private sector
employment and that the positive impact on services more than offsets the negative impact on
manufacturing. Furthermore, Table 3 gives evidence of incomplete displacement, showing that average
spillover effects within the first and the second ring do not cancel each other out, with the resulting impact
being mostly positive.
Consistent with a growing literature on the spatial range of agglomeration effects (see, e.g.,
Rosenthal and Strange, 2003; Arzaghi and Henderson, 2008), Table 2 also shows that effects are highly
localised: i.e. the largest impact is found in receiving OAs, spillovers effects for an average OA are
substantially smaller than the direct effect, and there are no spillovers beyond the 0-2km ring. For instance,
Andersson et al. (2004; 2009) look at university decentralization in Sweden as a form of regional fiscal
policy. They find that the creation of new research centres and universities is beneficial to local businesses
in terms of higher firm productivity and creativity. These productivity gains, however, attenuate sharply
over distance. Evidence reported in Table 2 suggests that the implementation of the Lyons Review
generated patterns in the UK that are similar to those found in other countries.
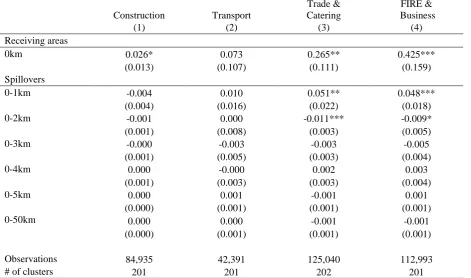
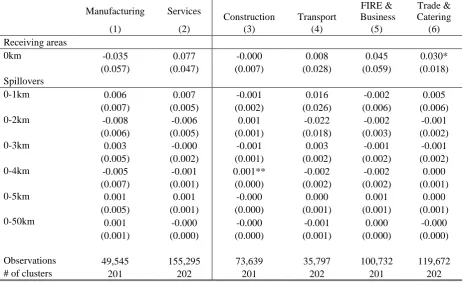
6.3.Industry disaggregation
Results presented so far rely on aggregated industry groups. An interesting way of slicing the data
is to use a more detailed industry classification which splits the private sector into sub-groups. Coupled
with manufacturing and services, the private sector includes agriculture and mining, also referred to as