City, University of London Institutional Repository
Citation
: Short, J. and Sikora, I. (2016). Hazard Identification In Part-145 Approved
Maintenance Organisations: The Management Of Risk Attitude. In: International Scientific
Conference on Science and Transport Development (ZIRP 2016): Perspectives on Croatian
3PL Industry in Acquiring International Cargo Flows. (pp. 181-191). Zagreb, Croatia: Fakultet
prometnih znanosti (University of Zagreb). ISBN 978 - 953 - 243 - 081 - 3
This is the accepted version of the paper.
This version of the publication may differ from the final published
version.
Permanent repository link:
http://openaccess.city.ac.uk/16854/
Link to published version
:
Copyright and reuse:
City Research Online aims to make research
outputs of City, University of London available to a wider audience.
Copyright and Moral Rights remain with the author(s) and/or copyright
holders. URLs from City Research Online may be freely distributed and
linked to.
City Research Online:
http://openaccess.city.ac.uk/
publications@city.ac.uk
HAZARD IDENTIFICATION IN PART-145 APPROVED
MAINTENANCE ORGANISATIONS:
THE MANAGEMENT OF RISK ATTITUDE
Johnny Short BSc (Hons 1) MSc ARAeS PCQI
Continuing Airworthiness Support Officer, National Police Air Service, UK
E-mail: johnny.short@npas.pnn.police.uk / johnny.short@btinternet.com
Dr Ivan Sikora PhD MRAeS FHEA
Programme Director, MSc Air Safety Management, City University London
E-mail: ivan.sikora.1@city.ac.uk
PLEASE NOTE: This document has been prepared with the kind participation of an EASA registered Part-145 Approved Maintenance Organisation. The identity of the organisation is protected, and throughout this document, they are referred to exclusively as “Company A”.
DISCLAIMER: “Company A” is an entirely fictitious reference intended solely for the purposes of this document. When using this title, any similarity to any actual company, registered or otherwise, is entirely coincidental and unintentional.
1
ABSTRACT
Risk is an unavoidable part of the aviation industry, and describes both an inherent uncertainty, and an appreciation of the degree to which this uncertainty matters [9]. It is a well-known aphorism that ‘one cannot manage what one cannot measure’, and so the identification of hazards is the first step towards the management of safety risk [11]. A hazard may be defined as something with “the potential to cause harm”, yet different attitudes and perceptions mean that their recognition may be highly subjective because of “[exposure] to sources of explicit and implicit bias”. This means that what appears hostile to some may appear benign to others [9].
In an effort to promote safety and sustain airworthiness, Approved Maintenance Organisations (AMO) are one of the most regulated aspects of the aviation industry. As an imperfect, human-built and human-led system, basic fallibility means that the performance of any aviation organisation will unavoidably deviate that which is planned. This research has shown that a balance of compliance and flexibility is essential to the continued operation of such systems in an “uncertain and dynamic world”, and so aviation is reliant upon the management of risk attitude to provide an enveloping response to uncertainty and safety risk [16].
Through analysis of the safety performance of an EASA registered Part 145 AMO, this project has shown that risk attitudes and perception play an integral role in the identification of safety risk. Whilst the scope and nature of the various risk attitude biases could not be fully quantified, further analysis has shown that Safety Performance Monitoring and Measurement is the first step toward this goal, whilst helping to reduce uncertainty and manage subjectivity across the operational environment.
Recommendations address the mitigation of conscious, subconscious and affective biases, and aim to enhance situational awareness and improve hazard identification. These include the standardisation of the risk assessment process, improved levels of quantitative performance monitoring, and improved awareness amongst operational personnel of the potential impact of specific situational risk attitude influences.
Ultimately, this research has shown that the greatest asset to any AMO is its constituent staff members, and the promotion of risk attitude and error wisdom has been shown to enhance operational safety by allowing personnel to develop their understanding and management of their own limitations, whilst adapting their risk attitude to that required by the situation, the context and their skills.
KEY WORDS
HAZARD IDENTIFICATION IN APPROVED MAINTENANCE ORGANISATIONS: THE MANAGEMENT OF RISK ATTITUDE
2
INTRODUCTION
The aviation industry is one of the most complex socio-technical systems ever developed, and air travel is widely regarded as the safest mode of transport in the world [23].For many years, a key contributor to this enviable success has been the strategic utilisation of safety management systems (SMS); a toolbox for the systematic, proactive and business-like approach to the management of safety risk.
As one of the core components of any SMS, the correct identification of hazards is the first step toward effective safety risk management because “hazards that go unnoticed cannot be managed” or controlled [4]. Should assessment of the probability of the hazard or of the severity of its consequences be insufficient, then the reliability and effectiveness of mitigation strategies is reduced, and the value of risk management cannot be assured.
A key component in the identification of hazards is the process of perception; the fundamental ability “to see, hear, or become aware of something”. As risks are identified, assessed and managed by people, perception does not always mirror reality, and so what appears hostile to some may appear benign to others. This makes the hazard identification process highly subjective, and so in order to improve the management of safety risk and enhance underlying decision making, it is important to recognise and understand the values, attitudes and behaviours that subconsciously influence both defence and mitigation strategies.
In an attempt to manage the risks posed by actions and behaviour, aviation deploys a variety of strategies in an attempt to constrain and regulate both behaviours and their consequences. This has resulted in the widespread use of tools including checklists, training, and other “soft” mitigations. Unfortunately, whilst the importance of these risk management techniques is undeniable, they are often inherently flawed, because it is impossible to anticipate in a systematic or reliable manner “typical human frailties such as distraction, tiredness and forgetfulness”. Such frailties result in an unavoidable deviation from planned system performance, and so the effectiveness of soft mitigations is limited by their context of creation and their reliance upon human performance [11].
Thankfully, by recognising the limitations of rule-based defence and mitigation strategies, an SMS can provide a tailored and specific framework from where an organisation can manage risk within its own unique operational environment, whilst reducing the “contextual limitations” that beset sheer regulatory compliance [11].
[image:3.595.183.414.560.725.2]Unfortunately, whilst the dynamic and flexible nature of an SMS can be of considerable benefit, it must be recognised that Approved Maintenance Organisations (AMO’s) remain one of the most regulated areas of the aviation industry. This regulation is essential to support the set, non-subjective standards necessary to attain airworthiness, and so determine whether an aircraft is safe for flight [20]. This means that to effectively promote safe operation, an AMO must balance the flexibility of safety management against the constraints inherent to compliance. An appropriate understanding of the true drivers behind the hazard identification process is therefore fundamental (Figure 1 & Graph 1):
Figure 1: The Balance of Resources
[Source: Created by author through interpretation of “The Management Dilemma” (The Dilemma of 2P’s) from:
Graph 1: Compliance vs. Flexibility
(Source: Concept created by author)
3
METHODOLOGY
In order to investigate the underlying drivers of the hazard identification process, this study utilises primary safety occurrence data from an EASA registered Part-145 AMO to produce a quantitative interpretation of safety performance. As primary data, this quantitative information was collected and analysed directly by the author from operational safety data. This data was obtained from a participant organisation, referred to exclusively within this paper as “Company A”.
Quantitative analysis has been used to assess the attitudes toward the hazards, risks and threats that contribute to the creation of “Company A” defence strategies, supporting qualitative analysis of the complex influence of perception and risk attitudes on the hazard identification process. This is achieved through examination of the existing attitudes and perceptions of individuals and the impact of general risk attitude situational influences, against comparison with the generic risk attitude spectrum.
The intrinsic variability of human psychology means that different perceptions and risk attitudes are inevitable, and unavoidable biases such as distraction, fatigue and task familiarity introduce inherent system subjectivity. By analysing quantitative and qualitative safety data, this research aims to create practical recommendations to reduce the subjectivity between different perceptions and risk attitudes, by helping to standardise behaviour, improve situational awareness and increase process resilience. It is hoped that through development of the management and assessment of risk attitude, these recommendations can help “Company A” to better understand and manage its unique operational environment whilst continuing to improve safety defences.
4
RESULTS
To support the requirements of its safety reporting policy, “Company A” maintains an electronic database of all safety reports, using a computerised software package [19]. In order to collate and process data, this software uses quality assurance techniques combined with traditional flight safety theory, and to assist in the safety performance monitoring and measurement process, all reports are allocated the following criteria:
Occurrence Type Occurrence Date Occurrence Category Occurrence Number
Location Risk Likelihood Severity
Primarily, each report was correlated according to its “category”. “Company A” operates a fixed number of categories, and these include examples such as “damage through collision”, “installation error”, and “procedures not followed”. Within the database, each occurrence is automatically assigned a safety risk defined as either “low”, “medium”, or “high”, and this risk relates to the perceived potential impact of the occurrence on flight safety [1].
HAZARD IDENTIFICATION IN APPROVED MAINTENANCE ORGANISATIONS: THE MANAGEMENT OF RISK ATTITUDE
Overall, the average number of occurrences across the 62 categories was 4.48, and the standard deviation was 5.06. The range of occurrence quantities spanned from 1 to 22, and 63.2% of all occurrences could be found in just 10 of the occurrence categories. This suggests that majority of occurrences are distributed over a narrow spread of event types.
[image:5.595.167.428.140.382.2]A breakdown of the risk, severity and likelihood across the 193 occurrences may be observed as follows (Table 1):
Table 1: Summary of Risk, Severity & Likelihood
(Source: Created by Author from “Company A” Safety Data)
The results of Table 1 shows that overall, 79% of “Company A” events are low risk, 70% of all occurrences are insignificant/minor in severity, and 64% improbable/possible in likelihood. The computerised software used by “Company A” automatically generates a value of safety risk dependent on the likelihood and severity data that is provided through qualitative assessment by “Company A” personnel. This technique follows the general principles of the ARMS Methodology for Operational Risk Assessment in Aviation Organisations [1].
Across, the period of analysis, “Company A” serviced 1261 aircraft, and to provide a supporting background to the initial data extracted, each aircraft was included in the dataset from the start of its maintenance input. This means that each aircraft was accounted for in only one monthly period, even if the aircraft’s stay was for an extended duration. In an attempt to enhance the reliability of the results, further information was not included owing to the complex and manual nature of the data extraction process.
[image:5.595.165.432.618.750.2]By combining the results of the dataset with the total aircraft serviced, it is possible to produce a summary of the relationship between aircraft, occurrences, risk, severity and likelihood (Table 2):
Table 2: Overall Safety Statistics
Overall Results
Total Number of Aircraft 1261 Total Number of Occurrences 193 Average Occurrences Per Aircraft 0.16 Risk Average 1.21 Severity Average 2.21 Likelihood Average 1.83
(Source: Created by Author from “Company A” Safety Data)
(Please note: The values given for risk, severity and likelihood relate to the “x” values shown in column 1 of Table 1)
In order to provide additional contextual information and support enhanced conclusions, 20% of the dataset was extracted for further qualitative analysis using stratified sample techniques. This method ensured that different events were given a different representation within the sample, proportionate to their frequency and contribution to the entire population
.
x Risk n % (0 d.p) nx Overall Risk Avg.
3 HIGH 1 1% 3
2 MEDIUM 39 20% 78 (nx / x)
1 LOW 153 79% 153
193 (100%) 234 1.21
x Severity n % (0 d.p) nx Overall
Severity Avg.
5 Massive 2 1% 10
4 Extensive 3 2% 12
3 Major 41 21% 123
2 Minor 135 70% 270
1 Insignificant 12 6% 12
193 (100%) 427 2.21
x Likelihood n % (0 d.p) nx
Overall Likelihood
Avg.
5 Common 0 0% 0
4 Frequent 3 2% 12
3 Occasional 14 7% 42
2 Possible 124 64% 248
1 Improbable 52 27% 52
The top-5 occurrence categories were extracted from the whole population, and first sorted according to their frequency. They were then stratified again to provide a proportionate sample of occurrences according to their risk. Individual occurrence events were then extracted from the overall population using a random sampling technique. The codes within this table relate to the raw occurrence identification numbers in the “Company A” safety database. The stratified extraction results may be shown as follows (Table 3):
Table 3: Occurrence Extract
Category RISK TOTAL
Low Subtotal Medium Subtotal High Subtotal
Installation Error O 2941 -13 O 373 -14 O 2436 -13 O 431 -14 O 1148 -14 O 3108 -14 O 3116 -14 7 O 3159 -13 O 95 -14 O 3104 -13 3 O 1131 -14
1 11
Damage to Aircraft
Components O
81 -14 O 2595 -14 O 137 -14 O 67 -14 O 2077 -14 O 2930 -13 O 261 -14 O 1289 -14 8 O 2850 -13 O 22
-14 2 x 0 10
Collision/ Impact O 2608 -14 O 2441 -13 O 2844 -14 O 2362 -14 O 75 -14 5 O 2877 -13 O 2953 -13 O 804 -14
3 x 0 8
Health and Safety
Issue O2909
-13 O 200 -14 O 2081 -14 O 3042 -14 O 2191 -14 5 O 729 -14
1 x 0 6
Parts Damaged/
Unserviceable O544
-14 O 3128 -14 2 O 1645 -14 O 2457 -14 O 2586 -14
3 x 0 5
TOTAL 7 12 6 2 27 2 4 3 3 12 0 0 1 0 1 40
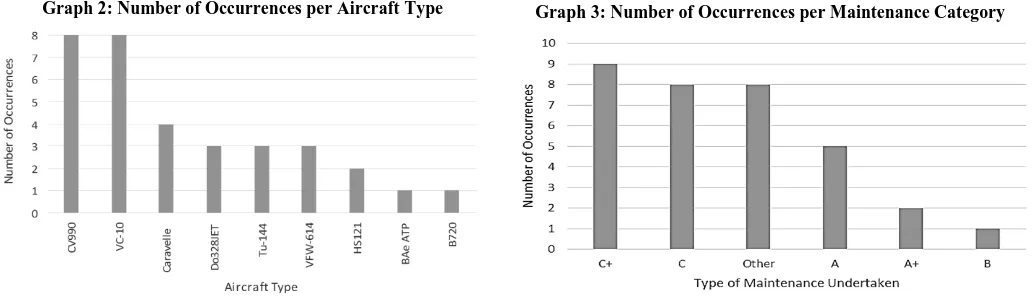
Of the 45 events in the stratified sample, 12 were excluded as they provided either inappropriate/insufficient evidence for analysis, or insufficient information to support an assessment of risk attitude. In order to support additional conclusions, the 33 remaining occurrences were then re-categorised by aircraft type, type of maintenance undertaken, and the type of safety report, a graphical extract of this data is shown below (Graph 2 & Graph 3):
Graph 2: Number of Occurrences per Aircraft Type Graph 3: Number of Occurrences per Maintenance Category
(Source: Created by author through interpretation of “Company A” Safety and Maintenance Planning Data)
For “Company A” operations, the modal results from the stratified sample conclude that a safety occurrence is most likely to involve a low-risk installation error during “Category C+” maintenance on “Vickers VC-10” or “Convair 990” aircraft. In order to promote the reliability of research findings, it cannot be determined to what proportion these aircraft types and maintenance criteria represent the overall operations of “Company A”, because factors including increased aircraft type exposure would increase the inherent probability of a safety event. This means that whilst the stratified sample is representative of the safety occurrence dataset, it may not necessarily be representative of the overall “Company A” operations.
HAZARD IDENTIFICATION IN APPROVED MAINTENANCE ORGANISATIONS: THE MANAGEMENT OF RISK ATTITUDE
Overall, the results within the stratified sample appear to demonstrate that “Company A” is reliant upon traditional “soft” mitigation strategies, in contrast to the mitigation of underlying causal factors such as inadequate human performance, distraction or fatigue. This traditional approach to risk mitigation suggests that by improving its understanding, management and recognition of the effects of risk attitude, there is significant potential for “Company A” to improve its safety defences by implementing strategies to target system-wide human performance deficits, whilst continuing to balance necessary compliance against system flexibility.
5
FINDINGS AND DISCUSSION
By analysing the relationship between occurrence frequency and the number of aircraft serviced, results show that for “Company A”, the relationship between occurrence frequency and safety risk is not proportional. This suggests that “Company A” operations concur with the accepted theory that the relationship between occurrence frequency and safety risk is non-linear. This suggests that a high number of aircraft serviced is not necessarily indicative of “high” risk, and there are a much greater number of high frequency-lower risk events than serious fatal accidents. This occurs because statistically, “millions of operational errors are made before a major safety breakdown occurs” [11 & 22].
The inherent uncertainty involved in the management of risk makes it “important to understand [the] factors capable of influencing individual risk attitudes, so that their effect[s] can be countered and managed proactively where they lead to inappropriate responses to uncertainty”.The assessment of “how well people understand the chances that they take, and whether they embrace the consequences” is inherently different for different individuals, and this makes it possible to assign “headlines to describe alternative positions adopted by people when faced with uncertainty” [8 & 9].
Of the events within this study, the results of the stratified sample showed that:
o 47% of events provided evidence of an active decision making process, 53% did not.
o 62% included an inappropriate or “low” perception of hazard probability. A further 18% showed a “medium” perception, 10% showed “high” perception, and 20% could not be assessed.
o 44% included an inappropriate or “low” perception of a hazard’s impact magnitude. A further 35% showed a “medium” perception, 6% a “high” perception, and 15% could not be assessed.
o 43% of events contained a “high” degree of control or choice over the active situation. A further 17% were “low”, 10% were medium, and 30% could not be assessed.
o 38% had an accurate assessment of the closeness of the risk in time, 42% did not.
o 43% had a “high” perception of the potential for direct consequences. A further 27% showed “low” perception, and the remaining 30% were split equally between “medium” and “unable to assess”.
o Overall, 28% of occurrences contained insufficient information to support analysis in at least one of the categories required. These occurrences were excluded.
o 93% of the sample were “error reports”, 7% were “hazard reports”.
o 72% of events resulted in “tangible” evidence, such as aircraft damage, which could not be ignored.
(Please Note: All percentages are correct to 0 decimal places)
When combined, results show that the modal occurrence within the stratified sample contains a low/inadequate perception hazard impact magnitude, and an inadequate perception of the probability or frequency of occurrence. When combined with the control/degree of choice over an active situation, these results suggest that subconcious perception and risk attitude play a significant role in actions, behaviour and decision making across the occurrence sample. This is in contrast to examples of active, conscious risk taking or deliberately reckless behaviour.
As a key element in the recognition of uncertainty, perception is an integral foundation in the risk management process. Unfortunately, basic human fallibility means that perception and risk attitudes are “exposed to sources of explicit and implicit bias, since all elements of the risk management process are performed by individuals”. The three main categories of bias are referred to as conscious, subconscious and affective [9].
By recognising the widespread applicability of such factors as distraction or adverse time pressures, SPMM can then support the framework necessary to mitigate the same potential contributory factors in future, unrelated events [11].
The importance of SPMM means that “Company A” should continue to develop its safety database and recording categories, and so improve its collection of the high-frequency, low-consequence event data capable of providing large quantities of information devoid of the contextually limited conditions of an accident or incident. This information has the potential to provide “Company A” with the quantitative data necessary to reliably monitor and mitigate the effect of various risk attitude influences, whilst continuing to improve learning potential and manage operational risk.
“Company A” should attempt to increase the proportion of proactive and non-punitive hazard reporting, and reinforce its importance across the entire organisation. This should be supplemented by an anonymous reporting system, and a receptive safety attitude whereby feedback is provided to individuals who report their concerns, and material is safeguarded so that it used solely for the enhancement of system safety. Importantly, the success of any reporting culture can only be achieved alongside an appreciation of the essential foundations necessary to support a “just”, proactive and generative safety culture [11].
Further analysis of maintenance planning data could also be incorporated within future safety reports to incorporate factors including the distribution of aircraft across an annual maintenance period, the ratio of scheduled/unscheduled maintenance, aircraft age and familiarity, and the recording of any delays to the maintenance timetable. This information could be used to support additional quantitative conclusions, and additional personnel information could continue to monitor other human factors including staffing levels, personnel experience, and task allocation alongside other latent individual and group risk attitudes.
In addition, whilst “Company A” currently assesses risk against the potential impact on flight safety, this strategy is not without limitations. Risk is a complex entity, and it must be acknowledged that different events will carry inherently different levels of different risk types, including the risk to personnel safety, risk of aircraft damage and potential business/commercial risk. “Company A” should therefore consider the benefits of incorporating different risk categories in order to increase the value of its SPMM.
In summary, whilst the results of this study are summarised from a much larger project producing over 20 specific recommendations, the stratified sample has shown that it is not yet possible to numerically quantify the risk attitude and perception biases that are present within “Company A” operations because of the variable and subjective nature of the current SPMM process. This means that “Company A” must recognise that an explicit decision making process, optimised communications, and an increase in situational awareness are essential in reducing bias and uncertainty, because central to the achievement of any goal is a “clear understanding of the nature of the [risks involved] as well as the ability to determine the influence of risk attitude on overall decision making” [8].
6
CONCLUSION
The results of this study have demonstrated the significant relationship between risk perception, risk attitude, and the efficacy of the hazard identification process. A considerable number of conscious, subconscious and affective influences are known to affect the management of perceptions and risk attitude, and so the management of this subjectivity is essential if the appropriate balance between system compliance and flexibility is to be ascertained.
Situational awareness is key to reducing uncertainty and understanding “how people’s actions and assessments actually made sense at the time”. “Progress on safety comes from understanding and influencing these connections” and this can only be achieved through the continual monitoring of operational performance using human-centric reporting methods, safety surveys and internal safety investigations whilst continuing to create contexts and situations in which the correct perception and risk attitude are most likely to be adopted by both the system and an individual [2].
In order to enhance its latent system understanding and improve situational awareness, “Company A” should also acknowledge the potential benefits of risk attitude diagnosis and assessment. By helping to “diagnose the presence and strength of various drivers of risk culture”, such assessment would help to facilitate minor and routine adjustments to operations, and make the organisation “alert and responsive to both upside and downside uncertainty”. For this reason, “Company A” should consider the adoption of a strategic audit of risk attitudes as part of a strategy for both new and existing employees [9].
HAZARD IDENTIFICATION IN APPROVED MAINTENANCE ORGANISATIONS: THE MANAGEMENT OF RISK ATTITUDE
Importantly, it must be recognised that the greatest asset to any AMO is its constituent staff members. Responsible for both system design and operation, it is these individuals who make the “moment-to-moment adjustments” necessary to ensure that operation is successful in an environment vulnerable to “unidentified effects”. This means that a mindful organisation recognises that “there is variation in [routine activities], but there is stability in the cognitive processes that make sense of this activity”. The monitoring, management and understanding of these cognitive activities is therefore integral to the management of safety risk [16].
By providing “instruction[s] on error-provoking conditions”, it is possible for “Company A” to provide “frontline professionals [the] mental skills necessary [to make] rough and ready assessment of the error risk in any given situation”. This assessment can be compared against a scale devised by and appropriate for “Company A” operations, and so allow personnel to further their appreciation of their own perceptions and risk attitude. If utilised correctly, examples of error wisdom methodology have the potential to promote mitigating actions, and the avoidance of situations where a high error or risk potential is perceived [16].
In conclusion, this study has helped to demonstrate that risk attitude is an essential component in the hazard identification process, and for a human-centric system, the individual is not only capable of being a system’s single greatest weakness, but also its single greatest asset. Ultimately, this means that despite complex defence and mitigation strategies, safe and sustainable operation can only be achieved by having the right person, in the right place, with the right response, at the right time, and it is only through enhancement of its management and understanding of risk attitude that “Company A” can take one step further toward this illusive and virtuous goal.
7
ACKNOWLEDGEMENTS
The author would like to express their utmost, sincere thanks to Dr Ivan Sikora, City University London; Mr Cengiz Turkoglu, Cranfield University; the UK National Police Air Service; and everyone at “Company A”.
8
REFERENCES AND BIBLIOGRAPHY
[1] ARMS Working Group (ESSI). “The ARMS Methodology for Operational Risk Assessment in Aviation Organisations”. Published Electronically, March 2010. Available from: http://www.easa.europa.eu/essi/documents/Methodology.pdf (Accessed: 20/08/2014)
[2] Dekker, S. “Reconstructing human contributions to accidents: the new view on error and performance”. Journal of Safety Research, 33 (2002) 371– 385.
[3] Dekker, S. “The Field Guide to Understanding Human Error”. Ashgate Publishing, 2006 – 2nd edition.
[4] ECAST, European Strategic Safety Initiative. “Safety Management System and Safety Culture Working Group (SMS WG): Guidance on Hazard Identification”. Published Electronically, March 2009. Available from: http://easa.europa.eu/essi/ecast/wp-content/uploads/2011/08/ECASTSMSWG-GuidanceonHazardIdentification1.pdf (Accessed: 08/02/2011)
[5] Edwards, C. & City University, London. “Active Safety Management” Module Handbook, 23-25/05/2011.
[6] European Aviation Safety Agency, Rulemaking Directorate. Notice of Proposed Amendment 2013-19. “Embodiment of Safety Management System (SMS) requirements into Commission Regulation (EC) No 2042/2003” RMT.0251 (MDM.055). Available electronically: http://www.easa.europa.eu/rulemaking/docs/npa/2013/NPA%202013-19.pdf (Accessed 12/11/2013)
[7] European Organisation for the Safety of Air Navigation, Eurocontrol. “Guidelines for the identification of hazards: How to make unimaginable hazards imaginable?”. Published 22/03/2004 – NLR-CR-2004-094. Available electronically from: http://www.nlr-atsi.nl/downloads/guidelines-for-the-identification-of-hazards.pdf (Accessed: 11/01/2014).
[8] Hillson, D. & Murray-Webster, R. “Managing Group Risk Attitude”. Gower Publishing, 2008.
[9] Hillson, D. and Murray-Webster, R. “Understanding and Managing Risk Attitude”. Gower Publishing, 2007 – 2nd edition.
[10]Hobbs, A. “Human Factors in Airline Maintenance: A Study of Incident Reports”. Canberra, ACT, 1997.
[11]International Civil Aviation Organisation (ICAO). “Safety Management Manual (SMM)”. DOC 9859 AN/474. ICAO, 2009 – 2nd edition.
[12]International Civil Aviation Organisation (ICAO). “Safety Management Manual (SMM)”. DOC 9859 AN/474. ICAO, 2013 – 3rd edition.
[13]Plous, S. “The Psychology of Judgment and Decision Making.” McGraw-Hill, 1993.
[14]Reason, J. “Human Error”. Cambridge University Press, 1990.
[15]Reason, J. “Managing the Risks of Organisational Accidents.” Ashgate, 1997.
[16]Reason, J. “The Human Contribution: Unsafe Acts, Accidents & Heroic Recoveries”. Ashgate Publishing, 2008.
[17]Rogan, E. & City University, London. “Safety Management Tools and Methods” Module Handbook.
[18]Safety Management International Collaboration Group. “Risk Based Decision Making Principles”. Published 30/01/2013. Available electronically from: http://www.skybrary.aero/bookshelf/books/2077.pdf (Accessed: 11/01/2014).
[19]Teledyne Controls. “Aviation Quality Database (AQD)”. Computerised software, n.d.
[20]Turkoglu, C. & City University, London. “Airworthiness & Maintenance” Module Handbook, 05-07/03/2012.
[21]Tversky, A. & Kahneman, D. "The Framing of decisions and the psychology of choice". 1998. Science 211 (4481): Page 453–458
[22]UK Civil Aviation Authority (CAA). “CAP 716: Aviation Maintenance Human Factors (EASA/JAR 145 Approved Organisations” Published 18/12/2003. Available from: http://www.caa.co.uk/docs/33/CAP716.PDF (Accessed: 06/12/2010)