Frequency dependence of microflows upon acoustic interactions with fluids
Benjamin Tiller, Julien Reboud, Manlio Tassieri, Rab Wilson, and Jonathan M. Cooper
Citation: Physics of Fluids 29, 122008 (2017);
View online: https://doi.org/10.1063/1.4999308
View Table of Contents: http://aip.scitation.org/toc/phf/29/12
Published by the American Institute of Physics
Articles you may be interested in
Particle separation by phase modulated surface acoustic waves
Biomicrofluidics 11, 054115 (2017); 10.1063/1.5001998
Confinement of surface waves at the air-water interface to control aerosol size and dispersity
Physics of Fluids 29, 112105 (2017); 10.1063/1.4993793
A planar surface acoustic wave micropump for closed-loop microfluidics
Applied Physics Letters 111, 234102 (2017); 10.1063/1.5007701
Development of vortex structures in the wake of a sharp-edged bluff body
Physics of Fluids 29, 125103 (2017); 10.1063/1.5003114
In-droplet microparticle separation using travelling surface acoustic wave
Biomicrofluidics 11, 064112 (2017); 10.1063/1.5010219
i-Rheo: Measuring the materials' linear viscoelastic properties “in a step”!
Frequency dependence of microflows upon acoustic interactions
with fluids
Benjamin Tiller,a)Julien Reboud, Manlio Tassieri, Rab Wilson, and Jonathan M. Cooper Division of Biomedical Engineering, School of Engineering, University of Glasgow, Rankine Building, Oakfield Avenue, G12 8LT Glasgow, United Kingdom
(Received 7 August 2017; accepted 2 December 2017; published online 26 December 2017)
Rayleigh surface acoustic waves (SAWs), generated on piezoelectric substrates, can interact with liquids to generate fast streaming flows. Although studied extensively, mainly phenomenologically, the effect of the SAW frequency on streaming in fluids in constrained volumes is not fully understood, resulting in sub-optimal correlations between models and experimental observations. Using microflu-idic structures to reproducibly define the fluid volume, we use recent advances modeling the body force generated by SAWs to develop a deeper understanding of the effect of acoustic frequency on the magnitude of streaming flows. We implement this as a new predictive tool using a finite element model of fluid motion to establish optimized conditions for streaming. The model is corroborated experimentally over a range of different acoustic excitation frequencies enabling us to validate a design tool, linking microfluidic channel dimensions with frequencies and streaming efficiencies. We show that in typical microfluidic chambers, the length and height of the chamber are critical in determining the optimum frequency, with smaller geometries requiring higher frequencies.Published by AIP Publishing.https://doi.org/10.1063/1.4999308
I. INTRODUCTION
Surface acoustic waves (SAWs) can be used to actuate liquids and produce ultrasonic radiation forces, so enabling a wide variety of phenomena, including the sorting of particles or cells based upon their physical properties,1 the nebulisa-tion of droplets as a potential drug delivery platform,2 the use of acoustic streaming to drive efficient fluid mixing in droplets,3and the actuation of fluid flows through microfluidic networks as an efficient alternative to “bulky” hydrodynamic pumps.4,5 However, despite the large number of such stud-ies of SAWs within microfluidic devices, the dependency of the induced fluid streaming on the applied acoustic frequency and the geometry of the microsystems used is still not fully understood.
In many areas of application,1–5 there is a requirement to create strong streaming with high flow velocities which in itself can lead to practical limitations in both maintaining the integrity of devices6and in the amount of power required to drive the acoustic transducers (before undesired local heat-ing effects appear). One motivation therefore for optimisheat-ing streaming is to generate higher velocity flows for a given power,7–10by quantitatively exploring the dependence of fluid flow on SAW frequency.
The concept of optimising the steady fluid velocity cre-ated from oscillating acoustic waves through acoustic stream-ing was first shown in a theoretical scalstream-ing analysis11 while studying the propagation of a plane longitudinal wave through a cylindrical pipe. The authors demonstrated that the average
a)Present address: Department of Electronic and Electrical Engineering,
University of Strathclyde, Royal College Building, 204 George St., Glasgow G1 1XW, United Kingdom.
bulk streaming velocity scales exponentially with the fre-quency when the radius of the pipe was smaller than the acous-tic wavelength. Although similar scaling arguments should exist for streaming generated by SAWs, the translation of this analysis into practical applications has been limited. Specif-ically, when a SAW refracts into a fluid, the acoustic field generated is asymmetric, which introduces more complexity than when the field is generated by a plane bulk acoustic wave, rendering accurate predictions more difficult.
Studies on SAW-induced streaming in sessile droplets have provided methods for modelling the distribution of the acoustic field within the fluid, by considering the attenuation length of the SAW beam as a scaling parameter.12,13 This approach however ignores the effect of the viscous attenuation due to the fluid, preventing close agreement with the experi-mental evidence. A more accurate description of the scaling laws governing the SAW-induced streaming in microfluidic channels10,14gives an expression for the acoustic pressure field based on both the viscous damping of the fluid itself and the damping of the SAW by the fluid.
In the context of typical microfluidic structures, these expressions translate to the physical constraints of the geome-try on the body of the liquid, such as the height of microchan-nels. When a channel is smaller than the attenuation length of the SAW, the magnitude of streaming flows is significantly decreased. Recent advances have taken the so-called “anechoic corner” into account and shown good agreement between sim-ulation and experiment,15,16but only over a limited range of frequencies, preventing the generation of significant insight into the interplay between acoustic frequency and streaming efficiency.
The effect of frequency on SAW streaming in fluids has also been investigated without explicit derivation of the
122008-2 Tilleret al. Phys. Fluids29, 122008 (2017)
acoustic field and showed good agreement with a streaming model within large volumes.17 However, the conclusions do not extend to microfluidic systems, where the length scales are often many times smaller than the attenuation length of the acoustic beam. Moreover, the effect of frequency on SAW-induced flows used for mixing different fluids in droplets has led to the scaling argument that higher frequencies are able to drive faster mixing in small droplets.18
In this work, we expand upon the approaches for mod-elling the acoustic field in microfluidics channels10,14,15 and build a simple expression of the body force, taking into account the anechoic corner as well as the damping coefficients of both the SAW and the viscous damping of the fluid. We demon-strate, for the first time, how these expressions can be used to fully analyse the scaling of SAW-induced acoustic streaming with the acoustic frequency.
We adopt this expression to predict SAW streaming in a fluid using a finite element model and we quantitatively validate it by comparing the simulation results with micro-particle imaging velocimetry (µPIV) measurements of stream-ing in a chamber across a range of frequencies. This allows us to provide a predictive tool by which to design acousto-fluidic devices, by determining the optimum frequency for driving streaming in different microfluidic volumes. Contrary to the iterative approaches currently used during the design of many SAW-based microfluidic devices, we demonstrate that the frequency should be tailored to the length scale of the microfluidic device and that frequencies>500 MHz, i.e., out-side of the usual used range (1-10 MHz), will drive the fastest streaming for microfluidic length scales ranging from 10 to 100µm.
II. THEORY
Full numerical simulations to model acoustic fields in both the fluid and solid domains together with the resulting acoustic streaming have previously been reported.18,19These provide physically accurate models, but at the expense of high complexity and high computational demands, prevent-ing more useful parametric studies to explore this design space. Consequently, partial methods have been developed, where an analytical approximation for the acoustic field in the fluid due to the SAW can be derived to calculate the body force using Nyborg’s streaming equations. In a further iter-ation, the body force has been used to calculate streaming numerically.13,14
We now provide a new explicit expression of the body force generated by the SAW-induced acoustic field, enabling a generic predictive framework to optimise the frequency depen-dent magnitude of streaming flows. We derive an expression for this body force,Fb, using a method of successive approxi-mations to solve the Navier Stokes equation,20which we sub-sequently use to calculate the resulting steady state streaming in a fluid,
Fb=ρfhu· ∇u+u∇ ·ui, (1)
whereuis the velocity field in the fluid due to the acoustic oscillatory motion andρf is the fluid density. It is worth noting that this theoretical framework makes assumptions that limit its
application to slow fluid streaming, i.e.,Re<1 and |u|> ξ
,
where the Reynolds number is defined asRe= ρ ξ
l/µ, with
ξas the static streaming velocity andl as the microfluidics’ characteristic length scale.21
III. ACOUSTIC FIELDS IN FLUIDS DUE TO RAYLEIGH ACOUSTIC WAVES
When a SAW such as a Rayleigh wave is generated on a solid substrate, it propagates along the surface as an elliptically polarized wave, with the displacement amplitude decaying into the substrate. Upon reaching a fluid such as a droplet or a fluidic stream placed on its path, the SAW amplitude is expo-nentially damped, propagating as a “leaky surface wave” at the fluid/substrate interface due to the generation of a compression wave in the fluid. This compression wave itself propagates at the Rayleigh angle,22θR= sin1(vf/vSAW), wherevf is the propagation velocity of the compression wave in the fluid and
vSAW is the propagation velocity of the Rayleigh wave on the substrate.
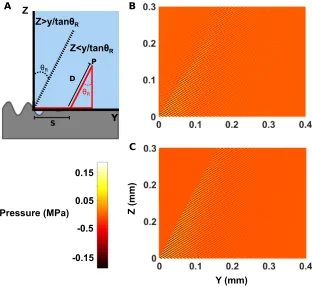
In order to derive an expression of the SAW-induced body force within the fluid, we consider the acoustic energy loss along a specific two-dimensional path to reach a point P in the fluid (as a cross section of the volume). The path is drawn as a sum of a distance S in the direction of SAW propagation at the solid/liquid interface and a distance D lon-gitudinal to the wave propagation at the Rayleigh angle,10 as shown schematically in Fig. 1(a). The total attenuation through that path ise−Dαfe−sαSAW, whereα
f = (bω2)/(2ρfv3f) is the attenuation of a plane wave in a viscous fluid, αSAW=ρfvf/(ρsvSAWλSAW) is the attenuation of a fluid-damped Rayleigh SAW,17ρ
fandρsare the fluid and substrate densities, respectively, λSAW is the SAW wavelength,ωis the angular frequency, andb = 43µ+µ0, where µ0is the bulk viscos-ity. Accordingly, the velocity field in 2 dimensions is written as
uy=ωAtan(θR)ei(ωt−kyy−kzz)e(− |y−ztan(θR)|αSAW)−zcos −1(θ
R)αf,
uz=ωAei(ωt−kyy−kzz)e(− |y−ztan(θR)|αSAW)−zcos −1
(θR)αf, (2)
whereky=ksin(θR) andkz=kcos(θR) are wavenumbers in y and z withk= (2πf)/vf.
Here we take into consideration the whole volume of the fluid, including microstructures [such as an anechoic corner, shown in Fig.1(a)], enabling us to build an accurate descrip-tion of an acoustically pumped microfluidic system.15We do not consider the reflections off the walls of the microchannels (which are most often made of elastomeric materials with a low acoustic impedance, and which do not generate significant reflections). It is important to note that, where other materi-als are used in the construction of the microfluidic network (such as glass or silicon, for example), the contribution of such reflections will be significant and will need to be considered systematically.
The anechoic corner produced by the angled path of the sound beam can be further defined by specifying thatuyand
FIG. 1. (a) Schematic representation of a chosen path taken by the acoustic wave for derivation of the body force. A Rayleigh SAW travels along the sur-face of a substrate (from the left to right) until it reaches a fluid volume (blue shaded area). The SAW then prop-agates along the fluid-substrate interface and radiates part of its energy into the fluid. This energy propagates through the fluid as a longitudinal compression wave, at a specific Rayleigh angle to the SAW direction. (b) Finite element sim-ulation of the pressure field in the fluid due to a 342 MHz SAW. (c) shows the pressure field predicted by the analyti-cal expression for the velocity field in Eq.(2).
expressions ofuyanduzinto the body force equation
Fy=ρf
tan(θR)kyi+kzi
A2ω2tan(θR)e2(kyi+kzi),
Fz=ρf
tan(θR)kyi+kzi
A2ω2e2(kyi+kzi), (3)
wherekyi=αSAW andkzi=cos1(θR)αf + tan(θR)αSAW. This analytical expression for the acoustic field was explored using a COMSOL simulation of the pressure field in a 2D rectangular fluid domain due a leaky SAW propagating vibrations along the bottom boundary. A comparison between the finite element simulation and the analytical expression for a 342 MHz SAW vibration is shown in Figs. 1(b)and1(c) (results for 43 MHz and 87 MHz are also shown in Fig. S2 of thesupplementary material).
IV. EXPERIMENTAL SECTION
Simulations in Comsol Multiphysics 3.5a (acoustic module) were compared with experimental measure-ments of SAW streaming in microfluidic chambers, mea-sured with µPIV. The microchamber [Fig. S1(a) of the supplementary material] was made using the elastomeric poly-mer poly(dimethyl)siloxane (PDMS), fabricated using stan-dard soft lithographic methods with dimensions 0.4 × 0.4 ×0.15 mm (XYZ). An associated microfluidic channel net-work was moulded on the surface of the substrate in the path of the SAW. The SAW was generated on a piezoelectric Y-cut lithium niobate substrate by applying an alternating electric field to an inter-digitated transducer (IDT). The width of each finger of the IDTs and the distance between each finger were equal. Each IDT consisted of 40 pairs of fingers, and aper-ture and finger widths were, respectively, 2 mm and 2.5 µm for 342 MHz, 6 mm and 10 µm for 87 MHz, and 6 mm
and 20 µm for 43 MHz, respectively. A quarter wavelength reflector was also included behind the IDTs to partially reflect back some of the lost wave energy.23 The IDTs were fab-ricated using standard photolithography, metal evaporation, and lift-off to produce microelectrodes with 10 nm of Ti (as an adhesion layer) capped with 100 nm of Au, as previously described.24
To minimize the damping from the elastomeric poly-mer and also to control the position of the SAW beam in the chamber, a further “beam tunnel” was included into the channel network design [see Figs. S1(a) and S1(b) of the supplementary material] with a thin (100 µm) PDMS wall, minimizing the energy losses. By designing the width and posi-tion of the tunnel relative to the fluid filled channels, the SAW beam could be spatially positioned within the chamber, allow-ing the control of the direction and shape of the induced fluid streaming. This was used to create a stable anticlockwise vor-tex in the chamber, measured withµPIV, using 1µm diameter fluorescent polystyrene beads as tracers within the fluid flow (in this case, water). A 10×objective lens focused a laser pulse onto a plane perpendicular to the z direction in the chamber (see thesupplementary materialfor details).
[image:4.594.44.356.47.334.2]122008-4 Tilleret al. Phys. Fluids29, 122008 (2017)
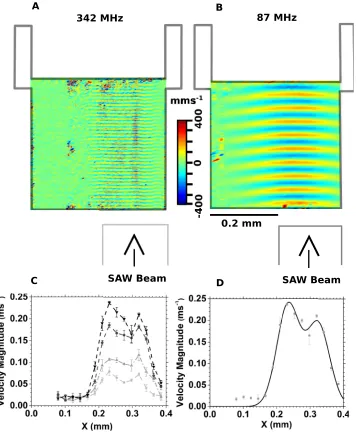
FIG. 2. Vibrometer scans of the surface waves in the square micro-chamber for 342 MHz (a) and 87 MHz (b). Most of the SAW energy is confined to half of the chamber (along the x-axis) due to the guiding effect of the beam tunnel. This can also be seen to act like a diffrac-tion slit for the lower frequency 87 MHz SAW, exhibiting some wave spreading, which was not seen at 342 MHz. The colour scale shows the velocity ampli-tude of the SAW beam. (c) shows a cross section of a 342 MHz SAW beam along the x axis after the SAW has entered the chamber for different electrical input powers (from light to dark, 0.03, 0.10, 0.32, 1.00 W). (d) A double Gaussian peak fit for the cross section at 1 W (R2 = 0.978). This fit was used to describe the amplitude profile of the SAW beam in the simulation.
V. RESULTS AND DISCUSSION
We validated the accuracy of the new model by compar-ing simulations withµPIV measurements at different heights in the microchannel. At h = 25 µm (Fig.3), the body force due to the SAW pushes the fluid up through the chamber. At h = 50µm and h = 75µm, there is an anti-clockwise flow in the chamber due to the unbalanced body force, which only exists in the right-hand side of the chamber (see Figs. S4 and S5 of thesupplementary material).
Higher frequency SAW beams generated faster streaming, with the average streaming magnitude over the whole chamber for the 342 MHz beam being more than an order of magnitude greater than for 43 MHz. The experimental measurements are in close quantitative agreement with the simulation results, as shown in Fig.4.
The good agreement with experimental data allowed us to explore the model as a design tool, linking microfluidic channel dimensions with frequencies and streaming efficien-cies. Simulations (Fig.5) were used to explore the geometrical
parameter space and allowed us to choose the most suit-able conditions for a specific application, depending on SAW streaming. Results show a strong dependency of the stream-ing magnitude as a function of the SAW frequency; with frequencies between 270 and 374 MHz driving the fastest streaming in the case of a microchannel having dimensions of 0.4 ×0.3×0.3 mm (XYZ). Hence, this new implemen-tation provides the opportunity of predicting an “optimum” frequency to drive SAW streaming in a given microfluidic chamber.
FIG. 3. Quiver plots of the in-plane fluid velocity at different frequencies for a cross-sectional height, h, of 25µm. (a) Schematic representation to aid visual-isation. The quiver plots are organized in pairs, comparing simulated (left) and measured (right) results for 43, 87, and 342 MHz [(b)–(d), respectively] with the colour scales used to make easy visual comparison. Figures S3-S5 of thesupplementary material further show comparisons between the simula-tion and measurement over a range of different chamber heights (50, 75, and 100µm).
FIG. 4. (a) Simulation results of streaming velocities as a function of the magnitude of SAW velocity at a chamber height of 75µm (averaged over the whole chamber, with the standard deviation shown as an error bar). For equal amplitude particle velocities, the higher frequency SAW beams generated the fastest average streaming (dark to light: 342, 87, and 43 MHz). (b) Average measured streaming velocity for all chamber heights and frequencies studied, normalised to SAW amplitude velocity,u2
z(z=0,x=0). Each experimental data set was divided by a factor C(h, f) determined by fitting each simulation curve toV(h,f) = C(h,f)u2z(z=0,x=0). This allows an immediate comparison of the agreement of all the measurements with the theoretical prediction. The colour scale is the same as in (a).
On the other hand, the power radiated by the SAW into the fluid compressional wave is inversely proportional to frequency:17
P= l
0
ρwvfη02e−2αsawYdY (4)
Wherel is the length of the chamber,wis the width of the SAW beam and η0 is the initial velocity amplitude of the
SAW. The viscous and inertial effects also depend on fre-quency: at lower frequencies inertia is negligible and the fluid velocity scales with f2, as described in the classical
equations first derived by Nyborg;20 whereas, at higher fre-quencies the streaming flows are better described as a Stuart-Lighthill type streaming jet.25In this regime, the fluid inertia becomes significant and the fluid velocity no longer scales withf2.
These factors enable an interpretation of the behaviour observed in Fig. 5, where, at low frequencies, the acous-tic beam is longer than the path to the chamber roof (h < α−f1cos (θR)) and the process is governed by the height of the chamber. As frequency increases, the length of the beam decreases, providing more energy into the fluid to drive stream-ing. When the acoustic beam becomes much shorter than the height of the chamber, the streaming velocity decreases due to the onset of streaming jet-like behaviour.
[image:6.594.49.286.377.640.2]122008-6 Tilleret al. Phys. Fluids29, 122008 (2017)
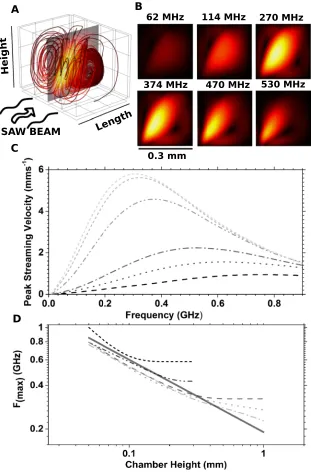
FIG. 5. (a) Streamline plot of the fluid flow in a chamber with dimensions 0.4×0.3×0.3 mm (XYZ), where the width of the SAW beam is incident over 0.1<x<0.3 mm. (b) Cross sections of the fluid flow for a number of differ-ent frequencies keeping the initial SAW velocity amplitude constant at 1 ms1; the colour scale is the same for each cross section. The spatial position of the cross section in the chamber is shown in (a). (c) Peak streaming velocity against frequency for chamber volumes with dimensions 0.3×0.3×h mm (XYZ) (from light to dark,h= 0.400, 0.300, 0.200, 0.100, 0.075, 0.050 mm). (d) The optimum frequencies are related to the chamber height and length. When the length of the chamber is much larger than 1/αSAW; it is the height of the
cham-ber that determines the optimum fre-quency (from dark to lightl= 0.05, 0.10, 0.20, 0.40, 1.50 mm). The solid line is added as a visual guide for this scaling relationship (h=α−1
f cos (θR)). As the
ratio of the chamber’s length to height increases, the optimum frequencies col-lapse on this relationship.
higher values, while keeping all other parameters constant [Fig.5(d)].
It is useful to note also that, at low frequencies, our results are in agreement with those reported in the literature,9,17but differ at high frequencies because of differences in normal-isation methods9 and modelling approaches.17 In particular, in an unbounded regime, Dentryet al.17predicted a constant relationship between frequency and peak streaming velocity for frequencies up to 1 GHz, which is in contrast with our sim-ulation results that show a decrease in peak streaming velocity (Fig.5, confirmed also for unbounded cases in Fig. S6 of the supplementary material). We attribute these differences to the onset of inertial losses in the fluid at high frequencies, which are not taken into account by Dentryet al.when using the lam-inar jet model. Our understanding is supported by the work of Eisener et al.,25 in which they observed that by using a “piston-type” acoustic transducer, the peak streaming velocity
shows a decreasing trend at frequencies higher than 600 MHz. Moreover, in the case of SAW streaming, an additionalf1
scaling of the power radiated in the fluid [Eq.(4)] imposes a sharper decrease of the peak streaming velocity with increasing frequency.
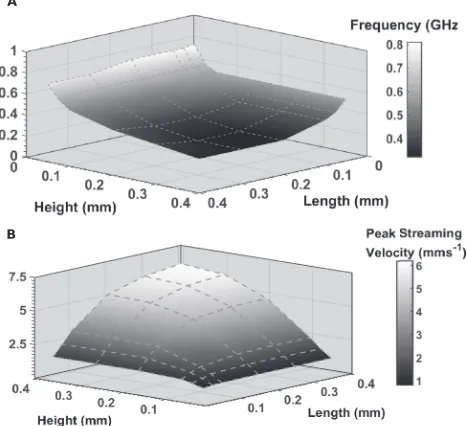
[image:7.594.45.356.47.520.2]FIG. 6. (a) Optimum frequency for driving the fastest streaming as a function of the length and height of the microfluidic chamber within the range 0.05– 0.4 mm. (b) Peak streaming velocity for the optimum frequency as a function of length and height. These plots are a linear interpolation of the optimum frequency from 36 simulations. A 2D visualisation is available in Fig. S7 of thesupplementary material.
by the optimum frequency for different chamber dimen-sions, where smaller chamber dimensions limit the maximum streaming velocity that is achievable.
VI. CONCLUSIONS
We present an expression of the body force exerted on a fluid through its mechanical interaction with a surface acous-tic wave. A simulation for the resulting acousacous-tic streaming was constructed by considering the compression wave radi-ated into the fluid by the SAW and relating this to the clas-sic streaming equations popularised by Nyborg. This was tested experimentally and used to provide a predictive frame-work for optimising the magnitude of frequency dependent microflows generated by acoustic streaming. We demonstrate the utility of this approach by simulating flows in different microfluidic structures to optimise the acoustic frequency for generating maximum flow rates. We further show a good quantitative agreement with experimental data, allowing us to explore the model’s use as a design tool, linking microflu-idic channel dimensions with frequencies and streaming efficiencies.
SUPPLEMENTARY MATERIAL
See supplementary material for Figs. S1–S7 and more details on PIV measurement and COMSOL simulations. All data associated with this manuscript is available open access athttps://doi.org/10.5525/gla.researchdata.560.
ACKNOWLEDGMENTS
The authors are grateful for EPSRC support (No. EP/I017887/1—Proxomics) and to Martin Hyde and the
EPSRC equipment loan pool for the µPIV system. J.M.C. acknowledges EPSRC Fellowship (No. EP/K027611/1) and the ERC Advanced Investigator Award (No. 340117— Biophononics). J.R. acknowledges a Lord Kelvin and Adam Smith research fellowship (University of Glasgow). M.T. acknowledges support from the Royal Academy of Engineer-ing/EPSRC Fellowship (No. 10216/101).
1J. Shi, D. Ahmed, X. Mao, S.-C. S. Lin, A. Lawit, and T. J. Huang, “Acoustic
tweezers: Patterning cells and microparticles using standing surface acoustic waves (SSAW),”Lab Chip9, 2890 (2009).
2A. Qi, J. R. Friend, L. Y. Yeo, D. A. V. Morton, M. P. McIntosh, and
L. Spiccia, “Miniature inhalation therapy platform using surface acoustic wave microfluidic atomization,”Lab Chip9, 2184 (2009).
3A. Wixforth, C. Strobl, C. Gauer, A. Toegl, J. Scriba, and Z. Guttenberg,
“Acoustic manipulation of small droplets,”Anal. Bioanal. Chem.379, 982 (2004).
4L. Schmid, A. Wixforth, D. A. Weitz, and T. Franke, “Novel surface acoustic
wave (SAW)-driven closed PDMS flow chamber,”Microfluid. Nanofluid.
12, 229 (2012).
5M. B. Dentry, J. R. Friend, and L. Y. Yeo, “Continuous flow actuation
between external reservoirs in small-scale devices driven by surface acoustic waves,”Lab Chip14, 750 (2014).
6H.-F. Pang, Y. Q. Fu, L. Garcia-Gancedo, S. Porro, J. K. Luo, F. Placido,
J. I. B. Wilson, A. J. Flewitt, W. I. Milne, and X. T. Zu, “Enhancement of microfluidic efficiency with nanocrystalline diamond interlayer in the ZnO-based surface acoustic wave device,”Microfluid. Nanofluid.15, 377 (2013).
7L. Schmid, D. A. Weitz, and T. Franke, “Sorting drops and cells with
acous-tics: Acoustic microfluidic fluorescence-activated cell sorter,”Lab Chip14, 3710 (2014).
8G. Destgeer, B. H. Ha, J. Park, J. H. Jung, A. Alazzam, and H. J. Sung,
“Microchannel anechoic corner for size-selective separation and medium exchange via traveling surface acoustic waves,”Anal. Chem.87, 4627 (2015).
9R. J. Shilton, M. Travagliati, F. Beltram, and M. Cecchini, “Nanoliter-droplet
acoustic streaming via ultra high frequency surface acoustic waves,”Adv. Mater.26, 4941 (2014).
10D. J. Collins, Z. Ma, and Y. Ai, “Highly localized acoustic streaming and
size-selective submicrometer particle concentration using high frequency microscale focused acoustic fields,”Anal. Chem.88, 5513 (2016). 11K. D. Frampton, S. E. Martin, and K. Minor, “The scaling of acoustic
streaming for application in micro-fluidic devices,”Appl. Acoust.64, 681 (2003).
12M. Alghane, Y. Q. Fu, B. X. Chen, Y. Li, M. P. Y. Desmulliez, and A. J.
Walton, “Frequency effect on streaming phenomenon induced by Rayleigh surface acoustic wave in microdroplets,” J. Appl. Phys. 112, 084902 (2012).
13M. Alghane, Y. Q. Fu, B. X. Chen, Y. Li, M. P. Y. Desmulliez, and A. J.
Walton, “Scaling effects on flow hydrodynamics of confined microdroplets induced by Rayleigh surface acoustic wave,”Microfluid. Nanofluid.13, 919 (2012).
14T. Frommelt, D. Gogel, M. Kostur, P. Talkner, P. Hanggi, and A. Wixforth,
“Flow patterns and transport in Rayleigh surface acoustic wave stream-ing: Combined finite element method and raytracing numerics versus experiments,”IEEE Trans. Ultrason. Ferroelectrics Freq. Control55, 2298 (2008).
15F. Kiebert, S. Wege, J. Massing, J. K¨onig, C. Cierpka, R. Weser, and
H. Schmidt, “3D measurement and simulation of surface acoustic wave driven fluid motion: A comparison,”Lab Chip17, 2104 (2017).
16C. Devendran, T. Albrecht, J. Brenker, T. Alan, and A. Neild, “The
impor-tance of travelling wave components in standing surface acoustic wave (SSAW) systems,”Lab Chip16, 3756 (2016).
17M. B. Dentry, L. Y. Yeo, and J. R. Friend, “Frequency effects on the scale
and behavior of acoustic streaming,”Phys. Rev. E89, 013203 (2014). 18J. Vanneste and O. B¨uhler, “Streaming by leaky surface acoustic waves,”
Proc. R. Soc. A467, 1779 (2011).
19H. Antil, A. Gantner, R. H. W. Hoppe, D. K¨oster, K. Siebert, and A. Wixforth,
Domain Decomposition Methods in Science and Engineering XVII
(Springer, Berlin, Heidelberg, 2008), pp. 305–312.
20W. L. M. Nyborg, inPhysical Acoustics, edited by W. P. Mason (Academic
[image:8.594.50.284.51.264.2]122008-8 Tilleret al. Phys. Fluids29, 122008 (2017)
21S. J. Lighthill, “Acoustic streaming,”J. Sound Vib.61, 391 (1978). 22J. Friend and L. Y. Yeo, “Microscale acoustofluidics: Microfluidics driven
via acoustics and ultrasonics,”Rev. Mod. Phys.83, 647 (2011).
23Y. Q. Fu, J. K. Luo, X. Y. Du, A. J. Flewitt, Y. Li, G. H. Markx, A. J.
Walton, and W. I. Milne, “Recent developments on ZnO films for acoustic wave based bio-sensing and microfluidic applications: A review,”Sens. Actuators, B143, 606 (2010).
24J. Reboud, Y. Bourquin, R. Wilson, G. S. Pall, M. Jiwaji, A. R. Pitt,
A. Graham, A. P. Waters, and J. M. Cooper, “Shaping acoustic fields as a toolset for microfluidic manipulations in diagnostic technologies,”Proc. Natl. Acad. Sci. U. S. A.109, 15162 (2012).
25J. Eisener, A. Lippert, T. Nowak, C. Cair´os, F. Reuter, and R. Mettin,