City, University of London Institutional Repository
Citation
:
Pratt, A.C., Nathan, M. and Rincon-Aznar, A. (2015). Creative economy employment in the EU and the UK: a comparative analysis. London, UK: NESTA.This is the published version of the paper.
This version of the publication may differ from the final published
version.
Permanent repository link:
http://openaccess.city.ac.uk/13078/Link to published version
:
Copyright and reuse:
City Research Online aims to make research
outputs of City, University of London available to a wider audience.
Copyright and Moral Rights remain with the author(s) and/or copyright
holders. URLs from City Research Online may be freely distributed and
linked to.
City Research Online: http://openaccess.city.ac.uk/ publications@city.ac.uk
CREATIVE
ECONOMY
EMPLOYMENT
IN THE EU
AND THE UK
A COMPARATIVE
ANALYSIS
Max Nathan
,
Andy Pratt
and
Ana Rincon–Aznar
Nesta is an innovation charity with a mission to help people and
organisations bring great ideas to life.
We are dedicated to supporting ideas that can help improve all our lives,
with activities ranging from early–stage investment to in–depth research
and practical programmes.
Nesta is a registered charity in England and Wales with company number 7706036 and charity number 1144091. Registered as a charity in Scotland number SCO42833. Registered office: 1 Plough Place, London, EC4A 1DE.
www.nesta.org.uk
©Nesta 2015
This research was commissioned by Nesta, and is part of an ongoing project to create
internationally comparable statistics on the size, growth and geography of the creative economy. Thanks to Hasan Bakhshi and John Davies at Nesta for feedback, to Douglas Cameron, formerly at DCMS and Sean Milburn at ONS for assistance on Annual Population Survey and EU Labour Force Survey queries. Thanks also to Havard Lien, Fabienne Montaigne, Livio Dellabate, David Steffes and Tereza Wennerholm of Eurostat for their help with the EU data, and to Enrico Giovannini for his help and comments. This work includes analysis based on data from the Annual Population Survey, produced by the Office for National Statistics (ONS) and supplied by the UK Data Service. The data is Crown copyright and reproduced with the permission of the controller of HMSO and Queen’s Printer for Scotland. The use of the ONS statistical data in this work does not imply the endorsement of the ONS in relation to the interpretation or analysis of the data. This work uses research datasets that may not exactly reproduce National Statistics aggregates. The report gives the views of the authors, not the funders or the data providers. Any errors and omissions are our own.
CONTENTS
SUMMARY 4
1 INTRODUCTION 8
2 EXTENDING THE DYNAMIC MAPPING APPROACH 10
3 CROSSWALKING AND PARSING OCCUPATIONS AND INDUSTRIES 13
4 THE CREATIVE INDUSTRIES IN THE EU AND THE UK 15
5 ROBUSTNESS CHECKS 19
6 COUNTRY COMPARISONS: THE UK, FRANCE, GERMANY, 22
THE NETHERLANDS, POLAND AND SWEDEN
7 DISCUSSION 31
REFERENCES 33
APPENDICES 34
ENDNOTES 43
CREATIVE
ECONOMY
EMPLOYMENT
IN THE EU
AND THE UK
A COMPARATIVE
SUMMARY
A
nalysts and policymakers have long complained of the dearth of internationally comparable statistics on the creative industries because it has made itimpossible to benchmark the performance of different countries. In January 2014, the Department for Culture, Media and Sport (DCMS) adopted the Dynamic Mapping methodology for classifying some industries as ‘creative’ and others not, for the purposes of producing the UK’s Creative Industries Economic Estimates (DCMS, 2014). This methodology is based on the theoretical and empirical argument that the creative industries are “those industries that specialise in the employment of creative talent for commercial purposes” (Bakhshi, Hargreaves and Mateos–Garcia, 2013) – that is, have unusually high proportions of their workforce employed in creative occupations (‘creative intensity’). Through its use of Standard Industrial Classification (SIC) codes and labour force survey data, the Dynamic Mapping methodology was designed to enable the production of internationally comparable statistics (Bakhshi, Freeman and Higgs 2013).
This report is part of a larger Nesta project to compare the size, growth, and industrial and occupational structure of the UK’s creative economy with other countries. The creative economy is defined as employment in the creative industries, plus creative jobs that are embedded outside the creative industries in the wider economy.
The report makes two contributions. First, we compare the size and growth of the creative industries between 2011 and 2013 in the UK and in the European Union (EU) on a consistent basis. Second, we explore the structure of the creative economy across six large European economies (France, Germany, the Netherlands, Poland, Sweden and the UK) where the
occupational data are sufficiently rich, by comparing the distributions of creative intensity across industries.
Our approach is as follows. We crosswalk UK creative occupation codes identified by DCMS to their International Standard Classification of Occupations (ISCO) equivalents. Although UK and EU industry codes are identical to the 4–digit level, 4–digit typologies are not available from Eurostat in the pan–EU Labour Force Survey data (henceforth EU LFS) used in this study. A crude shift from 4–digit to larger 3–digit industry codes may include sectors with low creative intensities, leading to inflated estimates of jobs in the creative industries. We therefore ‘parse’ the UK creative industry 4–digit Standard Industrial Classification (SIC) codes identified by DCMS, to produce a smaller number of best–fit 3–digit codes that can be used across EU countries. We then assemble estimates of national employment in the creative economy and creative industries, separating out creative jobs and non–creative jobs (Higgs, Cunningham and Bakhshi (2008) call this the ‘Creative Trident’). We use employment microdata from workforce surveys (the EU Labour Force Survey (EU LFS) and the UK Annual Population Survey (APS)) to produce our estimates.3 We then analyse creative intensities of different industries, and a series of
sensitivity checks, to explore the differences between countries.
It is important to be clear about what the parsing process does and its implications for the analysis. Specifically, we identify and remove from the analysis those SIC3 codes (3–digit SIC codes) with the least overlap with the 4-digit SIC4 codes that make up the DCMS classification. Creative occupations’ employment estimates are, of course, unaffected by these steps,
We use APS data (minus second jobs) and the 4–digit SICs in the DCMS classification to assess the effect of the change of moving to 3–digit SICs. The overall effect of the parsing process in the UK is large: the estimated share of creative economy employment in the whole workforce is 2.3 percentage points higher than when using the 4–digit APS data.4 This means that while we
try our best through our parsing procedure to minimise the magnitude of false positive creative industry employment arising from the use of 3–digit SIC codes (employment that is incorrectly classified as being in creative industries), we are unable to eradicate it.
A further constraint is that the employment data at 4–digit ISCO level necessary to construct estimates of creative jobs is not available in some countries, but is available at the lower 3–digit resolution. This is the case with Bulgaria, Cyprus, Denmark, Greece, Italy, Latvia, Portugal and Spain for the 2011–2013 period that we consider in this report, and for Germany and Belgium in 2011. For these years, employment in only one creative occupation is counted in these countries, leading to employment in creative occupations (and consequently in the creative economy) being understated. Creative industry employment numbers are, however, unaffected by this.
As a result, at the level of the EU member states (EU–28) as a whole and for those countries affected, this report presents employment estimates only for the creative industries, not the creative economy (in the cases of Germany and Belgium we are able to present creative economy and occupations estimates for 2012–2013 where the occupations data is available at the 4–digit ISCO level).
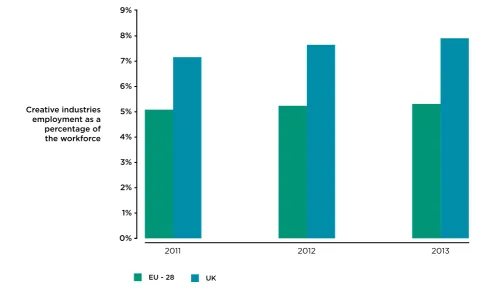
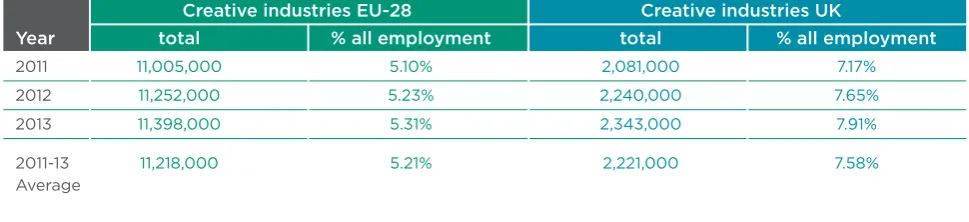
Table A presents our headline results for the EU and UK creative industries for the period 2011–2013 (Figure A charts these numbers for the proportion of the workforce). It shows that the creative industries account for a higher proportion of the UK workforce (7.58 per cent) than they do in the EU as a whole (5.21 per cent – both figures 2011–13 average). The average annual employment growth of UK creative industries outstripped that of EU creative industries, at 6.1 per cent per annum (p.a.) versus 1.8 per cent p.a. over 2011–2013.
TABLE A:
CREATIVE INDUSTRIES EMPLOYMENT IN THE EU AND UK, 2011–2013
Source: EU Labour Force Survey.
Notes: Figures exclude small cells and volatile codes. UK figures use 3-digit SIC codes and exclude second jobs, so for these and other reasons (see above) do not directly correspond to the official UK figures.
Creative industries EU-28 Creative industries UK
Year total % all employment total % all employment
2011 11,005,000 5.10% 2,081,000 7.17%
2012 11,252,000 5.23% 2,240,000 7.65%
2013 11,398,000 5.31% 2,343,000 7.91%
2011-13 11,218,000 5.21% 2,221,000 7.58%
FIGURE A:
CREATIVE INDUSTRIES EMPLOYMENT IN THE EU AND UK AS A
PROPORTION OF THE WORKFORCE, 2011–2013
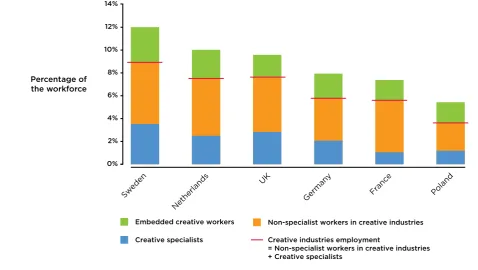
Of the six EU member states for which we consider the creative economy (including the UK), Sweden has proportionately the largest creative economy workforce (11.9 per cent in 2013), followed by the Netherlands (10.9 per cent), the UK (9.93 per cent), Germany (8.0 per cent), France (7.5 per cent) and then Poland (5.6 per cent). All of the comparator countries experienced growth in their creative economy workforces between 2011 and 2013. Creative intensity turns out to be highest in Sweden (0.398 across all industries between 2011 and 2013), followed by the UK (0.367), Germany (0.357, in 2012–2013), the Netherlands (0.335), Poland (0.323), and France (0.184). According to our estimates, the UK, Netherlands and Sweden have more creative workers inside the creative industries than outside;5 Germany has slightly more
creative workers outside creative industries than inside them; and Poland and France have substantially greater numbers of creative workers outside than inside creative industries. Figure B plots these numbers. For reference, Appendix 4 provides the average 2011-2013 Creative Tridents for all EU member states where occupations data are available at the 4–digit ISCO level.
9% 8% 7% 6% 5% 4% 3% 2% 1% 0%
2012 2013
2011
EU - 28 UK
FIGURE B:
EMPLOYMENT IN THE CREATIVE ECONOMY AND ITS COMPOSITION
Notes: with the exception of Germany which is based on the average of 2012–2013 data all other countries figures are an average of 2011–2013 data.
Figure B shows that there is great variation in creative industries’ employment share of the workforce too: Sweden’s creative industries, again, have the largest employment share (8.9 per cent 2011-2013 average), followed by the UK (7.6 per cent), the Netherlands (7.5 per cent), Germany (5.7 per cent), France (5.6 per cent) and then Poland (3.6 per cent). France experienced a slight shrinkage in its creative industries’ employment share between 2011 and 2013, down 0.17 percentage points. In Sweden, the creative industries’ workforce share remained roughly constant. The UK, Netherlands, Poland and Germany, in contrast, all experienced growth in their creative industries workforce shares.
Reassuringly, in all five UK comparator countries, the distribution of creative intensity appears to be bimodal, providing some support for the transferability of the key insight from the UK Dynamic Mapping study that creative intensity serves as a discriminator between creative and non–creative industries.
The analysis presented in this report adds to a small number of previous studies that provide comparative analyses of Europe’s creative economy (Clifton and Cooke, 2009; Evans, 2009; King, Mellander, and Stolarick, 2009; O’Connor and Kong, 2009).6 However, notwithstanding
the limitations associated with a lack of pan–EU employment survey data at the 4–digit SIC level and gaps in occupational data at the 4–digit ISCO level, we think our work represents the most ambitious attempt to date. We conclude that there is an urgent need for more detailed occupation and industry information in labour force datasets across EU member states to enable future international comparisons at the degree of resolution that is more commonly available in national data sets, and we suggest this is a priority for Eurostat to consider.
14% 12% 10% 8% 6% 4% 2% 0%
Embedded creative workers Non-specialist workers in creative industries Creative industries employment
= Non-specialist workers in creative industries + Creative specialists
Creative specialists
Percentage of the workforce
Sweden
Netherlands
UK
German y
Franc e
[image:8.595.48.527.128.398.2]1.
INTRODUCTION
T
his report looks at the creative industries of the EU, UK and other member states between 2011 and 2013. Where possible, it also provides estimates of creative economy employment (i.e. the number of workers employed in the creative industries plus those employed in creative occupations outside of the creative industries). It does this using the EU Labour Force Survey (EU LFS). This analysis has a companion report that delivers comparative estimates for the US and Canadian creative economies (Nathan, Kemeny, Pratt, and Spencer, forthcoming).The starting point for the analysis in this report is the Dynamic Mapping methodology for classifying and measuring the creative economy developed by Bakhshi, Freeman and Higgs (2013) (henceforth BFH), and which has been adopted by the UK government to generate the official creative economy estimates (Department for Culture Media and Sport, 2014). This methodology is based on the principle that the creative industries are “those industries that specialise in the employment of creative talent for commercial purposes” (Bakhshi, Hargreaves and Mateos–Garcia, 2013) – that is, have unusually high proportions of their workforce employed in creative occupations (creative intensity). The BFH analysis has five stages:
I. Determine the set of ‘creative occupations’, defined using 4–digit Standard Occupational Classification (SOC) codes o = 1, …. o for the set of all 4–digit occupation codes O. To do this, BFH subjectively score 4–digit SOC codes in a ‘Creative Grid’, whose criteria are drawn from a review of the creative work literature and identify five task–level features of creative work. BFH then score a longlist of occupations, keeping those 4–digit SOCs that score four or more out of five in terms of task content.
II. Calculate total employment in each 4–digit Standard Industrial Classification (SIC) code (SIC4) industry cell i across the set of all 4–digit industries I = 1, …. i. Work out the ‘creative intensity’ of each industry. This is specified as the share of creative occupations’ employment in industry i, or Ecoi/Ei (where Ecoi is employment in creative occupations in industry i and Ei is
all employment in industry i).
III. Set a creative intensity ‘threshold’, where industries with creative intensities above this threshold are denoted ‘creative’ industries, and the rest are denoted ‘non–creative’. BFH use a probabilistic procedure to identify this threshold as 30 per cent for the UK over the period studied.7 They also exclude some ‘volatile’ industries where creative intensity is not
consistently above the threshold, or where codes are based on particularly small samples following official guidance.
IV. Calculate creative industries and creative economy employment following Higgs et al’s (2008) Creative Trident approach. Specifically, creative economy employment is given by the sum of creative industries employment (Eci), and all creative jobs in other industries
(‘embedded’ jobs, or Ecoi across all non–creative industries i).
BFH find just under 2.5 million creative economy jobs in the UK in 2010 using Annual Population Survey (APS) data. This estimate is based on SOC 2000 codes. Bakhshi, Davies, Freeman and Higgs (2015) (hence BDFH) update these estimates for the period 2011–2013, using the set of 4–digit SOC2010 codes and SICs adopted by the DCMS in its Creative Industries Economic Estimates. They find 2.6 million creative economy jobs in 2013. It is important to note that following a public consultation, the DCMS includes in their estimates some SOC2010 codes that, according to BFH, would not score high enough on the Creative Grid to be deemed ‘creative’, and some SIC codes whose creative intensity is lower than 30 per cent. So, the results in BDFH are not strictly consistent with an application of the Creative Grid and intensity analysis in BFH, although for the most part the occupations and industries involved are the same. Appendix 1 sets out the DCMS–designated 4–digit creative occupations and creative industries.
This detailed, multi–year structured comparative exercise is the first of its kind that we are aware of, although there are other, simpler studies on creative occupations (King, et al., 2009), the creative industries (Falk et al., 2011), and creative industry clusters (Boix, Capone, De Propris, Lazzeretti, and Sanchez, 2014; Boix, Hervás–Oliver, and De Miguel–Molina, 2012).8 There is also
2.
EXTENDING THE DYNAMIC
MAPPING APPROACH
W
e use the DCMS classifications and the key insights from the Dynamic Mapping to derive estimates of employment in the creative industries, and where possible the creative economy, in the EU member states. Our workflow is as follows:• First, we crosswalk the set of DCMS creative occupations to internationally consistent International Standard Classification of Occupations (ISCO) codes. (We also use this step in our forthcoming North America–UK analysis).
• Second, we perform a parsing exercise on the DCMS classification of creative industries. The UK and other EU member states use a harmonised industrial coding system (SIC/NACE) to the 4–digit level,9 but the pan–EU data supplied by Eurostat is not available at this level of
resolution. We therefore ‘translate’ from the 4–digit UK codes, using parsing rules to generate 3–digit best–fit equivalents.
• Third, we compare employment levels, shares and trends across the UK and EU, and look at specific UK comparator countries among EU member states (noting where there are gaps in the data). We do this for the creative industries as a whole, for specific creative industry sub–sectors and, where possible, the creative economy and its components (i.e. the Creative Trident). We also subject our main results to a series of sensitivity tests.
Producing internationally consistent creative economy employment estimates requires us to address a number of data–related challenges. Foremost, we need data at a sufficiently high level of resolution to identify the employment in individual creative occupations and industries over time. In this case, where the data allow, we also want to produce estimates for the EU as a whole, as well as individual member states, some of which we use as comparator countries to the UK. We discuss these issues in sections 2.1 and 2.2 below.
Our estimates will also be sensitive to the crosswalking/parsing rules we adopt. It is important to understand in some detail why this is the case, in order to correctly interpret the results. For occupations, we need to translate UK occupational codes (SOC2010) to the international ISCO 2008 standard: to do this, we use official concordance tables developed by the UK Office for National Statistics and the EU. In almost all cases, we have a 1:1 match from a given UK cell to its international equivalent, but there are a couple of cases where the match is not perfect. Section 3 explains the decisions we make in these cases.
2.1
Datasets
We use 2011–2013 EU LFS data, plus UK APS microdata (used in the original Dynamic Mapping study by BFH and subsequent work by BDFH) for robustness checks on the UK estimates and to aid interpretation of the EU results. We summarise the key features of these datasets below. For the main analysis we use 2011–2013 data from the EU LFS. We face three practical
considerations. First, where the data allows, we want to compare the UK’s creative industries and economy with that of specific EU member states. Second, we want the flexibility to vary the set of country comparators. Third, we work within the parameters of available pan–EU data: the richest labour force survey data for EU member states is held by individual national statistical agencies, and it would be a major undertaking to collate these, and in a way that is consistent across countries.10
For all of these reasons, we use bespoke aggregates from the large, cross–country EU LFS dataset compiled by Eurostat. The EU LFS is the largest European household sample survey, providing a mixture of quarterly and annual information across all 28 member states (Eurostat, 2014).11 The EU LFS generates 1.8 million household observations per quarter, or 7.2 million
observations per year, covering between 0.2 per cent and 3.3 per cent of households depending on the survey country in question (for example, the UK Labour Force Survey covers 0.16 per cent of all households). The sampling frame is people aged 15 and over, in private households (excluding conscripts).12 The questionnaire covers a broad range of issues, including personal and
demographic information, location, country of origin, human capital and labour market outcomes (economic activity, employment and wages).
Construction of the EU LFS is naturally more complex than working with data for a single country. National statistical institutes select the sample, conduct the analysis and then send anonymised results to Eurostat, which synthesises the output.13 Eurostat has co–ordinated
common conventions (for example, on occupation and industry coding) but member states also have a number of opt–outs (for example, on levels of geographical detail that can be made available). For this analysis, Eurostat provided us with a series of industry–by–occupation cells, based on the original microdata, across all EU member states for the years 2011 to 2013.14
As is clear from this brief overview, the EU LFS has many features that make it ideal for the questions we want to answer.15 There are also some limitations in using the EU LFS data,
however, that we need to adjust for. First, the EU LFS contains no information on second jobs: in robustness checks using the UK APS, we therefore adjust the APS data to remove second job information and align the samples. Second, as highlighted above, the dataset uses NACE industry codes that are identical to UK SICs to the 4–digit level, but the data are only made available at the 3–digit level. Our parsing approach, outlined in the next section, creates best–fit 3–digit matches to the creative industries identified by BFH and DCMS (2014). We interpret our results accordingly. For these reasons and others, the APS estimates we report in this study are not identical to the DCMS’s published creative economy estimates. Third, as household samples vary substantially across contributing countries, Eurostat places heavy restrictions on the availability of sub–national industry and occupational aggregate data in some countries. This means that sub–national estimates are not presented in this report.
We need to deal with two further issues in the EU LFS data. First, we run our analysis with and without cells that Eurostat flags as potentially problematic. It turns out these make little difference to the aggregate (EU–28) results, but they are more noticeable in the analysis of some individual countries, and this affects our choice of member states for more detailed analysis (see below).16 Second, for some countries in certain years, occupational codes are only coded
to 3–digit resolution in the EU LFS (Germany and Belgium in 2011; Bulgaria, Cyprus, Denmark, Portugal, Greece, Italy, Latvia and Spain in 2011–2013). In these cases, occupational data is
cover the same occupations, so there is no issue. However, in all other cases (e.g. 251 and 2510) it is not possible to observe the creative occupational information we need (e.g. 2511–2513), so that jobs in almost all creative occupations are in this case ascribed to non–creative employment. The effect of the 3–digit resolution in the occupational coding for these countries for these years is to understate creative occupations and creative economy employment totals, as well as estimates of creative intensities. However, there is no effect on creative industry employment, as employment estimates are derived from all creative industry employees, not just those in creative occupations, and so any misallocated workers are ‘allocated back’.
At the individual country level where this issue affects all three years of the data, we therefore present creative industry employment statistics only. Where 2011 alone is affected (as in
Germany and Belgium) we present creative occupations and economy employment statistics for 2012–2013. At an EU–28 level, owing to this issue affecting a number of larger countries e.g. Italy and Spain, we present statistics only for employment in the creative industries, not the creative economy.
In all other cases we present creative economy estimates, and their decomposition according to the Creative Trident, either in the main text or in an appendix.
As mentioned above, we use APS data in some of the robustness checks. The APS is the largest household survey in the UK and combines waves 1 and 5 of the UK’s quarterly Labour Force Survey with annual local data for England, Scotland and Wales (Office for National Statistics, 2015). Each year, the APS contains around 320,000 observations on respondents aged 16 or over, and provides very rich information on socio–economic indicators for individuals and their households. The APS includes information on second jobs and on self–employed people, common features in creative industries and occupations (and a principal reason why it is the basis for Nesta’s Dynamic Mapping and the DCMS’s Creative Industries Economic Estimates).
2.2
EU comparator countries
We conduct national analysis on five EU member states for comparison with the UK. The
selection of countries is partly informed by the quality of the available EU LFS data. We roughly divide the EU into mainland European, Scandinavian, and Eastern European countries that have more recently joined the Union. Within these groupings we select countries with the largest populations according to the most recent country–level data (2014 or 2015).17 For mainland
3.
CROSSWALKING AND PARSING
CREATIVE OCCUPATIONS AND
INDUSTRIES
T
his section of the report explains how we create lists of EU creative occupations and industries by crosswalking from the UK codes specified by DCMS. As in many countries, different national industry and occupation systems have evolved in parallel over time.18 In recent years, there has been a series of efforts to ‘back fit’ these into international standardised typologies such as ISCO (for occupations), ISIC (for industries) and, within this, NACE (for EU countries).19In our forthcoming North American analysis, we have used these international standards to create a bridge from UK to US coding systems. Here, we have a different task. In the case of occupations, we can go directly from UK SOC2010 codes to ISCO 2008 codes, as these are used in the EU LFS data. As we show below, the concordance table produces 1:1 matches in almost all cases.
For industries, all EU member states use the NACE coding system, which has four levels of detail: the UK’s SIC 2007 typology therefore is identical to NACE up to the 4–digit SIC4 level.20 However,
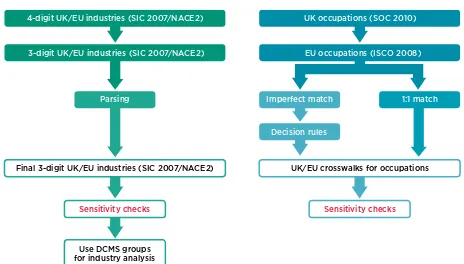
[image:14.595.67.531.513.777.2]pan–EU datasets such as the EU LFS are only available at the SIC3 level. That is, the EU LFS data gives 3–digit SIC/NACE ‘group’ fields, but the UK creative industries are defined using 4–digit SICs (‘classes’) in the DCMS statistics. Since doing a simple shift from 4– to 3–digit industries will bias our estimates, we need to streamline, or ‘parse’, the DCMS categories to develop best–fit 3–digit equivalents that can be applied across all countries in the EU data. Our basic workflow is set out in Figure 1. The left–hand column covers industries, and the right–hand column occupations.
FIGURE 1
CROSSWALK WORKFLOW
4-digit UK/EU industries (SIC 2007/NACE2)
Final 3-digit UK/EU industries (SIC 2007/NACE2)
3-digit UK/EU industries (SIC 2007/NACE2)
Parsing
Sensitivity checks Sensitivity checks
Use DCMS groups for industry analysis
UK occupations (SOC 2010)
UK/EU crosswalks for occupations
EU occupations (ISCO 2008)
Imperfect match
Decision rules
3.1 Occupations
For occupations, we crosswalk UK SOC2010 codes to the most recent ISCO08 occupation coding. We use the standard concordance table developed by ONS.21 Appendix 2 sets out the
resulting crosswalk. The 30 4–digit SOC codes designated by DCMS as creative, map to 31 4– digit ISCO codes. In the majority of cases we have a 1:1 match. In two cases (3417, Photographers, audio–visual and broadcasting equipment operators, and 3422, Product, clothing and related designers), the SOC codes match on to two ISCO codes. We find one case where the crosswalk appears to have been made in error (5449, Other skilled trades not elsewhere classified)
and correct for this. We also identify some candidate codes for sensitivity checks: these are discussed in Section 5.
3.2 Industries
For industries, we need a slightly different approach. As all EU member states use the same industry codes, no crosswalking is required. However, we need a suitable way to move from 4–digit SIC/NACE codes to the larger 3–digit SIC/NACE codes for which EU LFS data is available. As discussed above, shifting from 4–digit to larger 3–digit industry codes will automatically increase the size of creative industries employment, since the new industry units are larger. In some cases the 3– and 4–digit codings will be identical (if, say, because there is no disaggregation of a 3–digit code into 4–digit code), or will closely resemble each other (if almost all of a given 3–digit cell’s components are used in the relevant 4–digit list). In other cases, 3– digit codes will contain ‘irrelevant’ industries or false positives (e.g. SIC4 industry cells left out of the DCMS list on the basis of low intensity).
Our parsing process removes these codes to leave us with a list of ‘best fit’ 3–digit creative industries. This process needs to be handled in a way that is transparent and consistent, so that the effects can be easily understood by readers and tested in sensitivity checks.
We use this variation to develop a simple inclusion rule, made up of the following steps:
1. We start with the DCMS 4–digit SIC/NACE creative industry codes.
2. For each DCMS 4–digit code, we retrieve each corresponding 3–digit code and all relevant 4– digit codes for that code cell.
3. For each of the relevant 3–digit codes, we retain it if at least 50 per cent of the 4–digit codes under it appear in the DCMS 4–digit list, and exclude it otherwise.
Appendix 3 sets out the parsing process and the resulting industry set. Overall, it transforms the 33 DCMS 4–digit industry codes into 17 unadjusted 3–digit codes, and then to 15 parsed SIC3 codes. The parsing process means we lose cultural education (SIC 85.52), which slightly shrinks the ‘Music, visual and performing arts’ industry group; in the UK, this group has a creative intensity in the 2013 APS data of 0.371. We also lose SIC 32.12, Manufacture of jewellery and related articles, which has a creative intensity of 0.601 in the 2013 APS. The exclusion of these creative industries is far from ideal, but necessary if consistent industrial codes are to be used across countries without including a very large number of false positive industries that are self– evidently not ‘creative’ in terms of workforce characteristics.
4.
THE CREATIVE INDUSTRIES IN
THE EU AND THE UK
T
his section of the report provides headline information on creative industry jobs in the EU–28 as a whole and in the UK, and employment trends between 2011 and 2013.224.1
EU and EU–28 Creative industries: levels, shares and trends
[image:16.595.55.540.391.502.2]Table 1 presents employment estimates for the UK and EU creative industries between 2011 and 2013. The left hand panel shows the EU results and the right hand panel the corresponding UK results.
TABLE 1
CREATIVE INDUSTRIES EMPLOYMENT IN THE EU AND UK, 2011–2013
Turning to the comparison between the EU and UK, in counts the UK creative industries account for a higher proportion of overall employment (7.58 per cent on average between 2011 and 2013), than the creative industries do of the EU workforce as a whole (5.21 per cent). The UK’s creative industries’ average annual employment growth outstripped that of the EU creative industries, at 6.1 per cent per annum (p.a.) versus 1.8 per cent p.a. over 2011–2013.
These EU estimates are significantly higher than those in previous studies of the creative industries in EU countries (Falk et al., 2011, KEA 2006). Falk and colleagues estimated that creative industries in the EU–27 employed 6.7 million people in 2008, or around 3 per cent of total employment, using different definitions and countries; the consultants, KEA European Economic Affairs estimated that there were 5.8 million creative industries workers across the EU–25 in 2004, or 3.1 per cent of total employment. There are a number of likely explanations which together account for the discrepancies: we use NACE2 industry codes rather than the NACE1.1 codes primarily used by Falk et al., and KEA; we use ISCO 2008 codes rather than the ISCO88 codes used by KEA; we use 3–digit NACE codes rather than a mix of 3 and 4–digit codes
Source: EU Labour Force Survey.
Notes: Figures exclude small cells and volatile codes. UK figures use 3-digit SIC codes and exclude second jobs, so for these and other reasons (see above) do not directly correspond to the official UK figures.
Creative industries EU-28 Creative industries UK
Year total % all employment total % all employment
2011 11,005,000 5.10% 2,081,000 7.17%
2012 11,252,000 5.23% 2,240,000 7.65%
2013 11,398,000 5.31% 2,343,000 7.91%
2011-13 11,218,000 5.21% 2,221,000 7.58%
(Falk et al.) and we use a rather larger set of ISCO and NACE codes than the KEA study;23 we
use harmonised Eurostat labour force survey data which includes the self–employed, rather than business survey data which excludes it (Falk et al.) or non–harmonised employment data (KEA); we look at a more recent time period, and last, but not least, we consider the EU–28 rather than EU–27 or EU–25.
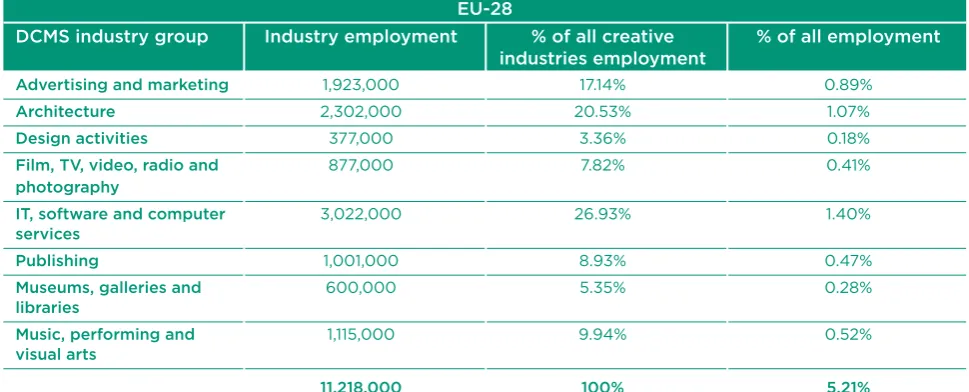
[image:17.595.55.540.278.474.2]4.2
Creative industries by sub–sector
Table 2 compares the creative industries on a sub–sectoral basis.
TABLE 2
EU/UK CREATIVE INDUSTRIES GROUPS, 2011–2013 COMPARISON
EU-28
DCMS industry group Industry employment % of all creative % of all employment industries employment
Advertising and marketing 1,923,000 17.14% 0.89%
Architecture 2,302,000 20.53% 1.07%
Design activities 377,000 3.36% 0.18%
Film, TV, video, radio and 877,000 7.82% 0.41%
photography
IT, software and computer 3,022,000 26.93% 1.40%
services
Publishing 1,001,000 8.93% 0.47%
Museums, galleries and 600,000 5.35% 0.28%
libraries
Music, performing and 1,115,000 9.94% 0.52%
visual arts
11,218,000 100% 5.21%
UK
DCMS industry group Industry employment % of all creative % of all employment industries employment
Advertising and marketing 445,000 19.98% 1.52%
Architecture 437,000 19.68% 1.49%
Design activities 109,000 4.90% 0.37%
Film, TV, video, radio and 211,000 9.50% 0.72%
photography
IT, software and computer 562,000 25.28% 1.92%
services
Publishing 190,000 8.63% 0.65%
Museums, galleries and 106,000 7.22% 0.36%
libraries
Music, performing and 161,000 4.81% 0.55%
visual arts
2,221,000 100.00% 7.58%
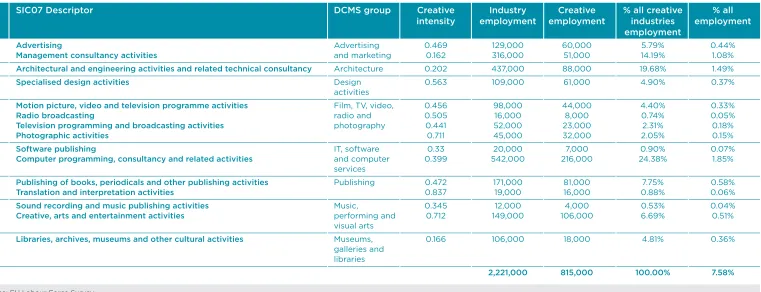
[image:17.595.57.540.279.727.2]In broad terms, the employment shares of the industry groups are ranked similarly in both the UK and in the EU as a whole. Tables 3 and 4 break down the industry groups into their component three–digit codes, for the UK and the EU respectively. These tables shed further light on the sub– sectoral differences between the creative industries workforce in the UK and in the rest of the EU.
TABLE 3
UK 3–DIGIT CREATIVE INDUSTRIES, 2011–2013
Although gaps in the occupations data at 4–digit level mean that it is not possible to make a comparison with the EU–28 as a whole (Table 4), note that employment in the advertising and marketing group in the UK is more dominated by management consultancy jobs, a sector which has much lower creative intensity (0.162) than advertising (0.469).
SIC07 Descriptor DCMS group Creative Industry Creative % all creative % all
intensity employment employment industries employment
employment
73.1 Advertising Advertising 0.469 129,000 60,000 5.79% 0.44%
70.2 Management consultancy activities and marketing 0.162 316,000 51,000 14.19% 1.08%
71.1 Architectural and engineering activities and related technical consultancy Architecture 0.202 437,000 88,000 19.68% 1.49%
74.1 Specialised design activities Design 0.563 109,000 61,000 4.90% 0.37%
activities
59.1 Motion picture, video and television programme activities Film, TV, video, 0.456 98,000 44,000 4.40% 0.33%
60.1 Radio broadcasting radio and 0.505 16,000 8,000 0.74% 0.05%
60.2 Television programming and broadcasting activities photography 0.441 52,000 23,000 2.31% 0.18%
74.2 Photographic activities 0.711 45,000 32,000 2.05% 0.15%
58.2 Software publishing IT, software 0.33 20,000 7,000 0.90% 0.07%
62.0 Computer programming, consultancy and related activities and computer 0.399 542,000 216,000 24.38% 1.85%
services
58.1 Publishing of books, periodicals and other publishing activities Publishing 0.472 171,000 81,000 7.75% 0.58%
74.3 Translation and interpretation activities 0.837 19,000 16,000 0.88% 0.06%
59.2 Sound recording and music publishing activities Music, 0.345 12,000 4,000 0.53% 0.04%
90.0 Creative, arts and entertainment activities performing and 0.712 149,000 106,000 6.69% 0.51%
visual arts
91.0 Libraries, archives, museums and other cultural activities Museums, 0.166 106,000 18,000 4.81% 0.36%
galleries and
libraries
2,221,000 815,000 100.00% 7.58%
Computer programming, consultancy and related activities followed by Architectural and engineering activities and related technical consultancy, are proportionately the largest sectors in both the UK and EU–28. Creative, arts and entertainment activities account for 0.51 per cent and 0.49 per cent respectively of the UK and EU workforces.
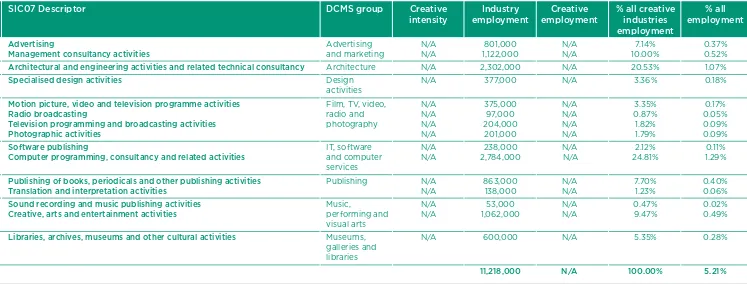
TABLE 4
EU 3–DIGIT CREATIVE INDUSTRIES, 2011–2013
SIC07 Descriptor DCMS group Creative Industry Creative % all creative % all
intensity employment employment industries employment
employment
73.1 Advertising Advertising N/A 801,000 N/A 7.14% 0.37%
70.2 Management consultancy activities and marketing N/A 1,122,000 N/A 10.00% 0.52%
71.1 Architectural and engineering activities and related technical consultancy Architecture N/A 2,302,000 N/A 20.53% 1.07%
74.1 Specialised design activities Design N/A 377,000 N/A 3.36% 0.18%
activities
59.1 Motion picture, video and television programme activities Film, TV, video, N/A 375,000 N/A 3.35% 0.17%
60.1 Radio broadcasting radio and N/A 97,000 N/A 0.87% 0.05%
60.2 Television programming and broadcasting activities photography N/A 204,000 N/A 1.82% 0.09%
74.2 Photographic activities N/A 201,000 N/A 1.79% 0.09%
58.2 Software publishing IT, software N/A 238,000 N/A 2.12% 0.11%
62.0 Computer programming, consultancy and related activities and computer N/A 2,784,000 N/A 24.81% 1.29%
services
58.1 Publishing of books, periodicals and other publishing activities Publishing N/A 863,000 N/A 7.70% 0.40%
74.3 Translation and interpretation activities N/A 138,000 N/A 1.23% 0.06%
59.2 Sound recording and music publishing activities Music, N/A 53,000 N/A 0.47% 0.02%
90.0 Creative, arts and entertainment activities performing and N/A 1,062,000 N/A 9.47% 0.49%
visual arts
91.0 Libraries, archives, museums and other cultural activities Museums, N/A 600,000 N/A 5.35% 0.28%
galleries and
libraries
11,218,000 N/A 100.00% 5.21%
Source: EU Labour Force Survey.
5.
ROBUSTNESS CHECKS
W
hat explains these apparent differences? If our analysis is robust, we have identified structural differences in creative industry workforces between the UK and the rest of the EU. But before proceeding we need to consider two potentially confounding factors. First, and crucially, we want to make sure that our results are not affected by the use of the EU LFS and sample construction. Second, we need to establish that the results are not an artefact of the parsing process described in Section 3. (We explore this by re–running our main results with a more demanding inclusion criterion, which also allows us to see the role that individual ‘marginal’ industries play in the process).5.1
Sensitivity to the use of the EU LFS
Given the substantial data challenges discussed in Section 2, we need to be clear how we interpret and caveat our results. There are three major issues: first, the use of EU LFS data for the UK instead of APS data as in the DCMS Creative Industries Economic Estimates; second, our need to work at a lower level (3–digit) industrial resolution than in the 4–digit DCMS statistics; third, the fact that 4–digit occupational resolution is not consistently available for all countries over the period 2011–2013.
The last issue we address by presenting statistics only where the occupational coding is
[image:20.595.57.542.562.662.2]consistently available. The first and second issues explain why the UK results presented are not directly comparable with the official DCMS estimates. Table 5 shows how these differences affect the estimates. Each panel gives UK employment in creative industries. The left–hand panel contains our estimates using EU LFS data and 3–digit industry cells generated by the parsing rule.
TABLE 5
COMPARING DATASETS AND THE EFFECTS OF THE PARSING RULE
ON UK DATA, 2011–2013
The middle panel uses the same industry codes on APS data, as used by the DCMS but with second jobs removed to allow direct comparability between APS and EU LFS estimates. This comparison also serves as a sensitivity check on the EU LFS data, which is derived from the same underlying labour force survey data as the APS. We see that the creative industries estimates are broadly similar across the two datasets.
Creative industries
UK, EU LFS using 3-digit SICs UK, APS using 3-digit SICs UK, APS using 4-digit SICs
Year total % all total % all total % all
employment employment employment
2011 2,081,000 7.17% 2,143,000 7.47% 1,457,000 5.08% 2012 2,240,000 7.65% 2,300,000 7.96% 1,585,000 5.48% 2013 2,343,000 7.91% 2,375,000 8.09% 1,597,000 5.44%
Source: EU Labour Force Survey, UK Annual Population Survey.
The right–hand panel also uses APS data, but now uses the original 4–digit SIC codes in the DCMS (2014) estimates. (Note again that we have removed second jobs from the APS data so the numbers in the bottom panel are not identical to those in DCMS (2014)). Given the very small differences in the underlying data, comparing the middle and right–hand panels helps us to understand what our parsing rule does to the estimates.
As explained above, shifting to larger industry blocs necessarily raises employment counts/ shares in the creative industries relative to the DCMS estimates, since larger industry blocs are used. As a consequence, the amount of creative employment ‘embedded’ in the wider economy is reduced, as the overall number of individuals employed in creative jobs is unchanged. The parsing rule works to reduce the upwards bias in the creative industry employment estimates by discarding the least ‘relevant’ SIC3 codes from the set of creative industries used in the analysis. (In the next section we test our parsing assumptions, by reproducing our main results using a more conservative inclusion criterion.)
Table 5 shows – as expected – that the creative industries counts and shares are larger when using 3–digit SIC codes. One interpretation of our EU estimates therefore is that they represent upper bounds for the ‘true’ estimates that would have been obtained if we had been able to directly replicate the use of higher industrial resolution data as in the DCMS estimates.
5.2
Sensitivity to sample construction
Here, we make a further check on the EU LFS estimates by omitting from the analysis all industry*occupation cells for which Eurostat has placed a reliability flag. These cells are
disproportionately concentrated in three member states: the Czech Republic, Italy and Spain. As Table 6 shows, overall estimates for the EU–28 are barely affected by this change. Creative industries job counts fall by only 0.07 percentage points. Even though the EU–wide industry estimates are little affected by removing flagged cells, their uneven incidence has implications for country level analysis using the EU LFS however (see Section 2), and we take this into account in our choice of comparator countries for the analysis in Section 7.
5.3
Sensitivity to the parsing of industry codes
The estimates are based on a set of best–fit creative industries, derived from the original DCMS list of creative industries using the parsing process set out in Sections 2 and 3. The parsing rules are designed to minimise the effect of shifting to lower resolution industry ‘blocs’ by: a) removing the least relevant of these blocs from the final set, while b) ensuring creatively intense activities stay in, as far as the less wieldy industry units allow. That is, we want to balance the need to take out industries that are ‘false positives’ (i.e. industries labelled as creative, but where this identification is tenuous) and the need to avoid ‘false negatives’ (industries that are evidently
EU-28 average Creative industries
Year total % all
employment
2011 10,543,000 5.03%
2012 11,252,000 5.23%
2013 11,398,000 5.31%
Year Change
2011 -0.07%
2012 -0.07%
2013 -0.07%
Source: EU Labour Force Survey.
Notes: As in Table 1. Drops industry*occupation cells flagged ‘b’ in the EU LFS, which indicates lower reliability.
creative, but which are not identified as such). As we have seen, this rule still generates higher creative industries and creative economy employment
estimates than the official DCMS estimates. We might therefore be concerned that we are keeping some false positives: industry blocs that do not in fact include much creatively intense activity. To explore this source of bias, we reproduce our main estimates using a tougher creative industries inclusion threshold of 0.75. That is, we only retain 3–digit SIC codes if the corresponding 4–digit DCMS SIC codes account for at least 75 per cent of their make–up. Applying this parsing rule leads to the exclusion of two additional industry groups: Architecture, and Museums, galleries and libraries. In 2013, 4–digit industries in these groups had average creative intensities of, respectively, 0.692 and 0.218. The new rule also excludes PR and communication activities and thus reduces the size of the advertising and marketing group substantially. This suggests that while a more restrictive inclusion condition removes some false positives, it also generates important false negatives.
Table 7 shows that the impact of the new parsing rule is as expected: creative industries
employment drops dramatically, from 11.4 million to 7.23 million in 2013. Shifts in previous years are of a similar order of magnitude. The drastic changes to the set of sub–sectors that make up the creative industries however, suggest that our original parsing rule is preferable to the more conservative specification. Further research should experiment with alternative parsing rules.
EU-28 Creative industries
Year total % all
employment
2011 7,059,000 3.27%
2012 7,290,000 3.39% 2013 7,231,000 3.37%
Source: EU Labour Force Survey. Notes: As in Table 1. Estimates generated using a more conservative parsing rule, which excludes SIC/NACE groups 620 (Computer programming, consultancy and related activities), 702 (Management consultancy activities), 711 (Architectural and engineering activities and related technical consultancy), 910 (Libraries, archives, museums and other cultural activities).
6.
COUNTRY COMPARISONS:
THE UK, FRANCE, GERMANY,
THE NETHERLANDS, POLAND
AND SWEDEN
T
his section shifts the analysis to national level, and develops a descriptive analysis of creative economy employment for the UK and five comparator countries: France, Germany, the Netherlands, Poland and Sweden.24 As explained in Section 2, we divide the EU into three blocs: mainland Europe, Scandinavia and accessioncountries. We then choose countries with the largest populations, and assess the quality of EU LFS data in those countries. In the first bloc – mainland Europe – some national level data is potentially unreliable for Italy and Spain, so we move to the Netherlands as our third country after Germany and France. For reference, Appendix 4 provides creative industry figures (and where possible Creative Tridents) for all EU member states, including the UK, based on the EU LFS data.
6.1
Creative economy: levels, shares and trends
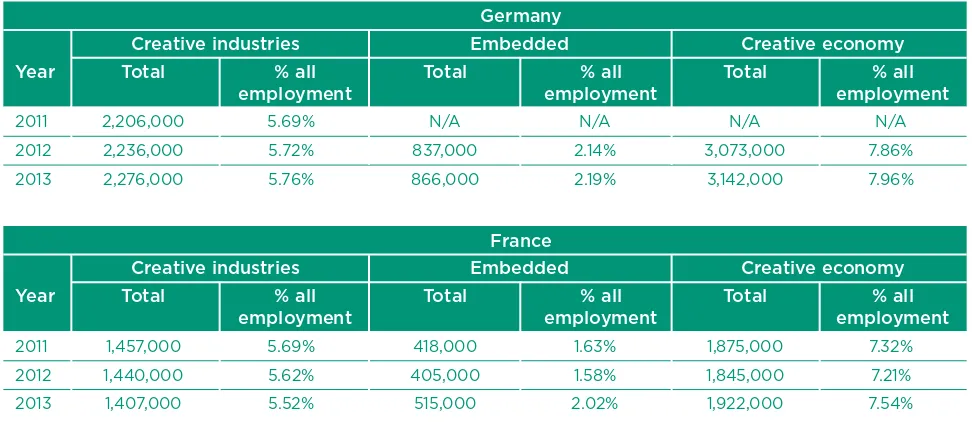
[image:23.595.55.541.566.777.2]Table 8 gives employment headlines for each of these countries, with the UK in the bottom panel. We provide counts and shares for the creative economy, creative industries, and creative workers ‘embedded’ in other industries. Data covers the years 2011 – 2013 inclusive, except for Germany, where for 2011 we present industry results only (due to the absence of 4–digit resolution occupational coding for Germany in that year.).
TABLE 8
CREATIVE ECONOMY EMPLOYMENT, 2011–2013: CROSS–COUNTRY
COMPARISONS
Germany
Creative industries Embedded Creative economy
Year Total % all Total % all Total % all
employment employment employment
2011 2,206,000 5.69% N/A N/A N/A N/A
2012 2,236,000 5.72% 837,000 2.14% 3,073,000 7.86%
2013 2,276,000 5.76% 866,000 2.19% 3,142,000 7.96%
France
Creative industries Embedded Creative economy
Year Total % all Total % all Total % all
employment employment employment
2011 1,457,000 5.69% 418,000 1.63% 1,875,000 7.32%
2012 1,440,000 5.62% 405,000 1.58% 1,845,000 7.21%
In terms of creative economy job counts, Germany is the closest comparator to the UK, with 3.14 million creative economy workers in 2013, versus 2.94 million in the UK. In terms of workforce shares, the Netherlands is the closest comparator, with 10.9 per cent of employees working in the creative economy in 2013, versus 9.93 per cent in the UK. The Netherlands also has a similar share of workers in the creative industries (7.68 per cent vs. the UK’s 7.91 per cent of all workers in 2013). However, in absolute terms the Dutch creative economy comprises just 834,000
workers in 2013, around a third of the UK’s creative economy workforce of 2.94 million. Note that Sweden, although having a much smaller creative economy workforce than the UK’s (557,000 people in 2013), has the largest creative economy employment share of all countries considered (11.92 per cent in 2013). As we shall see, Sweden’s creative industries also have the highest creative intensity.
Netherlands
Creative industries Embedded Creative economy
Year Total % all Total % all Total % all
employment employment employment
2011 547,000 7.33% 153,000 2.05% 700,000 9.39%
2012 567,000 7.49% 162,000 2.14% 729,000 9.63%
2013 588,000 7.68% 246,000 3.21% 834,000 10.90%
Poland
Creative industries Embedded Creative economy
Year Total % all Total % all Total % all
employment employment employment
2011 539,000 3.47% 273,000 1.76% 812,000 5.23%
2012 569,000 3.66% 268,000 1.72% 837,000 5.38%
2013 580,000 3.73% 293,000 1.89% 873,000 5.62%
Sweden
Creative industries Embedded Creative economy
Year Total % all Total % all Total % all
employment employment employment
2011 406,000 8.83% 140,000 3.04% 546,000 11.87%
2012 415,000 8.97% 145,000 3.13% 560,000 12.10%
2013 415,000 8.88% 142,000 3.04% 557,000 11.92%
UK
Creative industries Embedded Creative economy
Year Total % all Total % all Total % all
employment employment employment
2011 2,081,000 7.17% 547,000 1.88% 2,628,000 9.05% 2012 2,240,000 7.65% 566,000 1.93% 2,806,000 9.59% 2013 2,343,000 7.91% 598,000 2.02% 2,941,000 9.93%
Source: EU Labour Force Survey.
We now look briefly at each country in turn. Germany’s creative economy and creative industries are bigger than the UK’s in counts – the only instance of this in the countries we consider – but are smaller in relative terms (7.96 per cent versus 9.93 per cent of the workforce in 2013). Both creative economy jobs (0.09 percentage points) and creative industries jobs (0.04 percentage points) have grown marginally between 2012 and 2013.
France’s creative economy and creative industries are smaller than the UK’s, both in terms of counts (1.92 million employed in France’s creative economy and 1.41 million in its creative industries in 2013, versus 2.94 million and 2.34 million for the UK in the same year) and in terms of employment shares (7.54 per cent for the creative economy and 5.52 per cent for the creative industries in 2013, versus 9.93 per cent and 7.91 per cent respectively in the UK). France is
also the only country of those considered to have seen a (small) fall in the share of its creative industries in the overall workforce between 2011 and 2013).
As noted earlier, the Netherlands is closest to the UK in terms of the creative economy’s share of the national workforce and the creative industries, but is much smaller in absolute term reflecting its smaller population. The Netherlands has seen continuous job growth in all parts of its creative economy during 2011–2013: the creative economy workforce increased by 1.53 percentage points between 2011 and 2013, compared to 0.88 percentage points in the UK. The Dutch growth seems to have been largely driven by a substantial rise in the share of embedded jobs between 2012 and 2013, a rise of 1.07 percentage points. Eurostat rates Dutch data as some of the best quality in the EU LFS, so on the face of it this result represents a large expansion in creative roles across the wider Dutch workforce.
Poland is perhaps the most economically dynamic of the A8 group of countries that joined the EU in 2004. Poland’s creative economy and creative industries workforces are both much smaller than those of the UK – around 30 per cent and 25 per cent of the UK totals, respectively – but about the same size as the Netherlands, at 873,000 (creative economy) and 580,000 (creative industries) in 2013. Of the five countries, Poland also has the smallest creative economy employment shares, at 5.62 per cent of all workers in 2013, compared with 9.93 per cent in the UK. The country has also seen growth in the creative industries and creative economy employment during the study period, but at slower rates than the other countries considered, with the exception of France.
6.2
Creative Tridents
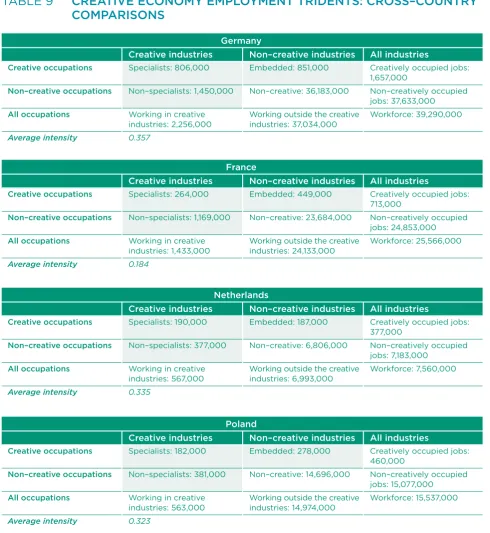
[image:26.595.55.546.218.752.2]Table 9 provides Creative Tridents for the study countries, which shed some more light on the internal structure of each’s creative economy workforce. As before, countries are stacked in order, while the bottom panel includes the UK again for ease of comparison. All data is averaged over 2011–2013, except for Germany where we present 2012–2013 owing to the absence of 4–digit occupational coding resolution in 2011.
TABLE 9
CREATIVE ECONOMY EMPLOYMENT TRIDENTS: CROSS–COUNTRY
COMPARISONS
Germany
Creative industries Non–creative industries All industries
Creative occupations Specialists: 806,000 Embedded: 851,000 Creatively occupied jobs:
1,657,000
Non–creative occupations Non–specialists: 1,450,000 Non–creative: 36,183,000 Non–creatively occupied
jobs: 37,633,000
All occupations Working in creative Working outside the creative Workforce: 39,290,000 industries: 2,256,000 industries: 37,034,000
Average intensity 0.357
France
Creative industries Non–creative industries All industries
Creative occupations Specialists: 264,000 Embedded: 449,000 Creatively occupied jobs:
713,000
Non–creative occupations Non–specialists: 1,169,000 Non–creative: 23,684,000 Non–creatively occupied
jobs: 24,853,000
All occupations Working in creative Working outside the creative Workforce: 25,566,000 industries: 1,433,000 industries: 24,133,000
Average intensity 0.184
Netherlands
Creative industries Non–creative industries All industries
Creative occupations Specialists: 190,000 Embedded: 187,000 Creatively occupied jobs:
377,000
Non–creative occupations Non–specialists: 377,000 Non–creative: 6,806,000 Non–creatively occupied
jobs: 7,183,000
All occupations Working in creative Working outside the creative Workforce: 7,560,000
industries: 567,000 industries: 6,993,000
Average intensity 0.335
Poland
Creative industries Non–creative industries All industries
Creative occupations Specialists: 182,000 Embedded: 278,000 Creatively occupied jobs: 460,000
Non–creative occupations Non–specialists: 381,000 Non–creative: 14,696,000 Non–creatively occupied
jobs: 15,077,000
All occupations Working in creative Working outside the creative Workforce: 15,537,000 industries: 563,000 industries: 14,974,000
Germany has more people employed in creative occupations (1.66 million) compared with the UK’s 1.39 million, while creative industries employment is relatively similar: 2.26 million for Germany and 2.22 million for the UK. The German figures are based on slightly more recent data (2012–13 as opposed to 2011–13) which may also inflate them relative to the UK figures. As the German workforce has around ten million more people than the UK’s, creative industries and occupations account for a larger proportion of the UK’s workforce. Another difference is that creative occupations are more likely to be employed in creative industries (0.82 million) in the UK than outside the creative industries (0.57 million) in the EU LFS data, whereas in Germany the split is more even (0.81 million vs 0.85 million). The creative intensity of the UK (0.367) and German creative industries (0.357) are relatively similar.
France’s workforce is similar to the UK’s (25.56 million vs. 29.3 million), but it has a far smaller creative industries workforce according to the EU LFS data (1.43 million vs. 2.22 million) and seemingly much fewer creative specialists (264,000 versus 816,000 in the UK), so that its creative intensity is much lower too as a result (0.184, versus 0.367). Conversely, the country has the largest ratio of embedded creative workers to specialists (1.7, versus 0.7 in the UK).
As noted earlier, the Netherlands has much smaller creative economy and creative industries workforces than the UK, reflecting its much smaller overall workforce: 7.56 million vs. nearly 30 million in the UK. However, in terms of internal structure the creative economy workforce is quite similar to that of the UK. In particular, the average creative intensity of the Dutch creative industries is 0.335 (versus 0.367 in the UK), and like the UK, the country has more creative workers in these industries than outside: the ratio of embedded workers to specialists is 0.98, higher than the UK ratio of 0.7 but substantially lower than in France (1.7), Poland (1.5) and Germany (1.06 in 2012–2013).
Sweden, 2011–2013
Creative industries Non–creative industries All industries
Creative occupations Specialists: 164,000 Embedded: 142,000 Creatively occupied jobs:
306,000
Non–creative occupations Non–specialists: 248,000 Non–creative: 4,078,000 Non–creatively occupied
jobs: 4,326,000
All occupations Working in creative Working outside the creative Workforce: 4,632,000
industries: 412,000 industries: 4,220,000
Average intensity 0.398
UK, 2011–2013
Creative industries Non–creative industries All industries
Creative occupations Specialists: 816,000 Embedded: 570,000 Creatively occupied jobs:
1,386,000
Non–creative occupations Non–specialists: 1,405,000 Non–creative: 26,515,000 Non–creatively occupied
jobs: 27,920,000
All occupations Working in creative Working outside the creative Workforce: 29,307,000 industries: 2,221,000 industries: 27,085,000
Average intensity 0.367
Source: EU Labour Force Survey
Poland’s workforce is about half the size of the UK’s, but its creative industries workforce is around a quarter of the British total, and the country has a lot more embedded creative workers than specialists (with an embedded: specialist ratio of 1.5). Despite this, the average creative intensity in Polish creative industries appears not dissimilar to that of the UK, at 0.323. This might seem surprising for an accession country, but Poland has been the recipient of substantial FDI in recent years, notably from Germany, which will presumably have helped to raise the level of skilled and creative employment opportunities in the country since 2008.
Sweden has a workforce of just 4.6 million, the smallest of the five countries considered here, and accounting for around 15 per cent of the UK’s working population. It also has a much smaller creative workforce. However, close to 40 per cent of creative industries workers are creative specialists, which gives Swedish creative sectors a higher average creative intensity than their UK and German counterparts. Like the UK, Sweden also has more creative workers inside the creative industries than outside.
6.3
Creative intensity analysis
[image:28.595.55.538.410.673.2]We now explore the distributions of creative intensity across industries in the different countries. Figure 2, shows the characteristic bimodal distribution of UK creative employment by creative and non–creative 3–digit industries, with peaks at 0–5 per cent creative workers (non–creative) and 35–40 per cent (creative), first identified in BFH using 4–digit SIC APS data. Figures 3–7 replicate this analysis for the five comparator countries.
FIGURE 2
DISTRIBUTION OF CREATIVE JOBS BY INTENSITY, 3–DIGIT
INDUSTRIES, UK
Figure 3 gives the results for Germany 2012–2013. There is a bimodal distribution of creative occupations between designated creative and non–creative sectors. Like France – and unlike the Netherlands, Poland and Sweden – there is also a great deal of creative work in ‘non–creative’ industries.
Employment (thousands)
Percentage creativity intensity 400
600 1,000
800
200
0
35-40 40-4545-5050-5555-60 60-65 65-70
70-75
75-80 80-85 85-90 90-9 5
95-100 0-5 5-10 10-15 15-20
20-25 25-30
30-35
Non-creative industries Creative industries
FIGURE 3
DISTRIBUTION OF CREATIVE JOBS BY INTENSITY, 3–DIGIT SIC
INDUSTRIES, GERMANY
[image:29.595.54.545.507.765.2]Figure 4 plots the distribution of creative intensity for France. Here, the distribution of creative intensities is only ‘loosely’ bimodal – strictly speaking the two peaks both occur in the set of non–creative industries. The average creative intensity for French industry is substantially lower than in the other comparator countries, and we again see that non–creative industries employ a large proportion of creative workers.
FIGURE 4
DISTRIBUTION OF CREATIVE JOBS BY INTENSITY, 3–DIGIT SIC
INDUSTRIES, FRANCE
Employment (thousands)
Percentage creativity intensity 400
600 1,000 800
200 0
35-40 40-4545-5050-5555-60 60-65 65-70
70-75
75-80 80-85 85-90 90-9 5
95-100 0-5 5-10 10-15 15-20
20-25 25-30
30-35
Non-creative industries Creative industries
Source: EU Labour Force Survey.
Source: EU Labour Force Survey. Employment
(thousands)
Percentage creativity intensity 400
1,000 800 600
200 0
35-40 40-4545-5050-5555-60 60-65 65-70
70-75
75-80 80-85 85-90 90-9 5
95-100 0-5 5-10 10-15 15-20
20-25 25-30
30-35
Figure 5 looks at the Netherlands, where average creative intensity is 0.335, relatively close to the UK, and Figure 6 presents the results for Poland, where average creative intensity is 0.323. In both cases the distributions can again be characterised as broadly bimodal.
[image:30.595.51.540.512.748.2]FIGURE 5
DISTRIBUTION OF CREATIVE JOBS BY INTENSITY, 3–DIGIT SIC
INDUSTRIES, THE NETHERLANDS
FIGURE 6
DISTRIBUTION OF CREATIVE JOBS BY INTENSITY, 3–DIGIT SIC
INDUSTRIES, POLAND
Source: EU Labour Force Survey.
Source: EU Labour Force Survey. Employment
(thousands)
Percentage creativity intensity 200
100 400
300
0
35-4040-4545-50 50-5555-6060-65 65-70
70-75
75-80 80-85 85-90 90-9 5
95-100 0-5 5-10 10-15 15-2020-25 25-30
30-35
Non-creative industries Creative industries
Employment (thousands)
Percentage creativity intensity 200
100 400
300
0
35-40 40-4545-5050-5555-60 60-65 65-70
70-75
75-80 80-85 85-90 90-9 5
95-100 0-5 5-10 10-15 15-2020-25 25-3030-35
Finally, Figure 7 plots the results for Sweden. Here, there is clearly a bimodal distribution of creative work, although – as noted earlier – Sweden’s creative industries have the highest creative intensities of the group of countries we consider.
FIGURE 7
DISTRIBUTION OF CREATIVE JOBS BY INTENSITY, 3–DIGIT SIC
INDUSTRIES, SWEDEN
The finding that each of the five comparator countries exhibits a creative intensity distribution across industries that is broadly bimodal is important. It indicates that creative intensity may be used to reliably discriminate creative and other industries in other parts of the European Union, not just in the UK.
Source: EU Labour Force Survey. Employment
(thousands)
Percentage creativity intensity 100
50 200
150
0
35-40 40-4545-5050-5555-60 60-65 65-70
70-75
75-80 80-85 85-90 90-9 5
95-100 0-5 5-10 10-15 15-2020-25 25-3030-35