Project no.:
608540
Project acronym:
GARPUR
Project full title:
Generally Accepted Reliability Principle with
Uncertainty modelling and through probabilistic Risk assessment
Collaborative project
FP7-ENERGY-2013-1
Start date of project: 2013-09-01
Duration: 4 years
D4.2
Upgrading of the decision-making process
for system development
Original due deliverable date: 2016-08-31
Actual deliverable date: 2016-10-25
Organisation name of lead beneficiary for this deliverable:
University of Strathclyde
Project co-funded by the European Commission within the Seventh Framework Programme (2007-2013) Dissemination Level
PU Public x
PP Restricted to other programme participants (including the Commission Services)
RE Restricted to a group specified by the consortium (including the Commission Services)
Deliverable number: D4.2
Deliverable title: Upgrading of the decision-making process for system development
Work package: WP4: System development
Lead participant: University of Strathclyde
Revision Control
Date Revision Author(s) Comments
2016-10-25 1.0 Bell, Bukhsh, Vergnol et al. First version submitted to Scientific Advisor
Quality Assurance, status of deliverable
Action Performed by Date
Verified (Task leader) Keith Bell (Strathclyde) 2016-10-25
Verified (WP leader) Jonathan Sprooten (ELIA) 2016-10-25
Reviewed (Scientific Advisor) Louis Wehenkel (ULG) 2016-11-21
Approved (Executive Board) Executive Board members (by e-mail) 2016-12-21
Approved (Coordinator) Oddbjørn Gjerde (SINTEF) 2016-12-22
Submitted
Author(s) Name Organisation E-mail
Arnaud Vergnol ELIA [email protected]
Bernard Campion ELIA [email protected]
Jonathan Sprooten ELIA [email protected]
Konstantin Gerasimov ESO [email protected]
Mette Gamst Energinet.DK [email protected]
Swasti R. Khuntia TU Delft [email protected]
Keith Bell Strathclyde [email protected]
Waqquas Bukhsh Strathclyde [email protected]
Table of Contents
Page
EXECUTIVE SUMMARY ... 9
1 INTRODUCTION ... 11
1.1 The GARPUR project and the goals of system development ... 11
1.1.1 Context: a paradigm shift ... 11
1.1.2 Goal and drivers of system development ... 12
1.2 Relevant uncertainties in system development context ... 14
1.3 Overview of WP4: System development ... 14
1.3.1 Task 4.1: Functional workflow of the system development decision making process ... 15
1.3.2 Task 4.2: Bridging gaps in terms of data, models, and tools for dealing with uncertainties for further upgrading reliability management in system development ... 17
1.3.3 Task 4.3: Upgrading reliability management of the system development decision making process ... 17
1.3.4 Task 4.4 Recommendation for the formulation of new system development approaches and for validation and migration towards new reliability management ... 17
1.4 Report Structure ... 17
2 RELIABILITY CRITERION AND ASSOCIATED SOCIO-ECONOMIC COSTS ... 18
2.1 Development of new reliability criteria for the pan-European electric power system ... 18
2.2 Socio-economic assessment of reliability criteria ... 19
2.3 Assumptions used for shorter-term reliability management and socio-economic assessment ... 19
3 PROPOSED WORKFLOW FOR SYSTEM DEVELOPMENT ANALYSIS IN THE GARPUR FRAMEWORK ... 21
3.1 General overview ... 21
3.2 Macro-scenarios ... 26
3.3 Generation of micro-scenarios ... 27
3.4 Market tool ... 28
3.5 Translation from zonal to nodal data ... 28
3.6 Clustering ... 32
3.7 Assessment of the credible operating states ... 33
3.7.1 Inputs required for assessment methodology ... 33
3.7.2 The assessment process ... 37
3.7.3 Outputs from the network reliability assessment process ... 39
4 AN ILLUSTRATIVE EXAMPLE ... 41
4.1 The 10-bus test case ... 41
4.2 Assumptions ... 41
4.2.1 Reserve requirement ... 41
4.2.3 Reliability criterion ... 42
4.2.4 Time horizon and target year ... 42
4.2.5 Maintenance policy ... 43
4.3 Generation of micro-scenarios ... 43
4.4 The market solution ... 44
4.5 Zonal-to-nodal conversion and clustering ... 47
4.6 Assessment ... 48
4.7 Insights for a system planner ... 53
5 DISCUSSION AND CONCLUSIONS ... 56
5.1 The proposed methodology and achievements to date ... 56
5.2 Future work ... 57
5.2.1 Sharing of learning between GARPUR work packages ... 57
5.2.2 The importance of weather ... 57
REFERENCES ... 59
6 APPENDIX ... 61
6.1 Data for the 10-bus test case ... 61
6.2 Weather Research and Forecasting model (WRF) model ... 62
6.3 NORTA sampling ... 63
6.4 Application of clustering in the synthesis of credible operating states ... 66
6.4.1 Introduction ... 66
6.4.2 Data pre-processing ... 67
6.4.3 Similarity measures ... 67
6.4.4 Types of clustering algorithms ... 70
6.4.5 Evaluation of clustering ... 71
6.4.6 The “right” number of clusters ... 72
6.4.7 Feature sets ... 73
6.4.8 Time-series vs snapshots ... 73
6.4.9 The curse of dimensionality ... 75
6.4.10 Difference between clustering and sampling ... 76
Table of Figures
Page
Figure 1-1: Activities of a TSO across three time scales and their relationship ... 11 Figure 1-2: The triangular relation between grid investment, socio-economic welfare and reliability ... 14 Figure 1-3: Organization of the tasks within the work package 4 of the GARPUR project ... 15 Figure 1-4: Top-level diagram of the long-term decision making process (Figure 3-2 in D4.1
[GARPUR 2015c]) ... 16 Figure 2-1: WP4’s relationship with other WPs in GARPUR ... 18 Figure 3-1: Overview of the proposed workflow for system development analysis (MC:Monte-Carlo
years and NTC:Net-Transfer Capacity) ... 24 Figure 3-2: A step-by-step approach to system development process ... 25 Figure 3-3: Global overview of decision-making process for system development ... 26 Figure 3-4: Illustration of the ENSTO-e macro-scenario approach to cover uncertainties towards
2030 ... 27 Figure 3-5: 24 hour recorded demand profiles (15-minute resolution) of 8 different loads
(representing different types of customers) for the third Wednesday of January, in
three subsequent years ... 29 Figure 3-6: Algorithm for translation of zonal to nodal data ... 31 Figure 3-7: The total load of three subsequent years of records (1 hour resolution) of an example
zone, comprising of the 8 different loads from Figure 3-4 ... 32 Figure 3-8: Components of an operating state ... 34 Figure 3-9: Preventive (pre-contingency) and corrective (post-contingency) actions and line limits ... 40 Figure 4-1: A 10-bus network consisting of two zones. Each zone is symmetric and contains 7
thermal generators and 4 wind generators ... 41 Figure 4-2: Daily demand spread of micro-scenarios for one particular scenario. Horizontal axis
represents one day (24 hours) and vertical axis is total demand in MW ... 43 Figure 4-3: Spread of total generation from wind for one scenario ... 44 Figure 4-4: Average, minimum and maximum thermal generation across 24 hours for one
micro-scenario. The horizontal axis shows hours and vertical axis shows the power in p.u.
(100 base) ... 45 Figure 4-5: Average number of units committed ... 45 Figure 4-6: Flow over the interconnector from zone 2 to zone 1. This figure shows that on average
the flow was always in one direction. However, there were some cases where the
flow reversed. ... 46 Figure 4-7: Effect of transfer capability on the overall costs of the solution. The vertical axis shows
the normalised expected cost. The average is obtained by solving the market model
for 10 micro-scenarios and taking the average across 21,600 snap shots. ... 47 Figure 4-8: Number of snapshots per cluster ID ... 48 Figure 4-9: Normalised cost of balancing the system in the test case. We analysed 599 cluster
centroids, and only 54 centroids have non-zero cost of balancing ... 49 Figure 4-10: Centroid of cluster number 314 that has 37 members. The market solution proposed
49.12 MW and 60 MW at node 2. However, using the assessment model, optimal regulation is to curtail wind at node 2 by 18.28 MW and regulate down the generation at node 2 by 20 MW. ... 51 Figure 4-11: Centroid of cluster number 356 that has 52 members. Generation at node 2 is
Figure 4-12: Centroid of cluster number 173 with 22 members. Thermal generation at node 2 is regulated downwards by 17.70 and the generation is compensated by up regulation of
generation at bus 6 in zone 2. ... 52
Figure 4-13: Centroid of cluster number 62 with 3 members. Thermal generation is regulated downwards in zone 1 at node 2 by 18.02 MW. The decrease in generation in zone 1 is compensated by increase in zone 2 at node 6 and 7. ... 52
Figure 4-14: Number of overloaded lines in post-contingency steady state. The horizontal axis is the contingency number, and vertical axis is the number of overloaded lines. Note that we allow the line to overload in post-contingency up to their short-term rating. ... 53
Figure 4-15: Cluster number 150 with 33 members. The two investment options do not have any significant impact on the costs of balancing this cluster. ... 55
Figure 5-1: Key relationships in determining a power system’s operating state, cost and risk ... 58
Figure 6-1: WRF grid points in (in black) and PV facilities in Spain (in red) in 2015 ... 63
Figure 6-2: Cumulative distribution function for the aggregated wind generation in the Danish power system ... 66
Figure 6-3: Example of 3 points in 2-dimensional space ... 69
Figure 6-4: Box plot of a cluster of 20 synchronized snapshots for 6 loads ... 72
Figure 6-5: Records of the total system load for 2014 ... 74
Figure 6-6: Cluster centroid and all cluster member of one of the cluster of recorded days of total system load ... 74
Figure 6-7: All cluster centroids against all recorded days of the total system load for the whole 2014 ... 75
Figure 6-8: Colormap of the clustered recorded days of total system load, for the whole 2014 ... 75
Figure 6-9: Comparison of K-medoids clustering and NORTA sampling. In the middle (in green) are 28176 re-ordered wind speeds at two different locations for 13 winters. On the left (in blue) are 1000 NORTA samples, and on the right (in red) are 1000 clusters memoids of the records. ... 78
Table of Tables
Page Table 3-1: Ingredients of our optimisation model... 38Table 3-2: Critical operating states and the insights for a system planner ... 40
Table 4-1: A list of contingencies that are considered for analysis ... 42
Table 4-2: Four most expensive clusters and assessment costs for their centroids. ... 49
Table 4-3: Comparison of pre-fault operating costs with and without corrective actions to relieve overloading of a line ... 50
Table 4-4: Overloaded lines and contingencies that led to overloads ... 53
Table 4-5: Effect of investments on operating costs ... 54
Table 6-1: Demand data for the 10-bus test case ... 61
Table 6-2: Generation data of the 10-bus test case ... 61
Table 6-3: Network Data ... 61
Table 6-4: Wind generation data ... 61
Table 6-5: Comparison of values of different distance measure ... 70
Table 6-6: Comparison of clustering based on different distance measure ... 70
Table 6-7: Example data illustrating the “curse of dimensionality” effect... 76
EXECUTIVE SUMMARY
This report is a second public deliverable from work package 4 of the GARPUR project: system develop-ment. Particular objectives of this report are as follows:
1. to propose a methodology for building a credible set of operating conditions for future operation of a power system;
2. to define a methodology for the assessment of a large set of credible operating conditions; 3. using the above two points, propose a system development process that gives a better appraisal
mechanism for future investments in an electricity transmission network; 4. illustration of the proposed method on a 10 bus network.
The planning horizon for a system development planner is long and a system planner must take into ac-count potential changes to generation capacity and demand during that horizon. The uncertainties that affect system development are greater than those that apply, for example, in system operations. Thus, it is important to build up a credible set of operating states that is informed by various uncertainties and adequately represents the range of conditions that might reasonably be expected to arise. The next step in the system development process is to assess these operating states for system operability. If a power system is not operable on some (probable) operating states, then it identifies a potential need for in-vestment in the system. However, given the number and range of uncertainties relevant to system devel-opment, pragmatic approaches must also be developed allowing their assessment.
In first chapter of this report, we give a high level view of objectives of WP4 of the project and give details about the on-going and planned work in various subtasks. This chapter also includes a discussion on rele-vant uncertainties that affect the future operation of a power system, and ways to capture such uncer-tainties from the perspective of a system development planner.
Work packages 2 and 3 of the GARPUR project concern the development of reliability management ap-proaches and criteria and a socio-economic impact evaluation framework respectively, and give vital in-formation for work packages 4, 5 and 6. In the second chapter of this report, we give a brief summary of how methodologies proposed by work packages 2 and 3 could be used in the context of system develop-ment in WP4.
In chapter 3 of this report, we propose a methodology for a system development process that takes ac-count of a number of key uncertainties. This methodology encapsulates the reliability criteria and socio-economic measures and aims to assess the operability of system for a given set of credible operating conditions.
The first step in our proposed methodology is to build a set of credible future operating conditions, i.e. combinations of states of demand, generation and network components that might reasonably be ex-pected to arise. This set must consider all the relevant dependencies of exogenous factors e.g. effect of temperature on demand, impact of weather on outages etc. In order to capture the uncertainties in de-mand at nodal level, we generate large number of nodal dede-mands for a single aggregated zonal dede-mand. This process is based on the historic correlations of nodal demands and is explained further in chapter 3. The set of credible operating states is used as an input to a model of the behaviour of the electricity wholesale market. Given the demand for power and what can be produced by weather-dependent re-newable energy sources (RES), this model outputs the commitment and set points of all the generating units.
states arise due to non-operability or operability at a very high cost; both reasons identify a possible need for investment. Moreover, each assessment identifies the locations where investment in new facilities might be most useful. To summarise, our step-by-step approach to system development consists of fol-lowing 9 steps:
1. Select a target year for system development studies.
2. Using existing macro-scenarios, identify peaks of various parameters like demand, RES penetra-tion, and fuel prices.
3. Construct micro-scenarios that specify hourly profiles of demand, RES and maintenance of assets for the specific year.
4. Using micro-scenarios as an input for the market tool identify the commitment of thermal gener-ators in accordance with prevailing market rules but otherwise unconstrained by the network’s capacity.
5. Perform zonal to nodal conversion for demand on the operating states determined by the market tool, and build a very large set of representative operating states for the target year.
6. Reduce the size of the large set of credible operating states using an appropriate clustering method.
7. Optionally, perform an initial screening of centroids of each cluster thereby allowing (a) the num-ber of cases to be studied in detail to be further reduced and, depending on the screening meth-od used, (b) to identify system problems that are common to more than one cluster.
8. Through detailed assessment on the centroids of clusters, provide insights to the system planner of system weaknesses and possible mitigations.
9. Allow the analysis of different system development options proposed by the system development planner and the quantification of metrics that can contribute to investment decision-making. The proposed methodology is illustrated using a 10-bus network described in chapter 4. We use realistic demand and wind data to build a set of credible operating states. A market model is used to determine the set points of thermal generation units whilst considering temporal constraints like ramp rates and minimum up and down times. We describe the use of zonal to nodal conversion and clustering concepts that were introduced in chapter 3 of this report and show how the process can reveal key system limita-tions and the condilimita-tions under which they arise. We show how a traditional approach to system devel-opment planning based solely on a peak demand condition would have missed these critical limits. More-over, the assessment model takes account of both continuous and short-term ratings of lines and post-contingency corrective actions by a system operator and a discussion is presented on options for how a system development planner might take account of the need for planned outages to be accommodated on the system. These are:
1. to model, albeit in some approximate way, the way in which outages would typically be planned, and then to assess the operability of the system given such outage plans;
2. to assess the maintainability of the network while still being secure against contingencies (unplanned outages), i.e. to determine if there is margin for planned outages to be taken.
1
INTRODUCTION
1.1
The GARPUR project and the goals of system development
This deliverable is a summary of the work done in the framework of the GARPUR1 project in Task 4.2 and
Task 4.3 (“Task” will henceforth will be denoted by letter “T”) of Work Package 4 (“Work Package” will henceforth be denoted by letters “WP”) as defined in the Description of Work (“Description of Work” will henceforth be denoted by “DoW”) of the GARPUR project.
WP4 focuses on system development, including paths for the development of new network facilities in the long-term timeframe and optimisation of the network investment project portfolio in the mid-term timeframe. These decisions influence how the transmission system is maintained (asset management) and operated (real-time operation) as shown in the Figure 1-1. Therefore, a system planner has to ac-commodate foreseeable challenges that can arise in mid-term and short-term time horizons, as planning decisions largely effect the management and operation of the system.
[image:11.595.82.557.370.626.2]In this report, we will focus on the functional analysis of system development and propose possible im-provements in the current practice of system development. However, in-depth analysis of asset man-agement, operational planning and real-time operation are out of the scope of WP4.
Figure 1-1: Activities of a TSO across three time scales and their relationship
1.1.1 Context: a paradigm shift
The electricity industry is in the midst of a comprehensive change: a paradigm shift of the ways we con-sume and generate electricity. Our increasing awareness about the environmental impact of electricity generation has contributed significantly to this paradigm shift. Consequently, in today‘s world, policies
and investments in the electricity industry should be consistent with societal commitments towards de-carbonisation and sustainability.
Renewable energy sources (RES) are location constrained. That is, renewable energy generation can only economically be sited in areas with strong natural resources. These resources are not distributed evenly across regions and are not correlated with areas of high load or areas where the existing grid is adequate. Accessing these resources may require significant transmission investment.
On one hand, we need to invest in the transmission resources to capitalize on RES, and on the other hand the existing transmission asset base may be expected to become increasingly redundant due to smarter grids, in particular the increasing use of corrective, i.e. post-fault actions, including modification of de-mand. The trade-off between potentially cheaper power from RES, lumpy investment costs to reach them and the cost of managing existing assets is at the heart of transmission expansion problem (TEP), and this is a problem that is extremely difficult to quantify. TEP is further exacerbated by some particular risks and uncertainties imposed by the liberalised market structure of present electricity industry, not least the division of responsibilities between different parties, e.g. generation development and network devel-opment, by increasing public opposition to development of overhead transmission lines and by growing political concerns about possible unreliability of electricity supply due at least in part to retirement of older generating plants. Finally, there is growing concern in public discourse that the global climate may already have led to changed weather patterns that involve greater extremes or more frequent storms. In Europe, there is increasing recognition of the interconnectedness of different regions and a desire on the part of policy makers to minimize total costs of electricity to consumers. This leads to greater market integration and a desire to make best use of the most economically efficient locations for development of different RES. However, success in achieving these goals depends on there being an appropriate amount of transmission network capacity. As a consequence, planners today must design network architectures for areas the size of continental Europe. The design of these new networks will determine the efficacy of expanding electricity markets and the ability to integrate high penetrations of renewable and other loca-tion-constrained generators.
1.1.2 Goal and drivers of system development
The main role of the system development planner is to ensure that sufficient facilities are installed on the system to enable it to be operated in accordance with relevant operating standards. In particular, the system development planner should ensure that the future system’s capability to transfer power from producer to consumer would be sufficient. Moreover, it should be done in such a way that the sum of network costs and the negative impact on social welfare is minimised. Because any insufficiency may require investment in the network’s facilities and such investment takes time – relevant equipment and its location should be identified, the functional requirements specified, and the equipment procured, installed and commissioned – the system development process is commonly identified with timescales of a year or more ahead of real-time operation. Thus, the process of system development is often described as ‘long-term planning’. However, it may be possible for some equipment, e.g. new control facilities such as special protection schemes or reactive compensation, identified by the system development planner to be specified, approved and installed in less than a year2. In addition, as noted by CIGRE Working Group
C1.17, “The [system development] planner [is] responsible not only for providing network capacity but
2 Even if, in a particular company, the system development planner does not directly specify and procure protection
also for providing a system operator with the means of managing the consequences of N-1 violations or combinations of outage events.”
In respect of facilitating system operation in accordance with operating standards, two main drivers may be noted:
• Provision of power transfer capability such that the demand for electricity in a given area can be met with a given, minimum level of reliability, i.e. ‘reliability driven’ capability;
• Provision of power transfer capability such that demand for electricity on the system can be met, over the medium to long term, in an economically efficient manner, i.e. ‘economics driven’ capability.
The second driver involves an assessment of relative costs and benefits of investment in enhancement of power transfer capability compared with network congestion and running of ‘out of merit’ generation. Viewed another way, because a lack of power transfer capability can lead to the opportunity for the exer-cise of market power by particular generators in liberalized markets, it can be seen as being concerned with facilitation of competition. To the extent that a price can be put on an inability to utilize low carbon generation due to power transfer limitations, it can also be seen as concerned with carbon reduction. From what is explained above, we can state that the core of system development is about making the right trade-off between investment i.e. capital expenditure (CAPEX), socio-economic welfare (that can be measured by the total generation cost obtained by the market dispatch3) and reliability (that can be
measured by the OPEX cost for preventive and curative measures and the total cost of unsupplied energy when it happens nonetheless). This is illustrated in Figure 1-2. For example, one could decide not to in-vest in cross-border grid capacities, but to nevertheless make more capacity available to the market. If the border in question was a limiting factor, this will result in an increase of the total socio-economic welfare (in general, a cheaper market dispatch), but depending on how reliability of supply is valued, the consequence may also be a degradation of the reliability of supply and an increase in the TSO’s operating costs.
The goal of system development is to assess as properly as possible each of the above-mentioned costs over a long time-period, and under a very large set of future credible operating conditions that model the relevant uncertainties, as explained in the next subsection.
3 As explained in D.4.1 and in the ENTSO-e Guideline for Cost Benefit Analysis of Grid Development projects, there
Figure 1-2: The triangular relation between grid investment, socio-economic welfare and reliability
1.2
Relevant uncertainties in system development context
In system development studies, one must take proper consideration of various uncertainties. We can divide these uncertainties in two major categories; macro-scenarios and micro-scenarios, and these are defined as follows:
• Macro-scenarios group all the uncertainties about how the “electricity system landscape will evolve between now and the studied time horizon”. Examples of such uncertainties are the evo-lution of fuel costs, CO2 prices, demand, installed capacities per production type in each country
or region, the level of local storage and demand response, the evolution of the regulatory frame-work, etc.
• Micro-scenarios group the uncertainties around the actual operating states that we might expect. For example, at macro-scenario level, we define how much wind generation capacity will be in-stalled in each country or region for example by 2030 and how growth of demand will happen. In order to define a micro-scenario, we have to generate credible time-series of wind power output and demand for each country or region in hourly or sub-hourly resolution.
1.3
Overview of WP4: System development
Figure 1-3: Organization of the tasks within the work package 4 of the GARPUR project
1.3.1 Task 4.1: Functional workflow of the system development decision making process
Figure 1-4: Top-level diagram of the long-term decision making process (Figure 3-2 in D4.1 [GARPUR 2015c])
An important point that is raised in D4.1. is as follows:
These results indicate that the TSOs are and have already been developing their tools and methods, so that many different scenarios are considered instead of worst-case analyses. This can be inter-preted as a small step towards using more probabilistic approaches, or at least acknowledging the potential excess cost of analysing worst-case scenarios only.
The above clearly states that what are assumed to represent the worst-case (e.g. snapshots of maximum demand) are not representative of the overall system behaviour and do not necessarily robustly indicate need for investment. For this reason, T4.2 of WP4 looks into finding representative credible operating states. D4.1 also insists on the importance of the use of high-level macro-scenarios in system develop-ment, as well as the role of market analysis. Both of these aspects have already been mentioned here and will be further discussed in chapter 3 of this report.
Initial assessment and Prioritisation
Set of scenarios
Asset management/WP5
Replacement policies
Continuously updating data and assumptions
Assessment and Project portfolio management
Set of prioritised projects
Construction decision project postponing
Set of candidate projects
1.3.2 Task 4.2: Bridging gaps in terms of data, models, and tools for dealing with uncertainties for further upgrading reliability management in system development
The main goal of the second task in WP4 (T4.2) is to define how to manage the different uncertainties that occur during future operational activities, notably how to synthesise them while maintaining the credibility of the assumptions and physical meaning including relevant temporal and spatial correlations between them. T4.2, jointly with T4.3, should also analyse how the concepts proposed by WP2 and WP3 could be put in practice in the context of system development.
1.3.3 Task 4.3: Upgrading reliability management of the system development decision making pro-cess
The third task in WP4 (T4.3) is about assessment of credible operating states that are proposed by the T4.2. The assessment methodology will identify possible need for investment in the infrastructure. This task also aims to find an acceptable balance between the reliability indicators defined in WP2, the socio-economic measures defined in WP3 and the tools, data and human resources that are likely to be availa-ble for the practical assessment and interpretation of a possibly very large number of crediavaila-ble future op-erating conditions. For the assessment part, Т4.3 depends on the provision of credible operating states coming out of T4.2. This is why a close cooperation and coordination between T4.2 and T4.3 was neces-sary.
It must be pointed out that reliability and socio-economic indicators are fundamental measures in a sys-tem development process in which investment decisions are made and, as such, a worst-case scenario approach is not appropriate for their calculation. Moreover, in spite of what might conventionally be as-sumed, the worst-case scenario might not be that associated with the maximum possible realisation of an uncertain parameter. That is, for example, a maximum demand condition is not necessarily most expen-sive and/or most un-reliable operating state. In addition, as shown later in this report, it has been identi-fied that snapshots cannot always be relied upon to be sufficient to represent realistically enough possi-ble future generation dispatches. Instead, time-series are necessary to simulate (approximate) market dispatch and account for generator ramp rates and so on.
1.3.4 Task 4.4 Recommendation for the formulation of new system development approaches and for validation and migration towards new reliability management
The last task of WP4, T4.4, ties everything together and makes recommendations towards a new system development standard. This task also proposes a migration pathway to enhance and incorporate the probabilistic reliability management methodology approaches in the TSO practices of System Develop-ment proposed in GARPUR.
1.4
Report Structure
2
RELIABILITY CRITERION AND ASSOCIATED SOCIO-ECONOMIC COSTS
The aim of WP4 of the GARPUR project is to study and improve the system development process in the context of the new reliability management approach and criterion (RMAC) that has been proposed by WP2, and the socio-economic impact assessment framework that has been proposed by WP3.
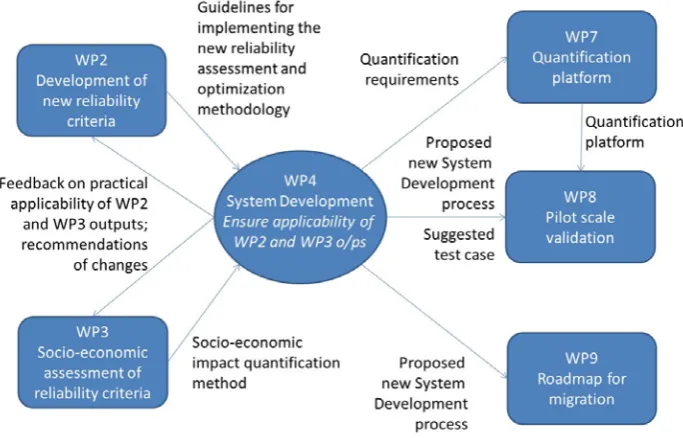
[image:18.595.108.450.246.465.2]Figure 2-1 gives an overview of the relationships of WP4 and other work packages of the GARPUR project. The definition of a new reliability criterion is an input from the WP2. Socio-economic metrics are also an inputs from WP3. The first aim of WP4 is to exploit these inputs in the context of system development.
Figure 2-1: WP4’s relationship with other WPs in GARPUR
The blocks on the right hand side of the Figure 2-1 show the expected outputs from the WP4. WP7 deals with setting up a quantification platform for simulation purposes and requires inputs for the system de-velopment process. These requirements have been formed and there is an on-going work in WP7 specific for long-term studies. WP8 is about validating models on real transmission networks. Work on this has been started and an agreement among the partners about the pilot test has been reached (see [GARPUR, 2016b]). Finally, WP9 of the GARPUR project proposes a roadmap for migration towards a new probabil-istic reliability criteria and this work package will rely on the output from WP4 for a new system devel-opment process.
In the following two subsections, we have tried to provide a brief summary of the work proposed by WP2 and WP3. For complete formulation and details about ideas from WP2 and WP3, please refer to the pub-lic deliverables available from these work packages [GARPUR, 2016a][GARPUR, 2016d][GARPUR, 2016e].
2.1
Development of new reliability criteria for the pan-European electric
power system
considered uncertain exogenous parameters, while ensuring that the residual risk of the discarded sce-narios, i.e. those not assessed explicitly or secured against, is below a pre-defined threshold. The objec-tive function is to minimize the total system cost throughout the considered time horizon. The proposed ingredients of an RMAC are as follows:
1. A metric of the total system cost, to be minimized. In WP3 terms, we could also say that the ag-gregated surplus has to be maximized, which, under certain assumptions, is similar.
2. A discarding principle that sets a threshold on the residual risk of discarded scenarios.
3. A reliability target that ensures that the system fulfils acceptability constraints with a high proba-bility, expressed through the application of chance-constrained optimisation.
The discarding principle aims at reducing the size of set of operating states and disturbances to analyse. It suggests that for a certain value of residual risk ∆E, we could identify a subset of scenarios for which the total residual risk is smaller than this value ∆E. The reduction of the size of the set of scenarios to be con-sidered will help in decreasing the computation time of the relevant objective function and facilitate the computational tractability of the optimization problem.
2.2
Socio-economic assessment of reliability criteria
The objective of WP3 is to develop a sound and general methodology for assessment of the socio-economic impact of different reliability management strategies. The socio-socio-economic impact assessment developed in WP3 aims at studying the difference of surplus between different reliability-related TSO decisions in multiple decision-making contexts, both aggregated and for different stakeholder groups separately [GARPUR, 2016e]. The socio-economic impact assessment is carried out for a system defined by:
2. The assessed market, i.e. the electricity market.
3. The included stakeholder groups, i.e. electricity consumers, electricity producers, the TSO, the government surplus from taxes on electricity and environmental surplus from electricity related externalities.
4. The geographical scope, i.e. the TSO area and neighbouring areas affected by the TSO decisions to the extent that the impact is significant. This geographical scope also needs to be defined in the pilot test.
Surplus is defined as the difference between the benefits and the costs to a stakeholder or the system under study. As the difference in surplus will be studied, only costs and benefits that significantly change between different decisions need to be included.
2.3
Assumptions used for shorter-term reliability management and
socio-economic assessment
utilisa-tion of corrective acutilisa-tions. For this reason, in WP4 we made following assumputilisa-tions for socio-economic assessment and for the modelling of the mid-term and short-term reliability management contexts.
• A market tool is used to measure and maximise the socio-economic welfare. This market tool is an extension of a traditional unit commitment problem and its objective function is to minimise the sum of the overall cost of generation and the cost of interruption of supply while satisfying demand and generation balance in each control zone and taking into account cross-border trans-fer capacities between control zones. It must be noted that the economic assessment process that uses the market tool is iterative and that the cross-border transfer capacities used between different market zones within the model and at the spatial outer limits of the model are normally those that comply with a specific reliability criterion (e.g. N-1).
• We use a deterministic (N-1) reliability criterion for the assessment of credible operating condi-tions. Notice that the real-time reliability management methods proposed by WP2 and further adapted in WP6 result in a dynamic contingency list, i.e. one in which the contingency list changes in a way dependent upon real-time conditions. In other words, the probabilistic RMAC developed in GARPUR can be thought of as an extension of the conventional (N-1) security criterion [GARPUR, 2016d] and, if we can perform our analysis with the (N-1) criterion, we will be capable of integrating this probabilistic RMAC in the proposed methodology at a later stage.
• The classic (N-1) criterion in system operation stipulates that the system should be capable of surviving a new, unplanned outage. The prevailing conditions faced by the system operator in re-al-time may include some prior outages such as planned outages for maintenance or construction or previous unplanned outages that have not yet been restored to service4. Broadly speaking, the
challenge for asset managers and operational planners is to schedule the planned outages such that the reliability of individual assets can be managed in the medium to long term and the sys-tem can be operated in accordance with the relevant syssys-tem operation criterion such as, at pre-sent, (N-1) unplanned outages [GARPUR, 2015a]. The challenge for the system development planner is to provide sufficient network capacity such that maintenance and construction outages can be facilitated and the system operated in accordance with the operating criterion.
• WP5 is concerned, among other things, with the development of a process for the scheduling of maintenance and construction outages [GARPUR, 2016c]. Ideally, in checking that such outages can be facilitated, the system development planner would use a proxy for this process. Until an appropriate proxy has been developed, WP4 uses a simple version of it for periods of the year in which planned outages would normally be scheduled, e.g. the so-called (N-1)-1 state where one outage is planned and the other is unplanned5.
• WP6 is concerned with the implementation of the GARPUR RMAC in the short-term operation planning and real-time operation contexts [GARPUR, 2016f]. Ideally, checking how well the sys-tem can be operated along a future horizon would imply the modelling of these shorter-term re-liability management contexts in the form of a suitable combination of proxies (e.g. Day-ahead and real-time ones). Until an appropriate proxy for these processes has been developed, WP4 us-es the N-1 criterion to check whether the system reliability in operation is ensured to a sufficient level.
4 In Britain, this requirement for the prevailing conditions to be secure against a further, unplanned outage is
some-times referred to as N’-1 where N’ denotes that there may be one or more prior outages on the system.
5 The significance of the distinction between the planned and unplanned outages is that the system operator
3
PROPOSED WORKFLOW FOR SYSTEM DEVELOPMENT ANALYSIS IN THE
GARPUR FRAMEWORK
In this chapter, we will present and describe the system development workflow that is proposed by WP4 in the GARPUR framework. The work carried out in WP2 of the project has proposed a probabilistic RMAC, which seeks to ensure that the system follows an acceptable trajectory, with a very high probabil-ity, for a subset of all possible scenarios. To select this subset we would need to perform a risk / cost as-sessment of all scenarios throughout the whole time-horizon in order to identify the subset to discard. Solving all the subsequent asset management, operational planning and real time operations problems in order to assess system development candidate decisions are beyond the scope of WP4, especially on a large system like the European electricity grid. What is proposed here is nonetheless intended to take some pragmatic account of these considerations.
3.1
General overview
In this section, we give a general overview of the proposed approach for system development. Each step in our proposal is explained in detail in the subsequent sections of this chapter.
Our step-by-step approach to system development consists of following 9 steps: 1. Select a target year for system development studies.
2. Using existing macro-scenarios, identify peaks of various parameters like demand, RES penetra-tion, and fuel prices.
3. Construct micro-scenarios that specify hourly profiles of demand, RES and maintenance of assets for the specific year.
4. Using micro-scenarios as an input for the market tool, identify the commitment of thermal gen-erators in accordance with prevailing market rules but otherwise unconstrained by the network’s capacity.
5. Perform zonal to nodal conversion for demand on the operating states determined by the market tool, and build a very large set of representative operating states for the target year.
6. Reduce the size of the large set of credible operating states using an appropriate clustering method.
7. Optionally, perform an initial screening of centroids of each cluster thereby allowing (a) the num-ber of cases to be studied in detail to be further reduced and, depending on the screening meth-od used, (b) to identify system problems that are common to more than one cluster.
8. Through detailed assessment on the centroids of clusters, provide insights to the system planner of system weaknesses and possible mitigations.
9. Allow the analysis of different system development options proposed by the system development planner and the quantification of metrics that can contribute to investment decision-making. The step-by-step approach means that not all subsequent asset management, operational planning and real time operations are explored. Instead, the system development planner can use the results in Steps 8 and 9 to consider repetition of any part of the process.
building a set of investment decisions and not to look at the years leading up to or extending beyond the target year. However, in due course we propose to assess the impact of our investment decisions for all years leading up to the target year. The main motivation behind selecting a target year at the end of the considered time horizon is that the macro scenarios will show the most diversity and the investment choices made by reference to such point are more likely to be robust to various realisations of uncertain-ties. However, an optimal decision for a target year is likely to be suboptimal when transition from now to the target year is considered. For this reason, we propose to build a set of feasible solutions for the target year, and test each feasible solution for the transition in respect of its socio-economic performance and robustness6. In addition, the latest year in which any solution should be committed to in order to achieve
a robust target year outcome is identified. Although each solution may have been designed having in mind conditions in particular years of one or more macro-scenarios, an important feature of each possi-ble solution is the way it can adapted to system conditions that are different to those for which it was designed. The main outcome is the set of investments that should be taken forward and further devel-oped in the next year from now with other solutions that are part of the most robust set being retained as options until further information is gained on the key uncertainties influencing decisions.
The system development process is started by using existing macro-scenarios for demand and RES pene-tration in the target year7. Next we use this information, along with historical data to build a credible set
of micro-scenarios that might arise for that macro-scenario in that year. By default, these scenarios are in hourly resolution and give information about aggregated load (in each zone). The micro-scenarios are used as an input for the market tool. The market tool is a proxy for modelling the behaviour of the whole-sale electricity market. The output from the market tool is the commitment and initial dispatch of the thermal generators and also the cross-TSO transfers. We perform zonal to nodal conversion on the out-put from the market model. This zonal to nodal conversion results in an increase in the number of operat-ing states because of the fact that an aggregate sum can be obtained by various combinations. We cluster the large set of credible operating states into representative clusters. A screening process can be run on the centroid of the clusters to find clusters that lead to line over loadings. We deduce that these clusters need further analysis to determine the type and reason for the overloads. We further analyse the prob-lematic clusters in detail in the subsequent assessment step. This assessment step determines the critical operating states of the system for which future investment might be required. Such critical operating states are then passed on to the system planner who can propose investment candidates.
Figure 3-1 gives a general overview of the proposed system development workflow. At the end, for each investment candidate, we will have an investment cost, total reliability cost and a given impact on socio-economic performance during the target year. These three inputs will allow us to choose the best grid reinforcement option for a target year.
We note that the best grid reinforcement option for a target year might not be a best option when inte-grated over the years leading up to the target year. To address this issue, as outlined above, we propose that a set of investment options are constructed for the target year and these options are assessed using the same methodology proposed year for the years leading up to the target year.
6 Robustness can be quantified in a number of different ways. For example, given a number of discrete
macro-scenarios, the most robust solution could be regarded as that for which the difference between socio-economic impact in the worst scenario for that solution and the best scenario for that solution is smallest, i.e. the most robust solution is that with the smallest maximum regret. Consideration of such criteria is the subject of future work.
7 The formation of macro-scenarios is a major subject in itself. Because any existing process for forming them is
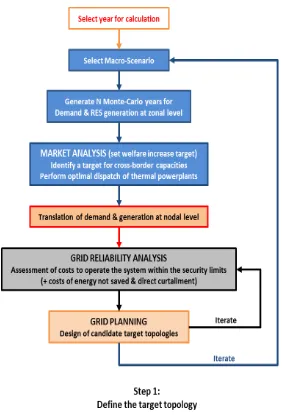
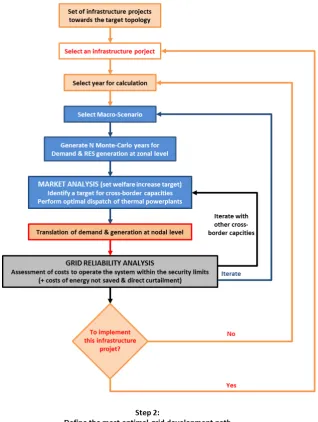
In order to define the best transition from a given reference topology, e.g. the present day system, to-wards the target topology, the timing, i.e. date of commissioning, of each member of the set of infra-structure projects should be identified. For this, the step-by-step approach presented here can be re-used on the whole time horizon (from now to target years). For each year and for each macro-scenario, the ‘best’ trade-off between operating costs and generation dispatch improvement must be considered in order to decide when to implement steps towards the target topology. The global overview is shown in Figure 3-2 and Figure 3-3. However, the process by which this ‘best’ trade-off and the timings of individu-al investments are decided such that risks of under- or late investment, excessive cost to meet a given need and stranded assets (investment to meet an anticipated need that did not materialise) are ade-quately balanced is the subject of a future work.
Figure 3-3: Global overview of decision-making process for system development
3.2
Macro-scenarios
Figure 3-4: Illustration of the ENSTO-e macro-scenario approach to cover uncertainties towards 2030 The scenarios used as an input of the methodology are based on a set of exploratory macro-hypotheses. Thus, by definition, a scenario will not be either more probable or more preferred than another. Each scenario provides a possible picture of the future based on a macro-hypothesis. A macro-hypothesis re-sults from the choice about possible energy policies of countries, for example, support for energy effi-ciency, deployment of electric vehicles and even the use of demand side management, etc., and postula-tions of economic growth and use of electrical energy. Thus, each scenario includes for each country the expected overall demand, installed capacity and the costs of different generation sources and the CO2
price in accordance with to the macro-hypothesis considered. The macro-hypothesis projections and the scenario creation are out of scope for the GARPUR project.
3.3
Generation of micro-scenarios
In the second step of our approach, we try to capture the operational uncertainties around the actual operating states that we might expect. These are constrained by the maximum demand and the location and capacities of generation defined by a given macro-scenario, but there can be many combinations of operating states within those constraints. Historically, grid development is based on the extreme values of the demand of a country; however, due to the development of RES and interconnections between countries, there is no longer any certainty that this state is really the worst state the system will face. Moreover, a worst-case scenario is not an acceptable approach if we want to quantify the expected costs related to reliability management or the likely year-round economic impact of different macro-scenarios and grid developments. For these purposes, it is necessary to generate more credible time-series that capture the full range of variability of load and RES generation patterns and their correlations.
Based on the available historical data, e.g. demand, generator availability and availability of power from renewable energy sources, we generate time-series that are used to describe the real-time operation of the power system. These time series are generated with an hourly time step over a period of one year and for each area of the modelled power system. The number of time-series is increased by applying planned outages for generation and transmission system assets.
3.4
Market tool
Once all the micro-scenarios are defined, we need to determine which generators will be brought online to meet the expected demand. This depends on the behaviour of the wholesale electricity market and its preference for the type of generation. We use a market tool as a proxy for modelling the electricity mar-ket's preference for generation. A time-series of one year can be used as an input for this market tool. Using a time-series for a whole year is intended to give more realistic results especially considering the seasonal changes which are important for certain generation types e.g. hydro, pumped storage etc. The objective function of this model is to minimize the overall cost of electricity generation whilst meeting demand in each zone, respecting, if they are specified, cross border transmission constraints, constraints on generation e.g. ramp rates, min-up and down times etc., and maintenance of a given level of reserve in each zone.
The market tool receives as an input the techno-economic characteristics of the production units (start-up cost, installed power, ramp-(start-up and ramp-down time, minimum power, etc.) and the fuel costs. These data are specified in each studied macro-scenario. Besides generation dispatch, the market tool provides as output the cost for producing and consuming electricity in each bidding area, either per generating unit or in terms of zonal marginal prices.
The market tool is solved for each time-series constructed in the previous step. The output of the model is the set-point of all the available generators and cross border flows. However, at this stage – which rep-resents the market’s behaviour before any intervention by a system operator – the transmission limits within a region do not constrain the dispatch of generation. In cases where a market solution violates transmission constraints and/or reliability constraints, an intervention from a system operator is required to make a market proposed solution a secure operating solution.
3.5
Translation from zonal to nodal data
Figure 3-5: 24 hour recorded demand profiles (15-minute resolution) of 8 different loads (representing different types of customers) for the third Wednesday of January,
in three subsequent years
Up to this stage of the methodology for synthesis of credible operating states, time-series were crucial in order to get credible generation dispatch. The generation set points have been obtained from the market model which used, as inputs, time-series of demand and power available from RES based on historic ob-servations, and the relevant unit commitment constraints for other generators. However, if time-series have to be sampled for each year for each load and for each RES generation, e.g. for use in a Monte Carlo assessment of system operation risks and costs of system operator interventions, the possible number trajectories grows exponentially and become unmanageable. However, for zonal to nodal conversion of demand and RES and the further analysis, we propose to use snapshots, instead of time-series.
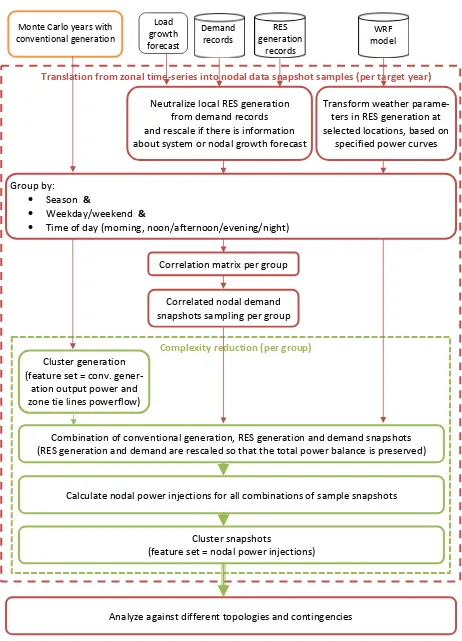
For the top-down approach, a few options for translating from zonal to nodal snapshots are available. Current practices used in system planning most often use operating states from benchmark recorded days (or snapshots) of the total system load, which are scaled proportionally to the forecasted total sys-tem load growth. Then, the first option is to use constant shift keys (representing proportions of each load from the total system load) to distribute the total load proportionally for all the benchmark snap-shots. The second option is to use a set of limited number of shift keys. These two options are very simple and are often used as of today. However, as can be seen in Figure 3-5, this might not be enough to cap-ture either the variability of the system at all time, or the uncertainties in the long term horizon. Task 4.2 aimed at improving the process by introducing a third option – sampling snapshots of demand and RES generation. Actually sampling a big enough number of snapshots is the main strategy to cope with the big uncertainties (in terms of load and RES generation snapshots) in the long-term context of work package 4. Figure 3-6 summarizes the whole algorithm. At a zonal analysis level, different patterns of availability of schedulable generation, i.e. not weather-dependent, highly variable RES, can be modelled in a Monte-Carlo simulation of different years giving a number of “Monte-Monte-Carlo years” (a concept described in [e-Highway, 2012]). The corresponding credible generation dispatch time-series are treated as an input to the algorithm, as well as available demand, RES generation records and load growth forecast. There are well-developed tools like the Weather Research and Forecasting (WRF) model (described in Section 6.2)
0 2 4 6 8 10 12 14 16 18 20 22
which can be used to sample weather parameters at specified locations and account for the spatial-temporal correlations. It is well understood that demand is also correlated with weather but it is also influenced by other factors such as time of day, day of the week, whether the day is a public holiday and time of the year. In the longer term, demand is also influenced by changes to the kinds of electrical equipment used by energy users and patterns of use within the wider economy.
It is important to note that the approach used in the e-Highways project [e-Highways, 2012] for zonal to nodal conversion make use of constant shift-keys for zonal to nodal conversion. Therefore, what we pro-pose here for zonal to nodal conversion is an extension of the e-Highways approach.
The algorithm starts with a pre-processing stage comprising of the standard statistical procedures for data cleaning and data validation. It should be noted, though, that because a lot of RES generation is be-ing installed in the distribution grid, its output needs to be subtracted from the demand records for each node in order to capture the different trends between load and RES generation. Then, before the actual sampling, we propose that in order to capture better the correlations, nodal demand records should be grouped by season, weekend/weekday, and time of day (morning/noon/afternoon/evening/night). For consistency, the rest of the data (the conventional and RES generation) should also be grouped in the same way.
Figure 3-6: Algorithm for translation of zonal to nodal data Monte Carlo years with
conventional generation generation RES
records Demand
records model WRF
Translation from zonal time-series into nodal data snapshot samples (per target year)
Neutralize local RES generation from demand records and rescale if there is information about system or nodal growth forecast
Transform weather parame-ters in RES generation at selected locations, based on
specified power curves
Group by:
• Season &
• Weekday/weekend &
• Time of day (morning, noon/afternoon/evening/night)
Correlation matrix per group
Correlated nodal demand snapshots sampling per group
Combination of conventional generation, RES generation and demand snapshots (RES generation and demand are rescaled so that the total power balance is preserved)
Cluster generation (feature set = conv.
gener-ation output power and zone tie lines powerflow)
Calculate nodal power injections for all combinations of sample snapshots
Cluster snapshots
(feature set = nodal power injections)
Analyze against different topologies and contingencies Complexity reduction (per group)
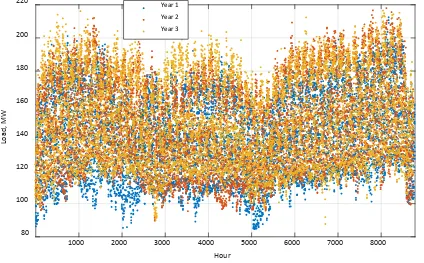
Figure 3-7: The total load of three subsequent years of records (1 hour resolution) of an example zone, comprising of the 8 different loads from Figure 3-4
3.6
Clustering
The previous section explained that the translation from zonal to nodal loads can be performed by gener-ating a large enough number of correlated samples of loads (each representing snapshots and not time-series but, by virtue of zonal totals being correct, still consistent with unit commitment time time-series). Fig-ure 3-7 shows the total load of three subsequent years of records (1-hour resolution) of an example zone, comprising of the 8 different loads from Figure 3-5. The similar demand values in the similar seasons and times of the day, in the process of translation from zonal to nodal loads, will result in similar sets of corre-lated samples. In line with the concepts developed in WP2 of GARPUR, a large number of operating states can be discarded (in order to avoid having to analyse them in detail) without any significant impact on the risk assessment.
Reference [Kile, 2014] has demonstrated that clustering can be applied to group similar operating states and calculate reliability indices with good precision by analysing only the cluster centroids instead of all samples (i.e. sampled snapshots). Thus, clustering can be regarded as a complexity reduction technique. In other words, similar operating states will not be analysed in detail twice.
The required minimum number of samples is determined by the variance of the sampled values and needs to be high enough to capture extremes (as already discussed). Because the sampling (in the con-text of this report) is correlated, if the number of samples is increased, most of the new samples are ex-pected to fall into the regions of already defined clusters (i.e. of the most probable operating states). Thus, although the number of samples may, for example, be doubled, the number of clusters will be somewhat less than doubled. Only the centroids of clusters are subject to the computationally demand-ing task of analysis of the operatdemand-ing states. The sampldemand-ing itself is not computationally demanddemand-ing. As a consequence, this approach makes it feasible to increase the number of samples without unduly increas-ing the total computational burden.
1000 2000 3000 4000 5000 6000 7000 8000
Hour
80 100 120 140 160 180 200 220
Load, MW
For more details on clustering itself and discussion on its application in work package 4 please refer to section 6.4 . Here will be briefly presented its general place in the algorithm from Figure 3-6.
The clustering can be performed in two stages. They both aim at reducing the number of snapshots that needs to be further analysed. The first one, however, is optional. It is aimed at identifying similar genera-tion patterns because intrinsically generagenera-tion dispatch is a funcgenera-tion of the total system load (and of course subject to technical constraints of the grid, but this is usually not considered in the market tools). However, the same total system load can be realized with different combination of nodal demand and because of that the clustering of the conventional generation dispatch can be treated separately from the nodal demand samples. It is most appropriate to use conventional generation output power and inter-zone power transfers as a feature set for such clustering.
The next step is to create combinations of the sampled load and RES generation and the conventional generation (either clustered in the previous step or the whole set). Then, for each combination the nodal power injections are calculated and they are used as a feature set for the second stage – clustering of the operating states (snapshots) with nodal “resolution”. The result is a reduced set of credible operating states that are realistic and representative of the future power system (of course, under the initial scenar-io suggestscenar-ions).
Any changes in the network topology (for example due to maintenance) can be treated as events im-posed on the combined generation and demand states afterwards. It should be noted, though, that the clustering is done for each group of season, weekday/weekend and time of the day. In this way partial temporal information is preserved for the snapshots, which in turn can be used, for example, in a maintenance proxy.
3.7
Assessment of the credible operating states
In this section, we propose a modelling framework for assessment of a large set of credible operating states. The assessment procedure forms the basis of the analysis that is performed in a system develop-ment activity. The assessdevelop-ment process will provide a system planner with necessary evidence for the need of investment and will also give insights into what to invest in.
In the following subsections, we discuss the inputs that are required for the assessment procedure, mod-elling framework and also the outputs from the proposed process.
3.7.1 Inputs required for assessment methodology
In the following, we list required inputs for our proposed assessment procedure.
3.7.1.1 A set of credible operating states
Figure 3-8: Components of an operating state
A set of credible operating states is required for our assessment process. The assessment can be carried out on snapshots or on time series of daily profiles. The proposed methodology is a proxy for short-term operational planning and therefore the time-series analysis need not look across more than a 24-hour time horizon. However, although a 24-hour cycle is common for scheduling of generation, it starts from some knowledge or suppositions of generators’ states at the end of a previous 24-hour period and acknowledges that units can continue beyond the end of the new one. Thus, in order to avoid ‘end ef-fects’ in unit commitment, a few additional hours at the beginning and end of a period might be mod-elled. In the market tool in the illustrative test case described below, we used time-series of one year and the generation set-points are obtained such that they respect temporal constraints such as ramp-rates and min up and down time constraints. Moreover, the clustering is carried out on each interval within the time series, i.e. on snapshots, with the network adequacy assessment process carried out once for each similar snapshot.
3.7.1.2 A proxy for asset management
As was discussed in section 2.1, to assess a credible operating state we need to take account of the maintenance of assets. Note that here we are only concerned with the planned outages (e.g. time-based maintenance, condition-based maintenance, …) of transmission components. Planned outages of genera-tion have already been taken into account while building the set of credible operating states. Unplanned outages will be managed through a contingency list.
Two broad approaches are possible in respect of the treatment of planned outages of transmission as-sets:
2. to assess the maintainability of the network while still being secure against contingencies (unplanned outages), i.e. to determine if there is margin for planned or inspection triggered outages to be taken on top of the envisaged ’maintenance-less’ scenarios.
In approach 1, planned outages of assets may be sampled randomly for a given target year subject to some high level constraints. Past records and information about the evolution of maintenance practices are inputs to create assumptions about the timing and duration of planned outages. For example, the expected time and frequency of tower painting can be extracted from past records to form a base set of assumptions. However, it is also possible that particular maintenance tasks can be carried out more quickly in future or are needed less frequently. If judged to be credible, such changes would be repre-sented in the set of input assumptions.
Relative to an aim to assess the feasibility of days of operation, it may be noted that planned outages typically last longer than a day. Thus, for a given day being assessed, a particular planned outage is either present or absent. It seems justified that not all sampled maintenance plans, i.e. sampled combinations of planned outages, will be acceptable as the grid should not be designed to accept maintenance even in the worst context. For example, outages are typically scheduled to take place when power flows are relatively low. This may be correlated with low demand or, for exporting areas, the anticipated unavailability or low merit of generators in that area. As a proxy of the outage planning process with which WP5 is concerned, the system development planner might do one of the following:
• ensure a certain level of maintainability of the network, expressed through the requirement that a given, minimum proportion of sampled maintenance patterns must be ‘operable’ in respect of the system being able to meet all demand under those conditions; or
• define a set of conditions of context (e.g. low load, no output from renewables, …) in which all sampled maintenance should fit while still meeting all demand.
Finally, normally, only a certain, maximum number of outages can be accommodated simultaneously in a particular area. This limit arises for one of two reasons: the maintenance crew, i.e. the human resource carrying out the work, only has a certain capacity; or the network capacity is such that the system cannot be operated in accordance with the reliability criteria relevant to system operation if there are too many planned outages. If asset management issues require a higher number of outages to be taken in the same area at the same time, grid reinforcement and/or enhancement of maintenance crew staffing levels may be triggered (provided it is economically justified).


![Figure 1-4: Top-level diagram of the long-term decision making process (Figure 3-2 in D4.1 [GARPUR 2015c])](https://thumb-us.123doks.com/thumbv2/123dok_us/1565310.109124/16.595.85.474.101.548/figure-level-diagram-decision-making-process-figure-garpur.webp)