Abstract—This paper presents improvements to frequency-tracking P-class and M-class Phasor Measurement Unit (PMU) algorithms. The performance of these algorithms is tested in simulation against the reference (Basic) algorithms from the C37.118 standard, using the formal test procedures specified in that standard. The measurements of Total Vector Error (TVE), frequency and rate-of-change-of-frequency (ROCOF) are all investigated for compliance. Generally, Total Vector Error (TVE) is found to be compliant for all algorithms. By contrast there are significant excursions for frequency and rate-of-change-of-frequency (ROCOF) measurements. More extreme non-standard tests are also applied, involving multiple simultaneous interferences. The proposed algorithms exhibit improvements in frequency and ROCOF accuracy, with errors reduced by factors of up to 150 compared to the Basic algorithms. A Hybrid P/M class PMU is proposed and demonstrated, offering P-class response to dynamic steps but M-class steady-state accuracy. However, setting usable trigger thresholds for this device requires a thorough investigation of interharmonic effects on P-class PMUs. This investigation poses more questions than it answers, leading to a questioning of the validity of any frequency or ROCOF measurement from any P-class PMU.
Index Terms-- Power system measurements, Fourier transforms, Frequency measurement, Phase estimation, Power system harmonics, Power system interharmonics, Power conversion harmonics, Industrial power system harmonics, Power system stability, Power system state estimation, Power system parameter estimation.
I. NOMENCLATURE
ADC Analogue to Digital Converter
f frequency (actual) (Hz)
f0 nominal frequency (Hz)
FADC Sample rate of the ADCs, and computational frame rate
FS reporting rate (Hz)
h frequency of an interharmonic divided by the fundamental frequency
k k-factor describing the level a short-term (inter)harmonic may reach, relative to its long-term allowed value Ф phase (rad)
N A general (greater-than-zero) integer value OOB Out-Of-Band
RCT Ripple Control Transmitter
A. J. Roscoe is with the University of Strathclyde, Glasgow, G1 1XW, UK. (phone: +44 (0)141 548 2715; fax +44 (0)141 548 4872; e-mail: [email protected]).
Exploring the relative performance of
frequency-tracking and fixed-filter Phasor
Measurement Unit algorithms under C37.118
test procedures, the effects of interharmonics,
and initial attempts at merging P class response
with M class filtering.
This is a postprint of a paper submitted to and accepted for publication in IEEE Transactions on Instrumentation and ROCOF Rate of change of frequency (Hz/s)
t time (s)
τ time constant (s) for P-class trigger detection filter
II. INTRODUCTION
HE most recent version of the Phasor Measurement Unit (PMU) standard IEEE C37.118 was published in 2011. It is split
into two parts: IEEE C37.118.1 (Measurements)[1] and IEEE C37.118.2 (Data Transfer)[2]. This lays down strict
requirements for the required response to dynamic events, and harmonic signal content. The required TVE (Total Vector Error)
accuracy is still 1%, although 0.4% is desirable [3]. It also specifies accuracy requirements for frequency and ROCOF (rate of
change of frequency) measurements. The relationships between measurement windows, reported timestamps, and latency are all
described. Furthermore, a “Basic synchrophasor estimation” algorithm is provided [4], with the implication that it will be
compliant if implemented correctly, although some of the required accuracy limits within C37.118 are under review, particularly
some of the frequency and ROCOF values. Within the last 10 years, there have been a number of alternative algorithms proposed
which might be used to gain compliance with the earlier PMU standards such as C37.118 (2005) [5] or with the latest standard.
The algorithms proposed in this paper track the frequency so that the filter performance is always optimised for the measured
signal, as the actual frequency varies in real-time. In the proposed algorithms, the ADC sample rate is kept constant, and the
digital filters are adjusted in real time. Some commercial digital relays and power quality meters achieve similar effects by
adjusting the sample rate of the entire ADC and digital signal processing chain, but keep the digital filter weights the same. There
are obstacles to the successful creation of such frequency-tracking devices. Firstly, the creation of loops which track frequency
can lead to difficulties with stability and oscillation/ringing following disturbances. In the proposed algorithm the problems need
to be solved by careful attention to detail within the algorithm software. For devices which modify their ADC sample rates, the
design of the hardware or software which adjusts the sample rate needs to be carefully considered. Secondly, there is a
perception that creating digital filters which can adapt in real time requires a level of computational power which is not available
[6].
Consequently, the focus of recent literature has been on pre and post-processing methods for fixed-sample-rate algorithms
surrounding a core DFT (or similar) analysis with a fixed number of samples. The Basic algorithm in C37.118 is a typical
example [7, 8]. In particular the effects of off-nominal frequency on DFT algorithms has been analysed in [9]. That paper also
analysed the application of post-processing interpolation (the “iDFT”) as a method to reduce the spectral leakage for
off-nominal frequency applications. It is found that TVE errors can rise appreciably when frequency is off-off-nominal, in particular
when harmonics or other disturbances are applied. A more complex algorithm using the “Taylor Fourier Transform” (TFT)
modification of the FFT and pre-computed matrices to allow the production of 2nd-order taylor expansion representations of the
phasor as it changes in real time, due to off-nominal frequency, unbalance, and frequency ramps etc. This helps to flatten the
effective filter passband and increases the depth of the attenuation at (specifically) the –f0 frequency, therefore increasing
accuracy and reducing ripple at off-nominal frequencies. The technique has even been extended to examine multiple harmonics
and to attempt to produce latency-less results via addition of Kalman filtering [12]. However, it is noted in that paper that such
techniques can be susceptible to noise and harmonics (and presumably also interharmonics), unless the interfering signals are
specifically included within the model created by the “TKK” filters. A simpler implementation which uses a standard DFT core
(with post-processing), plus a Taylor expansion of the cycle-by-cycle results, is presented in [13]. All of those methods, at the
core, include transforms, filters and state-equations which are fixed at the nominal frequency, but which attempt to cope with
off-nominal conditions across a given range. Therefore, for these methods, there remains the uncertainty of how well (or badly)
multiple harmonics or interharmonics may be rejected by the algorithm when frequency is off-nominal. Computational effort for
those methods is comparable with similar-length FFT algorithms.
In contrast, the method(s) proposed in this paper include a frequency-tracking loop and use adaptive filters which are
modified in real-time so that the core Fourier transform and filtering is optimised to the actual fundamental frequency. Such
algorithms can operate over a range of, for example, 40 Hz to 70 Hz with almost no loss of accuracy, maintaining the ability to
filter harmonics across the entire operating frequency range. This can be extremely useful within smaller power networks where
it is not unknown for frequency to drop from 50 Hz to 45 Hz several times per year, and occasionally to 42 Hz.
The methods proposed in this paper have evolved from a relatively simple adaptive P-class device [14] which was then
enhanced by addressing the specific requirements for M-class PMUs. In particular the M class PMUs have requirements to filter
low-frequency out-of-band (OOB) interharmonic signals, and harmonics at levels of 10%. The P and M class PMUs also have
requirements to produce measures of frequency and ROCOF with low noise under these kinds of influence. The algorithms were
improved and expanded in [15] to include general adaptive designs for P and M class devices, with overall execution times of the
order of 40µs, supporting sample rates of FADC up to 10kHz. Since the entire algorithm can be executed every 40µs, the PMU
itself can produce report data at the full 10kHz data rate, with successive reports analysing data sampled over a continuously
rolling time window. Communication bandwidth limits would probably preclude the actual transmission of formal reports at this
rate, and down-sampling to the reporting rates suggested in [1] will normally occur before transmission.
Most recently, the proposed adaptive M-class filters were presented at the IEEE AMPS conference and it was noted that the
proposed M class design is actually composed of a P class PMU at its core, augmented with additional filtering. This raised the
This is a postprint of a paper submitted to and accepted for publication in IEEE Transactions on Instrumentation and
class PMU with a faster response time?”. Such an approach might have merits from a PMU user’s point of view. This is because
while [1] clearly differentiates between P and M-class devices, there is little indication in [1] of the accuracy of either when
exposed to real power network conditions involving multiple harmonics coexisting with ROCOF events and other (changing)
power quality phenomena. Therefore, from a user’s perspective, the priority may be focussed on simply taking the best
measurement possible with the most appropriate response time. In steady state, this would be an M class device with enhanced
filtering. During transient events, a P class device would be more appropriate. Installation of P and M class devices in parallel,
with selection of the appropriate result at the PDC (for example) was discussed but deemed to be less appealing than a single
PMU which could adjust its functionality automatically. The work described in this paper set out to try and create such a
“Hybrid” PMU.
However, to do this first required the development of a formal test environment, in simulation, to allow PMU performance
assessment exactly as specified in C37.118. This paper for the first time (in the public domain) presents a full assessment of both
the proposed and the Basic PMU algorithms against the standard. In particular, while existing literature tends to focus on TVE
compliance, this paper (for the first time) presents a thorough analysis of the TVE, frequency and ROCOF measurement
performance across all the formal C37.118 tests. Where frequency and ROCOF are concerned, the Basic algorithm is not found
to be compliant with all tests. OOB test results have usually been omitted from previous works, while in this paper the OOB test
is in fact found to present some of the biggest obstacles to compliance. The initial results from this more formal testing raised a
number of small but important issues with the algorithms originally presented in [15], and this paper presents the improvements
which have therefore been made. For example, it has been found that additional filtering can be inserted within the main M class
filter path, and within the frequency and ROCOF measurement paths for both P and M class devices (relative to [15]) while still
remaining compliant with formal C37.118 response requirements, and reducing errors on the respective measurements.
Next, the challenge was to determine suitable triggering thresholds and mechanisms which could be used to detect a transient
and trigger P-class operation. This leads to a difficult analysis of interharmonics which are not well regulated by standards. A
new “mini-review” of these is presented here. Finally, it is possible to create and test a new self-switching Hybrid M/P class
algorithm which is functional and meets the standard. However, substantial issues remain surrounding interharmonics, their
dramatic effect on frequency and ROCOF accuracy from any P class device, and their effect on false triggering of P class
operation for the Hybrid algorithm presented.
III. DESCRIPTION OF THE PROPOSED ALGORITHMS
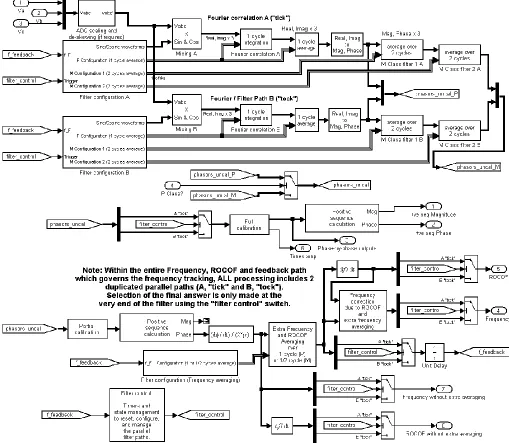
In [15], four algorithms using frequency-tracking filters were presented; 2 styles each of P-class and M-class. The 2 styles
exact-time-averaging “boxcar” filters [13] so that the filter notches always fall at the unwanted harmonic frequencies [16]. An
overview is shown in Fig. 1. The M-class filters are produced using the P-class filter as a base, augmented with 2 further
(longer) cascaded “boxcar” filters which also adapt to the real-time frequency f. These place additional notches at sub-harmonic
frequencies (and every integer multiple of them) to provide the required OOB attenuation. The convolution of the 4 cascaded
“boxcar” filters also provides general attenuation of higher-frequency interharmonics/noise, and guarantees 4 coincident zeros
(notches) at every harmonic Nf. The 2 M-class filter stages, involving long “boxcar” filters, are applied after a conversion from
Real/Imaginary to Magnitude/Phase pairs. This significantly reduces the problems of filter attenuation and phase wrapping
within the long filters, and means that the flatness of the overall filter near 0 Hz (where the fundamental falls) is essentially as flat
as the 2-cycle P-class filter [15]. This technique mirrors one proposed in [13] where “in polar coordinates … perfectly
compensates for the magnitude contraction effect during offnominal frequency operation” except that in the proposed
frequency-tracking algorithms and filters, the use of polar coordinates within the M-class filter not only minimises the
wanted-signal attenuation during off-nominal frequency, but also during frequency ramps with high ROCOF [15] when the measured
signal has a significant frequency “chirp” effect. However, in the proposed case the mathematics is not complicated and no
matrices need to be pre-computed. For simplicity, in this paper the focus is on the P-class algorithm (with reporting rate
FS=50 Hz), and the M-class algorithm also with FS=50 Hz. Techniques to design slower-reporting M-class algorithms with
longer filters were given in [15].
The Asymmetric versions of the algorithms used a single filter path which constantly adapted in real-time. This resulted in
asymmetric filters during frequency ramps, although a technique was developed to determine an accurate timestamp during such
events. This version of the algorithm provided very good reduction of noise and harmonics in the frequency and ROCOF
outputs. However, in [15], some ringing of frequency and ROCOF outputs was noticed following transients or the start/end of
frequency ramps. When subjected to the more formal testing described in section IV. , it is found that the Asymmetric
algorithms are not compliant with frequency and ROCOF requirements during the dynamic phase step and frequency ramp test
(specifically at the beginning and end of the ramp). Therefore, in this paper the TickTock algorithm is exclusively pursued
further. Again, when subjected to the more formal testing described in section IV. , more is learnt about this algorithm than [15]
This is a postprint of a paper submitted to and accepted for publication in IEEE Transactions on Instrumentation and Fig. 1. Architecture of proposed “TickTock” P and M class PMU algorithms, with reporting rate FS=50 Hz
A. Extension of M-class filter length
In [15], a 5-cycle long filter was recommended for the M-class PMU with FS=50 Hz, but it was suggested that if a 6-cycle
filter could be used without violation of response, it would be beneficial for OOB and interharmonic rejection. In fact, formal
testing in this new paper reveals that this is possible, and so in this paper the M-class PMU with FS=50 Hz design is changed so
that it now has a core 4-stage filter set which is 6 cycles long. This is made up of the “1+1” cycle average filters in Cartesian
coordinates (the P-class filter), followed by the conversion to Polar coordinates, followed by a further cascade of “2+2” cycle
average filters. Although the effective filter weights themselves are never calculated as part of the actual algorithm, they can be
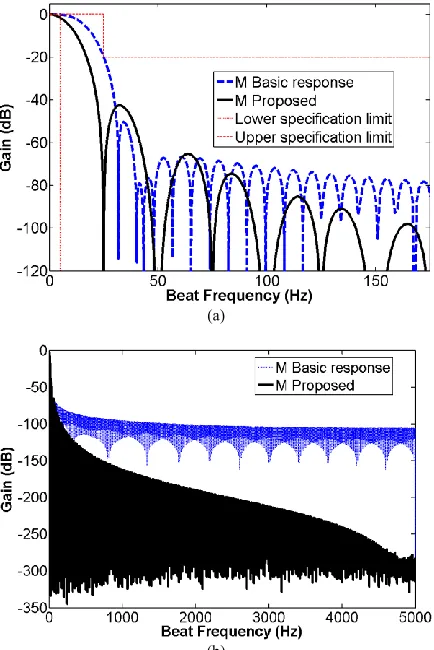
examined in MATLAB®. In Fig. 2, the M-class filter shape is compared to the “Brick-Wall” filter of the Basic algorithm from
C37.118. The amplitude response of the filters (to unwanted signals) is shown in Fig. 3, except note that the flatness of the
implementation of the long filter sections. Due to the frequency-tracking nature of the proposed design, and the Polar operation,
the filter does not need to have the same flatness as the Basic filter near 0 Hz. This allows more degrees of freedom to be applied
to optimise the rejection qualities, and Fig. 3 shows how the attenuation of signal harmonics and high-frequency
inter-harmonics and noise is much greater with the proposed filter than the Basic filter. The notches shown for the proposed filter will
[image:7.612.194.417.188.337.2]also move to frequencies of Nf in real time to track the actual frequency.
Fig. 2. Comparison of the Filter weights of the Basic and Proposed M class algorithms with reporting rate FS=50 Hz and FADC=10kHz
(a)
(b)
[image:7.612.198.415.368.693.2]This is a postprint of a paper submitted to and accepted for publication in IEEE Transactions on Instrumentation and
B. The TickTock structure for robust frequency tracking
Achieving frequency-tracking with the TickTock algorithm requires two parallel sets of filter paths used in a “Tick-Tock”
alternating pattern (Fig. 1). At some instant in time, one filter path is configured for operation at the most recent estimate of
actual system frequency f. The frequency of the correlation waveform (sin and cosine) is set to f, and the “boxcar” filter sections
are all configured for exact-time averages over (1/f) (P-class) and (2/f) for the M-class filter sections (for FS=50). This filter path
cannot be used immediately, since it will require 6 fundamental periods to elapse before the filter is settled. During this time, the
2nd parallel filter path is actively used. When the first filter path settles, the “Filter Control” timers set the logic flags so that the
first filter becomes active, and the 2nd filter path is reset using the newest frequency estimate. This repetitive Tick-Tock
procedure continues indefinitely. In this way, the filter paths can track frequency, but at any time the output data from the active
filter has been processed by a filter which is fixed, understood, and symmetric (zero phase). The timestamp is placed 3 cycle
periods (as used by the active filter path) into the past relative to the most recent ADC sample.
C. Improvement of frequency and ROCOF outputs
The second change made to the algorithms in this paper compared to [15] relates to the fact that in [15], the two TickTock
filter paths were combined into a single path for the frequency and ROCOF calculation. However, when the filter path is
changed, there can be a very small step in the phasor measurement if frequency is changing. For example, under a 1 Hz/s ramp
the phase measured by the FS=50 Hz TickTock PMU steps by about 5e-7 rad when the filter path switches. This sounds
insignificant, but when phase is differentiated to frequency and double-differentiated to ROCOF, the steps become a problem.
Previously in [15], software applied “dead reckoning” of frequency and ROCOF for one or two samples following a filter path
changeover. However, a much simpler and accurate output is produced if the parallel filter structure is maintained right the way
through to the calculations of frequency and ROCOF. In this new structure, the final outputs for all quantities (Amplitude, Phase,
Frequency and ROCOF) are only selected from the active path at the very last part of the process. This is highlighted on Fig. 1.
D. Additional frequency and ROCOF filtering, and the “Basic+” algorithms
The third change made to the algorithms in this paper, relative to [15], is that some additional averaging can be applied to the
measurements of frequency and ROCOF, without violation of the C37.118 requirements for response time, latency and delay. In
particular, delay time is only specified-for and tested-with amplitude and phase steps. Therefore, it is found by experiment that
for the P-class PMU, a full 1 cycle of averaging can be added to the frequency (and ROCOF) measurement, and still pass the
dynamic step tests. Similarly for the M-class FS=50 Hz PMU, it is found that ½ cycle of averaging can be added. These extra
average sections mean that effectively the measurements of frequency and ROCOF are really placed ½-cycle and ¼-cycle after
the timestamp which is given for the phasor measurement. There is no easy way to include this information within the standard
on Fig. 1. To avoid failures of frequency accuracy during the frequency ramp tests, the final frequency output can be corrected
by the measured ROCOF value times ½ of the extra averaging time. For fairness in the test results and comparisons in section V.
the same additional 1-cycle and ½-cycle frequency and ROCOF averaging is added to the Basic P-class and M-class device
implementations, except that those averages are always at lengths of 1/f0 and 1/(2 f0) s, i.e. they do not track actual frequency.
Therefore, in sections V. and VII. , where the algorithms are tested, these “improved” Basic algorithms are referred to as
“Basic+”.
IV. C37.118TEST ENVIRONMENT IN SIMULATION
To test the proposed TickTock and the Basic+ algorithms against the C37.118 requirements, a more formal test environment
needs to be created than has previously been presented in previous works (e.g. [6-15]). This is not particularly publishable work,
and so many of the details are not presented in this paper. However, developing the environment involves a certain degree of
software engineering challenge. It is a simulation-only environment, coded in MATLAB® Simulink®, as are the PMU
algorithms. Therefore, the algorithms, simulated analogue filters, and simulated analogue-to-digital converters (ADCs) are
tested. Linearity of analogue hardware, accuracy of UTC time sources, and latency of communication mechanisms [2] are not
tested. The test source and specification limits are defined exactly as per [1], using a MATLAB® script to repeatedly run
Simulink® models with the correct scenarios and test limits.
Within the simulation environment, one has the luxury of being able to execute the algorithms at the full FADC=10 kHz sample
rate, even the Basic+ algorithm which might not be able to support this rate in real time [15]. One also has access to reports at
this same rate. For most of the tests, additional software following the PMU decimates the reports so that only those with
timestamps falling at exact 20ms intervals are treated as actual reports (for FS=50 Hz), with every 50th report falling exactly on a
UTC second rollover. It should be noted that for the proposed PMUs with frequency tracking and variable-length filters, this
process is slightly more complex than a simple decimation. However, it is quite do-able, and linear interpolation between the two
closest reports to the ideal 20ms intervals can be used to produce reports exactly on those intervals.
The availability of reports at a 10kHz frame rate in simulation is extremely useful to simplify the process for the dynamic step
tests. This is because the response times, delay and latency times can be measured directly with 100µs resolution, or even more
accurately when linear interpolation is also carried out. This avoids the process described in [1], for real PMUs, which requires
the step times to be varied gradually over many test cycles to build up a high-resolution analysis of the performance.
V. STANDARD C37.118TEST RESULTS
Test results for the Basic+ and proposed TickTock algorithms are presented in this section, for all standard tests except the
This is a postprint of a paper submitted to and accepted for publication in IEEE Transactions on Instrumentation and highlight them.
A. Steady-State test
The steady-state test (TABLE I) proceeds largely without incident. However, note that no M class algorithms are compliant
with a ROCOF of 0.01 Hz/s when the input signal (voltage) is 0.1pu, at the bottom of the required range. They are compliant
with higher signal levels. This is simply due to the ADC resolution/noise. In these tests, the sample rate FADC=10kHz, a
single-pole 2.5kHz analogue low-pass anti-alias filter is simulated, and a 16-bit ADC is simulated which spans a voltage input range of
-2pu to +2pu. Noise is simulated by adding an RMS value of 0.5 least-significant-bits. These values were chosen since they do
allow the P-class PMU to achieve 0.01 Hz ROCOF accuracy with its minimum specified input amplitude (0.8pu).
TABLE I STEADY-STATE TEST RESULTS
Conditions TVE Max Freq. Max Error
Max ROCOF
Error Max Latency
(%) (Hz) (Hz/s) (ms) P Basic+ 0.8 pu
±2 Hz
0.03 0.0001 0.009 20.0 P TickTock 0.03 0.0001 0.010 20.9 P Spec. 1.00 0.0050 0.010 40.0 M Basic+ 0.1 pu
±5 Hz
0.07 0.0006 0.057 58.9 M TickTock 0.03 0.0002 0.016 66.7
M Basic+ 1.0 pu ±5 Hz
0.07 0.0001 0.005 58.9 M TickTock 0.03 0.0001 0.002 66.7 M Spec. 1.00 0.0050 0.010 100.0
B. Steady-State with Harmonics test
The standard [1] only requires testing of harmonic immunity at the conditions of nominal amplitude and frequency, due to a
clause at the beginning of section 5.5.4 in [1]. This is a rather limited test range, and does not give much indication of a PMU’s
likely behaviour in the field. Individual harmonics are applied at 1% (for P-class) and 10% (for M-class) amplitudes relative to
the fundamental. In this paper, every prime-number harmonic from 2 to 47 is applied, and the 50th. The results yield few
surprises, although the M-class Basic+ device still produces some high values of ROCOF, due to the fact that its filter does not
place notches at all the harmonic frequencies, even when frequency is nominal. The Basic+ P-class device actually performs
TABLE II STEADY-STATE (WITH HARMONICS) TEST RESULTS AT NOMINAL FREQUENCY AND AMPLITUDE
Conditions TVE Max Max Freq. Error Max ROCOF Error Max Latency
(%) (Hz) (Hz/s) (ms) P Basic+ 1.0 pu
50 Hz Ha=1%
0.03 0.0001 0.007 20.0
P TickTock 0.03 0.0001 0.007 20.1
P Spec. 1.00 0.0050 0.010 40.0 M Basic+ 1.0 pu
50 Hz Ha=10%
0.03 0.0044 0.878 58.9
M TickTock 0.03 0.0001 0.001 66.7
M Spec. 1.00 0.0250 6.000 100.0
To show a wider and more realistic comparison, the test is repeated, but with worst-case (lowest) fundamental amplitudes of
0.8pu for P-class and 0.1pu for M-class. Frequency is swept over the required range (±2 Hz for P-Class, ±5 Hz for the M-class
with FS=50 Hz). The P-class Basic+ PMU is close to non-compliance with frequency (TABLE III), and is non-compliant with
ROCOF with errors of almost 0.5 Hz/s with only a single 1% harmonic applied. Meanwhile, the proposed P-class TickTock
design has a ROCOF with an error reduced by a factor of almost 50. For M-class, the ROCOF specification seems too wide – a
measurement with an inaccuracy of 6 Hz/s is essentially useless to any user. Both algorithms are able to perform substantially
better than this, but again the proposed TickTock design offers errors reduced by a factor of >80 compared to the Basic+
algorithm.
TABLE III STEADY-STATE (WITH HARMONICS) TEST RESULTS OVER SPECIFIED FREQUENCY RANGE
Conditions TVE Max Max Freq. Error Max ROCOF Error Max Latency
(%) (Hz) (Hz/s) (ms) P Basic+ 0.8 pu
±2 Hz Ha=1%
0.03 0.0048 0.476 20.0
P TickTock 0.03 0.0001 0.011 20.9
P Spec. 1.00 0.0050 0.010 40.0 M Basic+ 0.1 pu
±5 Hz Ha=10%
0.07 0.0008 1.584 58.9
M TickTock 0.03 0.0003 0.019 66.7
M Spec. 1.00 0.0250 6.000 100.0
C. Steady-State Out-of-band test
The out-of-band test is only run for M-class PMUs. Interharmonics are applied across the ranges of 10-25 Hz and 75-100 Hz,
at amplitudes of 10% relative to the fundamental. Meanwhile, fundamental frequency is swept across the range of 47.5 to
52.5 Hz as per [1]. It should be noted that this range is less than the standard ±5 Hz range for the PMU, as the test is designed to
accommodate fixed-filter designs. The TickTock design could actually be tested across its whole ±5 Hz range (and wider),
assuming that the OOB frequencies were also adjusted so that the filter rejection was tested between beat frequencies of 25 Hz
This is a postprint of a paper submitted to and accepted for publication in IEEE Transactions on Instrumentation and
signals) (TABLE IV), and this is because the filter was designed so close to the 20dB limit at a beat frequency of 25 Hz (Fig.
3a). Slight adjustment of the Basic+ filter could make its TVE compliant. More relevant are the frequency and ROCOF results.
The specifications appear to be unrealistically tight. The proposed TickTock design offers reductions in frequency and ROCOF
errors with factors of ~10, due to the improved filter attenuation. Even the ROCOF error offered by the proposed algorithm, at
4.42 Hz/s, essentially amounts to a worthless measurement. However, it does not appear that the OOB test conditions have been
specifically designed to mimic any real-world power system condition. The choice of 10% as the applied interharmonic
amplitude appears to be simply to allow testing of the M-class digital filter attenuation by checking against a convenient ~1%
TVE level. The 10% interharmonic should be attenuated by 20db (a gain of 0.1) leading to a TVE of ≤1%. The actual test
specification is a TVE of 1.3% which gives an allowance for the additional PMU error mechanisms. The presence of such 10%
amplitude interharmonics at frequencies so close to the fundamental will lead to flicker violations and therefore should not be
present on real networks for any sustained periods of time, although brief appearances of such interharmonics may occur without
violation of flicker limits. These mechanisms and effects are described in section VI. A. which follows.
TABLE IV STEADY-STATE (WITH OUT-OF-BAND) TEST RESULTS
Conditions TVE Max Max Freq. Error
Max ROCOF
Error Max Latency
(%) (Hz) (Hz/s) (ms) M Basic+
0.1 pu 1.39 0.4259 >50.0 58.9 M TickTock 0.52 0.0360 4.420 63.2 M Spec. 1.30 0.0100 0.100 100.0
D. Bandwidth test – Amplitude and Phase Modulation
In this test, amplitude and phase modulations are applied as per [1]. The Bandwidth test contains no non-compliances. The
most significant observation is the very wide specifications allowed for TVE, frequency and ROCOF, while the actual test results
suggest that much tighter targets could be met (TABLE V). The proposed M-class TickTock PMU has a slightly worse (but still
compliant) TVE error, due to its longer response time to the phasor (Fig. 2 and section VII. A. ).
TABLE V BANDWIDTH (AMPLITUDE AND PHASE MODULATION) TEST RESULTS
Conditions TVE Max Max Freq. Error
Max ROCOF
Error Max Latency
(%) (Hz) (Hz/s) (ms) P Basic+
1.0 pu 0.09 0.0004 0.323 20.0 P TickTock 0.09 0.0007 0.325 20.1 P Spec. 3.00 0.0600 3.000 40.0 M Basic+
E. Frequency Ramp test
The frequency ramp test is carried out by applying ±1 Hz/s ramps over the PMU frequency range. These start, stop, or pass
through the nominal frequency f0. There are no surprises and all algorithms are compliant (TABLE VI). Frequency and ROCOF
specifications are tight but achievable.
TABLE VI FREQUENCY RAMP (±1HZ/S) TEST RESULTS
Conditions TVE Max Max Freq. Error
Max ROCOF
Error Max Latency
(%) (Hz) (Hz/s) (ms) P Basic+
1.0 pu 0.05 0.0001 0.007 20.0 P TickTock 0.05 0.0002 0.007 20.9 P Spec. 1.00 0.0100 0.100 40.0 M Basic+
1.0 pu 0.07 0.0001 0.007 58.9 M TickTock 0.03 0.0001 0.012 66.7 M Spec. 1.00 0.0050 0.100 100.0
F. Dynamic step test
This test is presented later in section VII. A. after the Hybrid P/M class device has been introduced.
VI. DEVELOPMENT OF A HYBRID P/M CLASS DEVICE, AND ITS DEPENDENCE ON INTERHARMONICS
It is not recommended to instantly make large reconfigurations to a filter path while it is in active use, since it results in an
asymmetric filter with an undefined response (see section III. ). Although the resulting TVE errors are very small, the effect on
frequency and ROCOF calculations can be serious. For this reason, it is found that switching a single filter path (in Fig. 1)
suddenly from M-class to P-class creates a real problem for the subsequent frequency and ROCOF calculations. Therefore, after
substantial complicated (but ultimately fruitless) efforts to produce a single Hybrid P/M class device using a single algorithm
similar to Fig. 1, in the final analysis this is not a sensible approach. However, a robust Hybrid P/M class device can be created
by including a complete P-class algorithm in parallel with a complete M-class algorithm, and then creating a triggering algorithm
which simply selects which PMU data to pass on to the final reporting output. This requires no complex changes to be made
within each individual PMU. Memory use is dominated by the M-class device [15], and execution time will be of the order of
80-100µs, roughly twice that of the single M-class PMU [15], which (just) supports operation at the full 10kHz sample rate.
To create a Hybrid M-class/class device which can detect a transient and automatically switch from M-class response to
P-class response requires a triggering system with P-P-class response. Otherwise, the triggering will be too slow. To provide a
beneficial result which would be useful in practice and have a measurable benefit under C37.118 testing, the PMU must detect
amplitude steps of <10%, and phase steps of <10°. Of course it is useful if these thresholds can be lowered as far as possible
This is a postprint of a paper submitted to and accepted for publication in IEEE Transactions on Instrumentation and
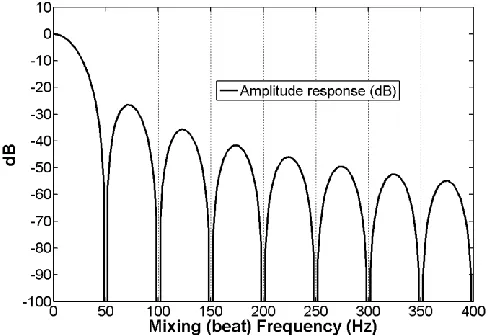
A. The effects of interharmonics on P-class measurements
In this next section, the effects of potential OOB and interharmonic signals on trigger thresholds applied to a P-class device
are examined, to determine whether suitable thresholds can be found. The focus is on such interharmonic signals because the
unwanted 2f mixing product and Nf harmonics are already well attenuated by the tracking notches of the adaptive P-class filter.
[image:14.612.184.429.168.336.2]The response of this filter (when f=f0) is shown in Fig. 4
Fig. 4. The P class filter characteristic. For the adaptive PMU, the notches track with the actual frequency f.
The challenge is to assess the likely interharmonics which may arise in a power system, and could cause false triggering. It
turns out that there is no single reference or standard which describes likely (or allowed) levels of interharmonics, so here a
“mini review” is presented. The standards which exist vary widely. For example, C37.118 [1] specifies OOB testing at levels of
10%, from 10 Hz to 2f0. In contrast, the Meister curve allows 9% between 100 Hz and 500 Hz, then dropping to 1,5% at 3 kHz
[17]. This curve is driven by the functional behaviour of Ripple Control Transmitters (RCTs) [17] [18] [19] which superimpose
audio frequencies in the ~110-2200 Hz range (or potentially to 3kHz), at amplitudes of approximately 2-5% (but potentially up
to 8%-9% under resonance). However, RCTs only claim to be active above about 110 Hz, and only for short burst periods when
the message is transmitted, and so the origin of any 9-10% interharmonics below 2f0 is unclear. In fact, there are standards
governing flicker e.g. [20] and these place strict limits on sustained interharmonic levels near f0, due to the effect of such
interharmonics on perceived fundamental amplitude. In particular, the worst cases are for beat frequencies of 8.8 Hz, this being
the “most annoying” flicker frequency, and the centre of the band-pass filter within a flicker-meter. These limits are shown in
Fig. 5. Interharmonic compatability levels (Flickermeter response for Pst = 1 related to 60-W incandescent lamps) [18]
At higher frequencies, power-electronic devices and drives may cause local interharmonics within industrial environments at
levels of up to 2.5% (up to the 11th harmonic), and at up to 1% (above the 25th harmonic) [18]. Thryristor-based HVDC links
between 50 Hz and 60 Hz systems are also known to inject interharmonics, in particular during switch-on sequences. From an
“immunity” standpoint, [21] gives values of interharmonics at different frequencies which different types of equipment should be
immune to. Class 2 (normal) equipment is expected to tolerate levels of 2.5% at up to 2f0, 5% between 2f0 and 10f0, then
decreasing levels to 1.5% up to 2kHz. Class 3 equipment for industrial environments is required to tolerate higher levels.
On the other hand, several sources including [22] refer to a much lower “IEC international compatibility level” at 6.6-33kV of
0.2% at all frequencies, given in [23] which contains much text in common with [17]. This level of 0.2% stems from the
sensitivity of RTC receivers, which is around 0.3%, so interfering interharmonics>0.2% from any non-RTC source could corrupt
RTC messages. An alternative discussion suggesting low tolerable values of interharmonics appears in appendix B of [17] which
argues that “It seems prudent to consider compatibility levels no higher than those for adjacent harmonics. For example, there
can be no reason for accepting a higher voltage at 95 Hz than at 100 Hz on a 50 Hz system, or a higher voltage at 115 Hz than
at 120 Hz on a 60 Hz system. Accordingly, it is suggested that the reference level for each interharmonic frequency be equal to
the compatibility level … for the next higher even harmonic”. Such an approach would limit steady-state interharmonics to 2%
below the 2nd harmonic (2f), 1% from 2f to 4f, 0.5% between 6f and 10f, and then linearly dropping values to 0.25% at 50f.
Addition of the consideration of short-term events could be accounted for using the k-factor multiplier given by [17]:
5
45
7
.
0
3
.
1
h
k
where h is frequency of the interharmonic divided by the fundamental frequency (1)Evaluation of k gives k=1.25 at h=2, increasing linearly to k=2 at h=50.
This is a postprint of a paper submitted to and accepted for publication in IEEE Transactions on Instrumentation and
harmonic and interharmonic signals over a 200Hz band should be limited to 0.3%. These higher frequency bands include the
bands used for mains signalling and power-line communications.
It is difficult to draw solid conclusions from all the above. In this paper, the assumption is that sustained interharmonics at a
real PMU location will be limited to “normal” levels defined by [21] and flicker defined by Fig. 6, leading to a prototype
specification for interharmonic limits given by the solid line on Fig. 6. However, it should be noted that short-term
interharmonics from RCTs or other devices may exceed these levels, and are not controlled well by any standard. Also, the OOB
testing using 10% levels defined by C37.118 significantly exceeds this limit. If interharmonics at this limit level (the solid line on
Fig. 6) are applied to the P-class PMU, they will be attenuated only by the P-class filter shown in Fig. 4. The effective levels
which then pass through to the PMU output (as ripple) are shown by the thick dashed line on Fig. 6.
Fig. 6. Prototype sustained interharmonic specification, levels passing through P-class filter, and allowable limits with the final chosen trigger limits (0.03pu/cycle and 2.5°/cycle)
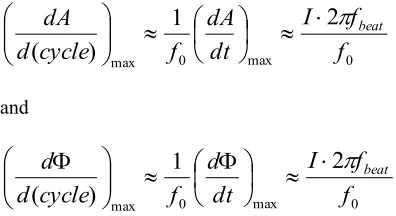
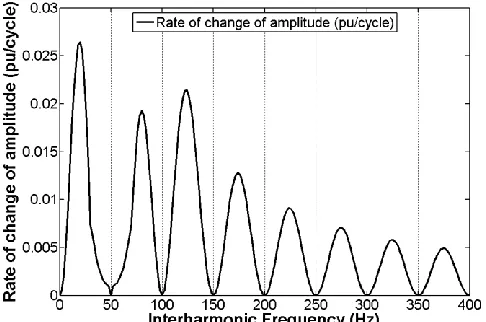
Since the interfering phasor at the PMU output appears as a small rotating phasor added to the wanted fundamental phasor, the perceived rates of change of (fundamental) amplitude and phase can be estimated by:
0 max 0 max
2
1
)
(
f
f
I
dt
dA
f
cycle
d
dA
beat
(2) and 0 max 0 max2
1
)
(
f
f
I
dt
d
f
cycle
d
d
beat
(3)where A is amplitude (in per-unit), Φ is phase (rad), fbeat is the beat frequency of the interharmonic with the fundamental, and
I is the interharmonic level which has passed through the PMU filter at a beat frequency fbeat. Evaluation of (2) and (3) leads to
the expected levels of rate-of-change of amplitude and phase due to those interharmonics, shown in Fig. 7 and Fig. 8. From
[image:16.612.184.429.282.447.2] [image:16.612.48.246.529.637.2]2.5 degrees-per-cycle could relatively comfortably be used. These are sensible and useful values in a dynamic power system
context. When these thresholds are used, the maximum allowable interharmonic levels which can be applied without causing
triggering can be calculated by back-calculation of (2) and (3). This leads to the highest dotted line on Fig. 6. Note that for
certain frequencies close to f0, this line drops below 10%. Therefore, during PMU OOB testing as presently specified, the trigger
thresholds will be exceeded and the Hybrid PMU will drop into P-class operation (and subsequently fail the test). However, the
trigger levels seem to be high enough to allow RCT events at >5% above 110 Hz and >10% above 150 Hz, which is perhaps a
more realistic requirement.
[image:17.612.185.428.201.362.2]Fig. 7. Expected amplitude ripple from P-class measurement, subjected to prototype interharmonic limits from Fig. 6
Fig. 8. Expected phase ripple from P-class measurement, subjected to prototype interharmonic limits from Fig. 6
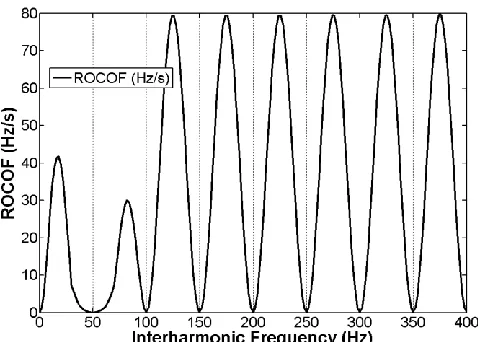
It is tempting to try and create a trigger based upon ROCOF. However, the expected level in the presence of interharmonics
can be determined by extension of (3) to:
2
2
2
2
2max
max beat beat
f
I
dt
d
f
ROCOF
(4)The resulting ROCOF excursions are shown in Fig. 9, with values to 80 Hz/s. Clearly, no sensible trigger with a useful
threshold of 0.2-1 Hz/s can be set when interharmonic signals may be present. This graph also explains why P-class devices with
This is a postprint of a paper submitted to and accepted for publication in IEEE Transactions on Instrumentation and Fig. 9. Expected ROCOF from P-class measurement, subjected to prototype interharmonic limits from Fig. 6
B. Trigger implementation
To implement the triggers based upon measurements from a P-class device, the amplitude and phase results can be extracted
from the P-class PMU algorithm. When a step in amplitude or phase occurs, the result from the PMU actually follows the step
response of the 2-cycle P-class PMU filter, which is very specific. The response forms an “S” shaped response curve [1] which
takes 2 cycles to achieve the final value. The peak gradient of this transition reaches a value given by the step magnitude divided
by one cycle period, 1 cycle after the step actually occurs. Therefore, the step threshold of 0.03 pu/cycle or 2.5°/cycle can be
tested-for by comparing it to d/dt of the P-class amplitude or phase output, divided by f. For amplitude this is fine. For phase
there is a problem. Firstly, the measured phase contains arbitrary steady-state values between –π and π, plus ongoing changes due
to off-nominal frequency given by 2π(f-f0)t. It is possible to remove these effects with a filter that removes both DC and linear
phase-ramp terms, but leaves only the more sudden transitions. Such a filter is:
22
1
s
s
where s is the Laplace operator, and τ is a time constant describing two high-pass filters. (5)This means that the total filter to apply to the P-class phase signal before comparing it to the 2.5° (per cycle) threshold would
be:
s
f
s
erFilter
PhaseTrigg
23 2
1
when applied to the measured phase Φ(6)
This filter can be created, but there are two problems. Firstly, the filters need to be very carefully constructed to deal with
The research leading to the results described in this paper was partially funded by the European Metrology Research Program (EMRP), which is jointly funded by the EMRP participating countries within EURAMET and the European Union on the basis of Decision No 912/2009/EC.
phase wrapping at the –π/+π boundary. Secondly, as described in section III. C. , when the P-class PMU changes from one filter
path to another, very tiny steps in measured phase occur. These are well within the TVE threshold, but can cause false triggering
when differentiated. This could be dealt with using some extra triggering logic or qualification over a number of frames.
However, an easier solution to both these problems is to recognise that:
2
2
s
ROCOF
(7)
Substitution of (7) into (6) reveals:
s
f
s
erFilter
PhaseTrigg
22
1
2
when applied to the measured ROCOF(8)
This has the advantages that there is no requirement to cope with phase wrapping, and also, the careful use of twin filter paths
to calculate ROCOF means that there is no jump in ROCOF when the filter path is switched. To ensure that the phase jump is
detected exactly 1 cycle after it occurs, the ROCOF measurement is extracted from output port 8 of Fig. 1, before any additional
frequency/ROCOF filtering is applied. By experiment, it is found that τ=0.2 is an appropriate value. Equation (8) is not
instinctive and on-sight inspection of it suggests that the triggering will have excess lag, but this is not the case and the equations
do their job. In practice, the phase step triggering works well, reaching the actual step value 1 cycle after the actual step occurs,
exactly as one would expect with the P-class filter.
VII. TESTING OF ALGORITHMS (INCLUDING HYBRID) USING STANDARD DYNAMIC STEPS AND MORE EXTREME SCENARIOS To test the P-class, M-class, and Hybrid PMUs, the standard dynamic step test from [1] is first carried out. Then, more
advanced scenarios containing overlaid effects of frequency, unbalance, harmonics, and interharmonics are applied. These
scenarios are designed to show how such PMUs might respond during worst-case, real-world scenarios.
A. Standard dynamic step test
First, the standard dynamic step test is carried out. It is found that all the Basic+ and proposed devices are compliant. Only the
response times are presented in TABLE VII (and all the following tables) since the delay times, overshoots/undershoots and
latencies (which were measured to ~100µs resolution) did not highlight any possibilities of non-compliance with [1]. It can be
seen that the frequency and ROCOF response times are compliant, even though the extra averaging filter has been applied to
them. The M-class Basic+ design actually has a very short TVE response time to amplitude and phase steps, and this is a direct
result of the way that the filter weights form a tight peak (Fig. 2). The Hybrid PMU does exactly what it should. When the step
This is a postprint of a paper submitted to and accepted for publication in IEEE Transactions on Instrumentation and TABLE VII DYNAMIC STEP TEST RESULTS
Maximum Response Time TVE Freq. ROCOF (ms) (ms) (ms) P Basic+ 26 60 61 P TickTock 26 60 60 P Spec. 34 70 80 M Basic+ 29.97 111 129 M TickTock 61.54 99 125 M Spec. 99 130 134 M/P Hybrid 26 55 98
B. Non-standard tests including unbalanced fundamentals, multiple unbalanced harmonics, and interharmonics
Further to the standard PMU tests specified in C37.118, four more tests are carried out. These tests include a much wider
array of interfering signals than specified in the standard, at levels which appear to be admissible by power quality standards for
sustained or short-term durations. The first pair of tests involves those interfering signals plus frequency ramps. The second pair
of tests involves the interfering signals plus dynamic amplitude and phase steps.
The scenarios for these pairs of tests contains unbalance (2%), harmonics, and interharmonics applied at all times. The
harmonics spectrum includes contributions from every harmonic from the 2nd to the 40th, at levels proportionate to those of
EN50160 [24], to a total harmonic distortion (THD) of 8% [24]. They are applied with random phases on each phase so that
every harmonic contains contributions from positive, negative, and zero sequences. Interharmonics are applied at the following
frequencies and levels, again at random phases on each phase: 75 Hz (1%), 125 Hz (5%), 235 Hz (2.5%), 3560 Hz, 3570 Hz,
3580 Hz, 3590 Hz, 3600 Hz, 3610 Hz, 3620 Hz, 3630 Hz & 3640 Hz (all at 1%). The 75 Hz component simulates a worst-case
OOB signal which lies close to the “pass-band” of the FS=50 Hz PMU. The 125 Hz component simulates an RCT sending a
message. The 235 Hz component simulates an interharmonic from a 50/60 Hz HVDC link. The components surrounding 3.6 kHz
simulate power electronic switching harmonics within a noisy industrial environment.
The first pair of tests includes a non-linear frequency ramp from 49.9 Hz to 46 Hz over 6.13 s, with an initial ramp rate of
-1.0 Hz/s that decays to zero as 46 Hz is approached. The first test in this pair excludes the lowest-frequency interharmonics at
75 and 125 Hz. The results from the P class and M class algorithms are shown in TABLE VIII, along with the Hybrid PMU
which stays in M-Class mode throughout the test, and so it gives exactly the same results as the TickTock M-class PMU. What is
clear from this test is that a Basic+ P-class device will be unable to give a sensible readout of frequency or ROCOF. The only
device which is able to provide a useable set of frequency and ROCOF data is the proposed TickTock M-class PMU, and the
Hybrid PMU. The ROCOF accuracy from these devices is a factor of >150 better than from the Basic+ M-class device.
The second test in this pair repeats the frequency ramp, with all interfering signals plus the 75and 125 Hz components. This
frequency and ROCOF measurement within a P-class PMU. The short filter (Fig. 4) is simply not long enough to be effective.
The proposed M-class TickTock PMU and the Hybrid PMU give reasonable results, although a 0.17 Hz/s error would still cause
big problems for schemes such as loss-of-mains detection etc.
TABLE VIII NON-LINEAR FREQUENCY RAMP WITH UNBALANCE,EN50160HARMONICS AND HIGH-FREQUENCY INTERHARMONICS
Max TVE
Max Freq. Error
Max ROCOF
Error (%) (Hz) (Hz/s) P Basic+ 0.11 0.0942 9.334 P TickTock 0.05 0.0118 1.146 M Basic+ 0.07 0.0042 0.817 M TickTock 0.03 0.0001 0.005 M/P Hybrid 0.03 0.0001 0.005
TABLE IX NON-LINEAR FREQUENCY RAMP WITH UNBALANCE,EN50160HARMONICS,LOW AND HIGH-FREQUENCY INTERHARMONICS Max
TVE Max Freq. Error
Max ROCOF
Error (%) (Hz) (Hz/s) P Basic+ 0.35 0.2432 24.596 P TickTock 0.34 0.1706 16.875 M Basic+ 0.11 0.0210 2.823 M TickTock 0.05 0.0013 0.167 M/P Hybrid 0.05 0.0013 0.167
The final tests replace the frequency ramp with the same 10% or 10° steps as used in the standard C37.118 dynamic test. First,
the scenario excludes the lowest frequency 75 Hz and 125 Hz interharmonics. The results are shown in TABLE X. In these step
tests, the specification thresholds for TVE, frequency and ROCOF are out-with the standard and have been set to values which
appear to be “appropriate” by reference to the previous test results in TABLE VIII and TABLE IX. They have to be set, to
enable the transition times (in and out of compliance) to be determined, in order to evaluate the response time. Again, it is found
that the Hybrid PMU does exactly what is required; the response time for TVE drops to the P-class value. The response times for
frequency and ROCOF do not appear to drop. This is because while (all) the P-class devices are easily compliant with the 1%
TVE spec, when the Hybrid PMU triggers into P-class mode, the frequency and ROCOF results then take on the P-class
TickTock values from TABLE VIII, which are not compliant with the M-class thresholds applied for the response measurement.
The M-class filters (in total) are 6½ cycles long (including frequency averaging) and so once triggered into P-class mode, the
Hybrid PMU stays “held” in P-class mode for 130ms. Therefore the Hybrid PMU’s frequency and ROCOF response appears as a
full 130ms.
When the 75 Hz and 125 Hz interharmonics are also included, the results change a little, shown in TABLE XI. The M-class
This is a postprint of a paper submitted to and accepted for publication in IEEE Transactions on Instrumentation and
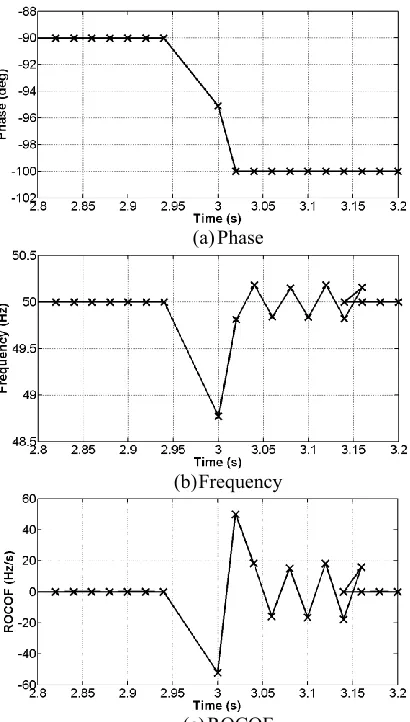
frequency and ROCOF, even at steady state. It is interesting to observe the report data from the Hybrid PMU during this test, in
the time domain. This is shown in Fig. 10, with ‘X’ markers indicating the actual reports and timestamps. In this case, P-class
output is triggered at t=3.02 s, 20ms after the actual step which occurs at t=3.0000s, and this enables a P-class report to be made
with a timestamp of 3.00 s at t=3.02 s, showing the phasor half-way through its transition, with a much faster response than the
M-class PMU would give. P-class operation is then “held” until t=3.18 s (timestamp 3.16 s), then M-class operation is resumed.
It can be seen that jumping between P-class and M-class operation produces (in this case) gaps and retraces of timestamps, due
to the changing filter lengths. This could be remedied by enhanced reporting software, to add more reports (between timestamps
2.94 and 3.00 s, where data is available from either P or M-class PMU), and to remove duplicates in the region of 3.14-3.16 s.
The more serious issue is that when P-class operation is triggered, although amplitude and phase errors remain very small
(phase errors cannot visibly be observed in Fig. 10a, for example), the frequency and ROCOF outputs from the P-class device
may be unacceptable if the power network is subject to interharmonic disturbance.
TABLE X DYNAMIC STEP TEST RESULTS WITH UNBALANCE,EN50160HARMONICS AND HIGH-FREQUENCY INTERHARMONICS Thresholds used. Maximum Response Time
TVE Freq. ROCOF (ms) (ms) (ms) P Basic+ TVE 1%
Freq. 0.02 Hz ROCOF 3 Hz/s
27 59 59
P TickTock 27 59 59
P Spec. 34 70 80
M Basic+ TVE 1% Freq. 0.005 Hz ROCOF 0.2 Hz/s
30 119 9999
M TickTock 61 99 117
M Spec. 99 130 134
M/P Hybrid 27 130 130
TABLE XI DYNAMIC STEP TEST RESULTS WITH UNBALANCE,EN50160HARMONICS,LOW AND HIGH-FREQUENCY INTERHARMONICS Thresholds used. Maximum Response Time
TVE Freq. ROCOF (ms) (ms) (ms) P Basic+ TVE 1%
Freq. 0.2 Hz ROCOF 30 Hz/s
27 59 50
P TickTock 27 59 50
P Spec. 34 70 80
M Basic+ TVE 1% Freq. 0.005 Hz ROCOF 1.0 Hz/s
30 9999 9999
M TickTock 61 99 108
M Spec. 99 130 134
(a)Phase
(b)Frequency
(c)ROCOF
Fig. 10. Report data from the Hybrid P/M class PMU during a dynamic 10° phase step, with unbalance, EN50160 harmonics, low and high-frequency interharmonics
VIII. DISCUSSION AND CONCLUSIONS
The findings of this paper raise a number of interesting questions and highlight potential areas of future work. There is still
active discussion concerning the new standard C37.118 amongst working groups, and some of the results support this discussion,
particularly where the tests show high levels of non-compliance of the Basic PMU design to the standard which proposes it. In
particular, the ROCOF specifications for the out-of-band (OOB) tests appear to be unachievably tight, and are probably too tight
even for the Steady-state M-class PMU when used with a 0.1pu voltage signal.
Generally, it is found that all algorithms should be able to (easily) achieve the 1% TVE specification under any conceivable
scenario, although the OOB test can lead to results >1% if the filter is not correctly configured.
The biggest question raised by this work is the issue of interharmonics. It is not clear what the justification is for the
application of a full 10% OOB interharmonic in the region of 10 Hz to 2f0 when this appears to contravene all other standards.
Perhaps this level is chosen simply because it allows testing of the filter attenuation via the use of the broad ~1% TVE
specification. If this is the case, then it could be clarified that the PMU results from this test are not expected to be representative
[image:23.612.201.406.46.407.2]This is a postprint of a paper submitted to and accepted for publication in IEEE Transactions on Instrumentation and
guidance to the PMU user as to how the PMU will behave in a real environment. In a real environment, the user does not know
in real time whether he has a single harmonic at 1%, or a scattering of harmonics at much higher amplitudes, what ROCOF is,
and what interharmonics are present. Some sort of blanket guidance on likely accuracy under realistic worst-case scenarios
would be helpful for PMU users. This is the reason for the non-standard tests shown in latter parts of this report. However, even
this raises questions, primarily because the standards governing interharmonics are so vague. Even for more regulated issues
such as harmonics, flicker and unbalance, standards allow term events which exceed the longterm values, and these
short-term events may have severe impacts on PMU outputs, particularly frequency and ROCOF. There is therefore a huge amount of
difficulty in creating any single “worst case” scenario against which to test PMUs, and the lack of such tests perhaps explains
why there are reports of PMUs giving odd or unusable results when inserted at certain points of the power network, particularly
near HVDC stations, or within medium or low-voltage industrial networks.
There are also some relatively easy-to-quantify criteria which are not presently tested by the standard, and this is curious. For
example, there is no examination of unbalance, and there is some ambiguity in the sequence of harmonics which are added. In
reality, algorithms with fixed filters such as the Basic PMU are susceptible to increased uncertainty and ripple if negative or zero
sequence effects occur at off-nominal frequency, even if the mathematics (at nominal frequency) suggests that they should be
immune to these sequences. There is also no testing of any interharmonic rejection at frequencies above 2f0, and in reality this is
where most of the interharmonics lie.
In this paper the work of [15] has been improved so that the proposed “TickTock” P-class and M-class PMUs (with
FS=50 Hz) have been shown to be as compliant or more compliant than the Basic design presented in the standard. In some
cases, the frequency and ROCOF accuracies are better than the Basic accuracies by factors of between 10 and 150, particularly
where the signal contains harmonics or interharmonics and ROCOF is concerned. This is due to the frequency-tracked nature of
the filters, which keeps the filter notches placed on the harmonics. It also allows less-flat filters to be used which instead allows
higher broadband attenuation of interharmonics.
The final observations are that in general, a P-class device should probably not be used to measure frequency or ROCOF
unless it is placed at a location in the power network where the signals are known to be almost perfect balanced sinusoids.
Perhaps, it would be more sensible to always use an M-class device for any measurement that requires frequency or ROCOF to
be measured, or to even allow mixed-timestamp reports which allow P-class amplitude/phase measurements to be merged with
M-class frequency and ROCOF measurements. Certainly, while the Hybrid P/M class design presented in this paper can clearly
be made to work, it has been shown that it is highly undesirable for it to switch to P-class frequency and ROCOF outputs due to
Amplitude/Phase, but retains M-class response for frequency and ROCOF, would be a more sensible device, if the data reporting
structure allowed this.
IX. REFERENCES
[1] IEEE, "IEEE Standard for Synchrophasor Measurements for Power Systems," C37.118.1-2011, 2011. [2] IEEE, "IEEE Standard for Synchrophasor Data Transfer for Power Systems," C37.118.2-2011, 2011.
[3] R. Lira, C. Mycock, D. Wilson, and H. Kang, "PMU Performance Requirements and Validation for Closed Loop Applications," in IEEE Innovative Smart Grid Technologies (ISGT) 2011, Manchester, UK, 2011.
[4] A. G. Phadke and B. Kasztenny, "Synchronized Phasor and Frequency Measurement Under Transient Conditions," IEEE Transactions on Power Delivery,
vol. 24, pp. 89-95, Jan 2009.
[5] IEEE, "IEEE Standard for Synchrophasors for Power Systems," C37.118-2005, 2005.
[6] M. H. Wang and Y. Z. Sun, "A practical method to improve phasor and power measurement accuracy of DFT algorithm," IEEE Transactions on Power Delivery, vol. 21, pp. 1054-1062, Jul 2006.
[7] D. Belega and D. Petri, "Accuracy of a DFT phasor estimator at off-nominal frequency in either steady state or transient conditions," in IEEE SMFG 2011 Smart Measurements For Future Grids, Bologna, Italy, 2011.
[8] H. S. Zhao, Z. Y. Liu, G. W. Song, and D. L. Wei, "The Analysis of Frequency Deviation on Synchrophasor Calculation and Correction Methods," 2009 International Conference on Sustainable Power Generation and Supply, Vols 1-4, pp. 387-391, 2009.
[9] D. Belega and D. Petri, "Accuracy Analysis of the Multicycle Synchrophasor Estimator Provided by the Interpolated DFT Algorithm," IEEE Transactions on Instrumentation and Measurement, vol. 62, pp. 942-953, May 2013.
[10] D. Belega and D. Petri, "Performance of Synchrophasor Measurements Provided by the Weighted Least Squares Approach," in IEEE I2MTC 2013, Minneapolis, 2013, pp. 946-951.
[11] J. A. D. L. O. Serna, "Dynamic phasor estimates for power system oscillations," IEEE Transactions on Instrumentation and Measurement, vol. 56, pp. 1648-1657, Oct 2007.
[12] J. A. D. Serna and J. Rodriguez-Maldonado, "Taylor-Kalman-Fourier Filters for Instantaneous Oscillating Phasor and Harmonic Estimates," IEEE Transactions on Instrumentation and Measurement, vol. 61, pp. 941-951, Apr 2012.
[13] W. Premerlani, B. Kasztenny, and M. Adamiak, "Development and implementation of a synchrophasor estimator capable of measurements under dynamic conditions," IEEE Transactions on Power Delivery, vol. 23, pp. 109-123, Jan 2008.
[14] A. J. Roscoe, I. F. Abdulhadi, and G. M. Burt, "P-Class Phasor Measurement Unit Algorithms Using Adaptive Filtering to Enhance Accuracy at Off-Nominal Frequencies," in IEEE SMFG 2011 Smart Measurements For Future Grids, Bologna, Italy, 2011.
[15] A. J. Roscoe, I. F. Abdulhadi, and G. M. Burt, "P and M Class Phasor Measurement Unit Algorithms using Adaptive Cascaded Filters," IEEE Transactions on Power Delivery, 2013.
[16] A. J. Roscoe, G. M. Burt, and J. R. McDonald, "Frequency and fundamental signal measurement algorithms for distributed control and protection applications," IET Generation, Transmission & Distribution vol. 3, pp. 485-495, May 2009.
[17] IEC, "Electromagnetic compatibility (EMC) - Part 2-2: Environment -Compatibility levels for low-frequency conducted disturbances and signalling in public low-voltage power supply systems," IEC 61000-2-2, 2002.
[18] IEC, "Electromagnetic compatibility (EMC) - Part 2-4: Environment - Compatibility levels in industrial plants for low-frequency conducted disturbances," IEC 61000-2-4, 2002.
[19] Siemens, "Totally Integrated Power - Power Quality (Chapter 9)," Available:
https://www.swe.siemens.com/belux/portal/fr/offre/tip/produits/Pages/tip_application_manual.aspx, accessed November 2012.
[20] IEC, "Electromagnetic compatibility (EMC) Part 4-15: Testing and measurement techniques - Flickermeter - Functional and design specifications," IEC 61000-4-15, 2011.
[21] IEC, "Electromagnetic compatibility (EMC) Part 4-13: Testing and measurement techniques - Harmonics and interharmonics including mains signalling at a.c. power port, low frequency immunity tests," IEC 61000-4-13, 2009.
[22] Energy Networks Association, "Planning levels for voltage distortion and the connection of non-linear loads to transmission systems and public electricity supply systems in the United Kingdom," ER G5/4-1, 2005.
[23] IEC, "Electromagnetic compatibility (EMC) Part 2-12: Environment - Compatibility levels for low-frequency conducted disturbances and signalling in public medium-voltage power supply systems," IEC 61000-2-12, 2003.
[24] BSI Standards, "Voltage characteristics of electricity supplied by public distribution systems," EN 50160, 2010.
X. BIOGRAPHIES