For Review Only
Quantification of Rhythm Problems in Disordered Speech: A Re-Evaluation
Introduction
People with communication deficits can present with a wide range of speech impairments,
including disordered rhythm. Any problem that disturbs the natural flow of speech could
essentially lead to deviations in rhythmic structure, such as a stammer, a problem finding the
correct word, or a difficulty in producing speech sounds in the correct sequence. However,
not all of these are necessarily perceived as disordered rhythm. Instead, such deficits are
primarily associated with the changes in speech timing and the poor coordination between
articulatory systems experienced by speakers with neurogenic speech disorders.
Neurogenic speech problems are also referred to as motor speech disorders (MSDs), which
are defined as “a group of speech disorders resulting from disturbances in muscular control -
weakness, slowness, or incoordination of the speech mechanism - due to damage to the
central or peripheral nervous system or both” (1). There are a number of different types of
MSDs, which are distinguishable by their neuropathology, i.e. the place of lesion in the
nervous system, and their symptomatology, i.e. the resulting speech problem. Causes for
MSDs range from vascular (stroke) to traumatic (traumatic brain injury), degenerative
(Multiple Sclerosis, Parkinson Disease, Motor Neurone Disease, etc.), neoplastic (tumour)
and infectious (e.g. meningitis) problems.
The most common type of MSD is dysarthria, which can affect any combination of speech
subsystems, i.e. respiration, phonation, articulation and velopharyngeal control. Currently,
seven types of dysarthria are recognised in the literature: flaccid, spastic, ataxic, hyperkinetic,
hypokinetic, mixed (flaccid/spastic or spastic/ataxic), and unilateral upper motor neurone 3
For Review Only
dysarthria (UUMN) (2). The differentiation into types is largely based on the neurological
classification of muscle tone and movement disorder, i.e. spastic dysarthria is due to excess
muscle tone and thus results in strained speech production, whereas flaccid dysarthria is
related to a decrease in muscle tone and therefore results in weaker articulation patterns and a
reduction in loudness. There are also differences in terms of which subsystems are affected
and to what degree, e.g. some dysarthrias impact most on prosodic features such as vocal
loudness, voice quality or intonation, whereas others are more detrimental to the articulation
of speech sounds. Similarly, some types cause a reduction in speech tempo, whereas others
have preserved or even accelerated rate. Irrespective of these variations, any type of
dysarthria tends to result in reduced intelligibility and naturalness of speech, impacting on the
person’s effectiveness to communicate and thus their quality of life.
This paper focuses specifically on hypokinetic and ataxic dysarthria as these are commonly
reported to present with speech timing deficits. In addition, they differ significantly in their
presentation and thus lend themselves to evaluations of how sensitive speech analysis
measures are to performance differences. Hypokinetic dysarthria, which is mostly associated
with Parkinson Disease (PD), is characterised by poor breath support resulting in a reduction
in utterance length, short rushes of speech and inappropriate pausing behaviour, low speech
volume and changes to voice quality, impaired articulation, monotonous intonation and, in
some cases, accelerated speech tempo (2-7). Ataxic dysarthria, on the other hand, is linked to
cerebellar problems, i.e. cerebellar stroke or degenerative diseases such as (spino-) cerebellar
ataxia (SCA/CA), Friedreich’s ataxia (FDA) or Multiple Sclerosis (MS). The resulting speech
disorder is characterised by irregular breakdown articulator movements, inappropriate
loudness and pitch excursions, as well as changes in voice quality, slow rate, equalised stress
and syllabic timing of speech movements (2, 8-12). The latter is also referred to as scanning
speech (9, 13), which in severe cases can result in a syllable by syllable production of speech. 3
For Review Only
Effective treatment of dysarthria by speech and language therapists (SLTs) depends on
accurate characterisation of its symptoms. Whilst this continues to be performed primarily by
perceptual means in the clinical environment, instrumental methods have also been developed
for a number of speech features over the years to aid diagnosis and allow the quantification of
treatment outcomes. Any acoustic technique utilised in the characterisation of disordered
speech features tends to be based on developments in research on unimpaired populations,
and rhythm is no exception. Clinical research in this field has focused primarily on
techniques developed for the study of crosslinguistic differences, which have been of interest
to phoneticians for some time.
Early characterisations of rhythm in this context were based on perceptual evaluations of
speakers and resulted in three categories, i.e. stress, syllable and mora timed rhythms (14,
15). English and German were generally considered good representatives of stress timing,
French and Spanish of syllable timing, and Japanese of mora-timing. These classifications
centred around the concept of isochrony, or equality of duration. In stress timed languages,
stress groups or feet were perceived as being of equal duration, whereas in syllable timed
languages, syllables were considered to be isochronous.
These early perceptual descriptions of rhythm were soon superseded by acoustic measures
which allowed researchers to capture speech segment duration from audio-recordings with an
accuracy of a fraction of a millisecond. On the basis of these data, researchers realised that
some of the perceptual concepts developed around rhythm could not be maintained. In
particular, the notion of isochrony was not supported by the durational measures, instead
stress groups and syllables tended to vary in length irrespective of whether a language was
stress or syllable timed. In addition, the acoustic data suggested that the distinction between
stress and syllable timed languages was not as clear cut as originally thought, but rather
formed a continuum. Nevertheless, the original idea of what defined a rhythm class was 3
For Review Only
maintained and speech timing remained at the forefront of researchers’ interest in the
attempts to capture rhythmic differences between languages. In particular, vowel duration
featured heavily in the quantification of rhythm, although other segmental units have also
been employed either in isolation or in combination with the vowel measures.
Table 1 provides an illustration of the main methods that have been developed to capture
speech timing on this basis. Some metrics purely look at the proportion of vowels in the
acoustic signal (%V, (16)), based on the assumption that syllable time languages which do
not alter vowel length a lot will have a higher proportion of vocalic segments in the signal
than stress timed languages which alternate between long and short or reduced vowels. Other
measures focus directly on this variability in vowel length, either employing the standard
deviation (∆V (16)) or coefficient of variation of vowel duration (VarcoV (17)), or measuring
the difference in duration between successive vowel pairs (Pairwise Variability Index, PVI
(18) or nPVI-V (19)). As vowel duration is closely tied to speech rate, some of the above
measures are normalised for rate (VarcoV & nPVI-V).
In addition to the vowel measures, some researchers have proposed to investigate consonantal
segments. This is based on the notion that languages differ not only in their vowel duration
but also in the structure of the remaining syllable components. For example, stress timed
languages tend to be rich in consonant clusters, whereas syllable timed languages
predominantly include simple consonant-vowel combinations (16). Currently available
consonantal measures include the ∆C (16), VarcoC (17) and rPVI-C (19) measures. Note that
these consonant measures tend not to be rate normalised, as consonant durations vary less
across different speaking rates than vowels. 3
For Review Only
Finally, a number of metrics have gone beyond vowels or consonants as their unit of
measurement and look at the variability of syllable duration (VarcoVC (20), Variability Index
(VI) (21)) or whole stress groups (ISI (22)) to characterise rhythm.
--- Insert table 1 around here ---
The application of the above metrics in clinical research was based on the fact that some of
the differences observed between typical and disordered rhythmic performance appeared to
mirror the crosslinguistic distinction between stress and syllable timed languages. It thus
seemed likely that the measures would be able to identify deviations from normal rhythm and
thus act as a diagnostic tool. Furthermore, the fact that crosslinguistic rhythm metrics were
able to reflect the continuum between stress and syllable timing suggested their suitability to
quantify the extent of deviation from normal rhythmic performance in impaired populations.
This feature would be important in terms of judging the severity of the disorder, and would
allow the metric to function as a therapy outcome measure to indicate potential improvement
in performance after treatment.
In the attempt to investigate whether rhythm metrics were indeed valid and reliable tools to
capture disorders of speech timing, researchers applied a wide range of the above measures.
Of these, the PVI was one of the first to be applied to clinical speech (23-25). Another early
attempt involved the application of the ISI to Swedish speakers with dysarthria (26). These
studies demonstrated that the measures could successfully differentiate between groups of
disordered participants and matched healthy controls. Encouraged by these results, Liss et al.
(20) investigated the n-PVI, as well as ∆V and ∆C and measures of syllable variability
(VarcoVC, nPVI-VC and rPVI-VC) with the aim to assess which were most suitable to
distinguish healthy controls from speakers with dysarthria, as well as different types of
dysarthria from each other. They found that variants of the PVI and Varco metrics were 3
For Review Only
particularly successful in discriminating speakers from each other, but that the focus of the
comparison determined which of the measures was optimal, i.e. a metric might be better
suited to identify speakers with Parkinson Disease than those with ataxia, and in some cases,
a combination of predictor variables was most effective to differentiate speaker groups. It is
noteworthy that in a subsequent study by Kim et al. (27), the PVI was not successful in
distinguishing different types of dysarthric speakers from each other (no results are reported
in relation to healthy controls). The authors state that this might have been partly due to the
use of the non-normalised version of the PVI, as opposed to the rate-normalised nPVI-V from
the Liss et al. (20) study. However, it could also have been the case that the PVI was unable
to capture the particular characteristic that differentiated their speaker groups, similar to Liss
et al.’s (20) findings that the best distinguishing metric depended on the type of disorder
under investigation.
Kim et al.’s (27) results aside, there are thus a small number of clinical research reports based
on group data which confirm the suitability of crosslinguistic metrics for the quantification of
type and severity of disordered rhythm. However, before these measures can be fully
accepted as valid tools we need to take a step back and consider whether they can indeed
capture the intricacies of rhythmic performance in disordered population in a clinically useful
way. In order for these measures to function as effective diagnostic markers they need to able
to not only indicate the presence of speech timing changes, but also to characterise their
nature. The most significant shortcoming of the research cited above is the fact that none of
these studies validated their acoustic results with perceptual measures. Whilst each of the
disorders investigated to date (ataxic, hypokinetic, hyperkinetic as well as mixed
spastic-flaccid dysarthria) no doubt showed differences in speech timing compared to typical
speakers as reflected by the rhythm metrics employed, the question arises to what degree
these deviations actually corresponded to the perceptual notion of distorted rhythm. This 3
For Review Only
issue is underlined by the fact that traditionally, only ataxic dysarthria has been associated
with rhythmic problems although timing issues in general are at the forefront of most types of
motor speech disorders. The only study to date that seems to have considered perceptual
ratings in combination with acoustic metrics is Henrich et al. (28). However, they applied a
smaller range of acoustic metrics to their data than Liss et al. (20) and in addition, only
included speakers with ataxic dysarthria. Although their results thus provide an indication
that some measures (PVI, ISI) correlated better with perceptual judgements of disordered
rhythm than others (%V), they cannot shed light on the question whether any deviation
picked up by an acoustic metric corresponds to a perceived disorder of rhythm.
There are further methodological problems associated with the application of metrics to
disordered speech beyond the lack of validation alluded to above. These pertain to the choice
of speech elicitation task and the measurement conventions used. In relation to the latter,
there has been little discussion in the clinical literature of the potential effects of distorted
speech data on the ability to identify the acoustic landmarks normally applied for the metrics.
As explained above, the majority of acoustic rhythm measures are based on either vowel or
consonant duration. This implies that segment boundaries need to be accurately identified for
the metric to produce reliable and valid results. Yet, the articulatory deviations associated
with disordered speech might affect this level of analysis. For examples, many speakers with
MSD show a certain level of hypernasality, which can blur the boundaries between nasal
consonants and vowels. Similarly, poor laryngeal control can result in the devoicing of
vowels, potentially leading researchers to inappropriately attribute parts of the wave form to
consonant duration rather than the vowel interval. No study to date has addressed the impact
of articulatory deviations in disordered speech on the results of rhythm metrics, again raising
the question whether the observed differences in speech timing can in fact be equated with
perceivable rhythm problems or might be artefacts of other articulatory symptoms. 3
For Review Only
Finally, existing studies can be criticised in relation to their lack of variety of elicitation
measures. It is by now well accepted that the phonotactic nature of the speech material can
have substantial effects on rhythm in healthy speakers (29-31). These effects can be
exacerbated in clinical research, i.e. not only do disordered speakers vary in their rhythmic
performance across tasks, the extent of difference to typical populations can also change.
This is clearly highlighted by Henrich et al. (28), whose speakers with ataxic dysarthria
performed within normal limits while reading a passage or a limerick, but differed
significantly in their PVI values for spontaneous speech. Whilst it is not feasible for
investigations to include a variety of dysarthria types, rhythm measures and elicitation tasks,
it is clear that the latter needs to be carefully controlled and ideally more research should
focus on the differences across tasks in order to establish the optimum assessment task for
disordered speaker and establish the extent of variability that can be expected across different
tasks.
This paper aims to address two of the above concerns and investigates in detail how
individual speech production characteristics relate to acoustic based metrics of speech timing
in order to establish (1) to what degree they can act as valid diagnostic markers for rhythmic
disorder and (2) whether any methodological issues might have to be taken into account in
applying such methods to a clinical population. Whilst the issue of elicitation method is not
directly addressed in this study, it is taken into account in the design of the study by including
data from a variety of speech tasks. 3
For Review Only
MethodParticipants
The detailed analysis required to answer the above questions precluded the use of a large
sample. Instead, six participants with speech disorders, as well as six age and gender matched
healthy control speakers were selected from a larger pool of speakers from an existing study
(32). This particular study was chosen as it included speakers with a type of dysarthria that
had previously been associated with rhythmic deviations, i.e. ataxic and hypokinetic
dysarthria (20). Inclusion criteria for the larger study comprised normal or corrected to
normal vision and hearing, normal cognitive skills (as determined by a dementia screening
test (33)), sufficient educational level to perform a reading task and being a native speaker of
Scottish English. Unimpaired speakers had to present without medical history related to
speech or language difficulties. Disordered speakers were diagnosed as presenting either with
ataxic or hypokinetic dysarthria of mild to moderate degree (as established by the referring
health professional or the experimented in cases of self-referral) and no history of speech or
language problems other than their dysarthria. Participant selection for the current study was
based on a review of the acoustic speech data available for each speaker as part of the
existing analysis (investigating speech rate, pausing and variability of speech performance),
as well as a perceptual evaluation by two experienced listeners, indicating clearly perceivable
difficulties with speech timing.
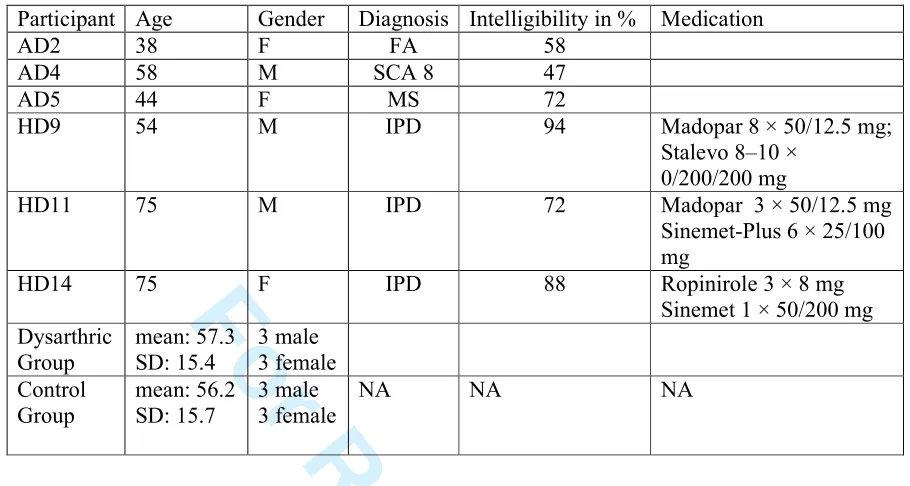
--- insert Table 2 about here --- 3
For Review Only
Recording procedureParticipants were seen in their own homes, at Strathclyde University or at their local health
centre. Recording sessions lasted around 40 – 60 minutes and included participant interview,
cognitive testing and speech recordings. Audio recordings were taken using a portable wave
recorder (Edirol R-09HR) and a head-mounted condenser microphone (AKG C-420) spaced
about 4 cm from the speaker’s mouth.
Materials, Measurement Parameters and Analysis
The original study tested speakers on two experimental tasks commonly used in clinical
speech research to determine the speech timing characteristics, as well as three further speech
tasks to evaluate the intelligibility of the participants with dysarthria (sentence repetition,
passage reading and a monologue). The current investigation focused on the same
experimental tasks to investigate timing and rhythm acoustically and perceptually. In
addition, the monologue data were evaluated perceptually in order to relate the experimental
findings to a more natural speech performance. All acoustic analyses for this study were
performed by the author rather than the experimenter involved in data collection and analysis
of the original investigation. Around 10% of the sentence repetition data were re-analysed by
a second experimenter. Spearman’s rho correlation analysis between the two sets of measures
showed good agreement with (rs = 0.895, p < 0.001). The perceptual analyses were conducted by the author and two other listeners experienced in the evaluation of motor speech disorders.
There was good agreement between listeners with an intraclass correlation coefficient (ICC)
of r=.89, p<0.01. 3
For Review Only
Experimental Task 1The speakers performed a sentence repetition task where they produced “Tony knew you
were lying in bed” approximately 20 times as regularly as possible at their habitual speech
rate. This task was used in the larger study (32) to determine the variability of motor
programmes generated by the speakers across the repetitions. Such investigations usually
employ kinematic measures of lip and jaw movements (see e.g. (34)) and our test sentence
was specifically designed to mirror these task characteristics for the purposes of acoustic
analysis. It also lent itself well to further rhythmic analysis due to the alternation of short and
long vowels typical of English stress timing, hence the decision to base the current analysis
on this existing data set. Sentence repetition is not commonly used to investigate rhythm and
performance might differ from natural speech production due to adaptation or habituation
effects. However, this task had the advantage that it allowed clearer comparisons between
speech performance and rhythm results as several examples of the same utterance were
available. It was therefore possible to observe how small changes in articulatory behaviour
might impact on the results of the rhythm metrics. This was particularly important given the
small number of participants investigated in this study. It was ensured that there were no
differences in regularity of repetitions between disordered speakers and healthy controls
based on the results of the original investigation, and the task was therefore considered
appropriate for the current study.
Measurement parameters for this data set were based on Liss et al.’s (20) investigation and
included the ∆V, ∆C, %V, nPVI-V, rPVI-C, VarcoV, VarcoC, rPVI-VC and nPVI-VC.
Given that Liss et al.(20) had not validated their results perceptually, the full range of metrics
was employed in order to establish whether any one of these might be more representative of
the disordered performance than others. Calculations of these metrics were performed for five
consecutive utterances for each participant, taken from the middle of the repetition sequence. 3
For Review Only
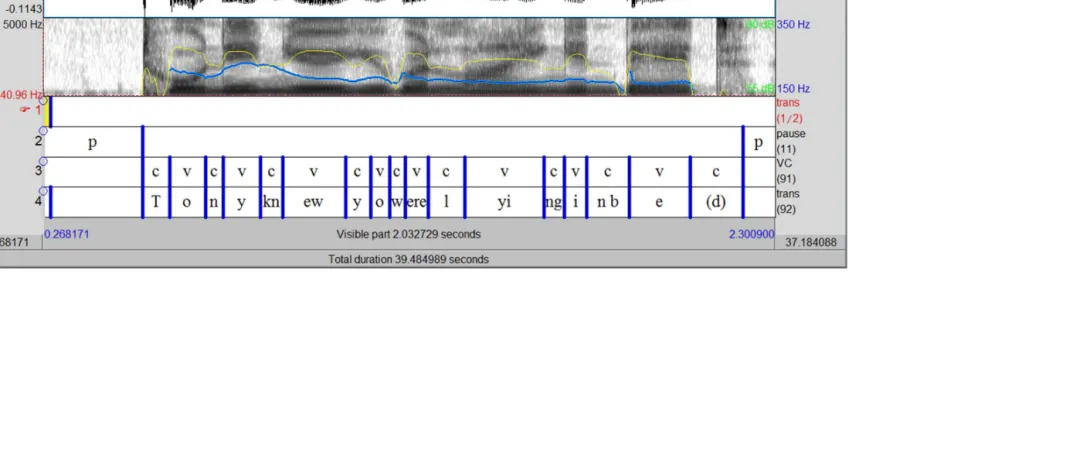
Vowel and consonant intervals were labelled by hand on the spectrographic signal in Praat
(version 5.1.32, (35), see Figure 1 for a screenshot of a typical analysis window). The final
consonant in the utterance (/d/ in “bed”) was excluded from analysis as the release burst was
not always visible on the spectrogram. Measurement conventions followed those prescribed
for the nPVI-V (19), i.e. adjacent consonants or vowels were labelled as one single C or V
interval, and syllabic consonants were labelled as vowels. Once segment boundaries were in
place the interval durations were extracted with a customised Praat script. These were
subsequently entered into an Excel spreadsheet available from Liss et al. (20) which
automatically calculates the various rhythm measures applied in their (and the current)
study1. However, there was one change in procedure from published conventions which
related to the method for deriving the rhythm score for each participant. Normally, rhythm
measures would be based on a connected speech sample, e.g. a person reading a short passage
or producing a monologue. In this case, individual sentences would not be separated for
analysis, and CV intervals across utterance boundaries would be treated in the same way as
those within sentences, e.g. the durational difference between /m/ and /ai/ would be
calculated in the same way in “…him. I…” as in “…my…”. This ensures that utterance final
lengthening is considered as part of the rhythm measure. This convention was not observed in
the current study, because the repetitive nature of the task led to considerable variation
between speakers in terms of how long the pause would be between repetitions, and thus also
of how much they slowed down towards the end of a sentence. In order to exclude the effects
of this inter-speaker variability, the rhythm score was calculated separately for each sentence
and then averaged to arrive at a single result. This method furthermore allowed the researcher
to investigate the impact of different articulatory patterns on rhythm metrics across the
repetitions.
1
Further information on the formulas and procedure applied for each measure can be found in the original source document referenced for the metrics in the introduction.
For Review Only
In addition to the rhythm metrics, articulation rate was measured in syllables/second by
dividing the number of syllables produced in each utterance by its duration, excluding any
intra-utterance pauses. Furthermore, the number of syllables produced by each participant
was noted.
The perceptual analysis consisted of listeners rating the normality of rhythm across all
repetitions, thus arriving at a single score between 1 (normal rhythm) and 5 (severely
disordered rhythm) for each speaker.
--- Insert Figure 1 around here ---
Experimental Task 2
Motor speech deficits are often assessed with a diadochokinetic (DDK) task where speakers
are asked to repeat single syllables, most commonly “pa, ta and ka”, as fast as possible for
around 5 seconds. This task requires the patient to produce speech with an unfamiliar timing
structure (isochronous syllable lengths), as well as at a faster than normal rate. Due to this
increased complexity, the task has the potential to highlight difficulties in timing control
which might not yet be obvious in more natural speech tasks. Traditionally, the focus of
analysis, whether in perceptual or acoustic research, is the rate of repetition, although some
researchers have also reported on variability (e.g. (36)). This task was included in the current
investigation to assess whether common methodological issues exist across two very distinct
tasks and measurement approaches
To assess the regularity of production in the DDK task, the same listeners as for task 1 scored
this feature on a 5 point scale, with 1 signalling normal and 5 highly irregular production. 3
For Review Only
This was done separately for each of the three syllables types. Acoustically, regularity was
quantified by measuring the coefficient of variation (COV) of syllable duration. The COV
was preferred over the standard deviation as a variability measure as is normalises for
differences in the mean, which was highly likely in the current participant group given that
speakers with motor speech disorders frequently show reductions in DDK rate. The acoustic
analysis was also conducted separately for each syllable type.
The procedure consisted of hand labelling syllable duration in Praat based on the
spectrographic and oscillographic signal. The measurement interval was defined as the period
from one consonant release burst to the next. The initial and final items of the syllable stream
were excluded from analysis, to reduce bias from speech initiation difficulties or final
lengthening effects.
Monologue
The monologue task was evaluated perceptually by the author, focusing in particular on
whether the segmental speech characteristics observed in the sentence repetition task were
reflected in spontaneous speech.
Statistical Analysis
Given the small sample size and the fact that some of the participants had a speech disorder,
non-parametric statistical tests were applied to the data. To perform 3-way group
comparisons (control, ataxic and hypokinetic dysarthria), the Kruskal Wallis Test was
applied, with Mann-Whitney-U-Test used for post-hoc analysis. In line with Nakagawa (37)
and Perneger (38) it was decided not to conduct a Bonferroni correction given the exploratory 3
For Review Only
nature of this investigation which necessitated the inclusion of a large number of variables.
Instead, statistical results were cross checked with individual speaker performance and
greater caution was exercised when interpreting positive statistical results to ensure any
differences identified the analysis were meaningful.
Results
Task 1 – Sentence Repetition
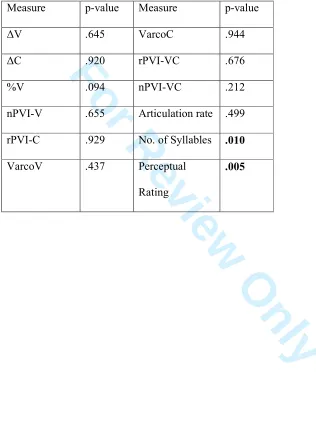
Table 3 summarises the results for the various rhythm measures, as well as articulation rate,
syllable count and the perceptual analysis of the speaker’s rhythmic performance for the three
groups for task 1. The statistical analysis demonstrates clear perceptual differences between
the disordered speakers and the control group (Table 4). Post-hoc analyses indicated
significant differences between the ataxia and control (p=0.024) as well as the hypokinetic
and control speakers (p=0.024), but not the two disordered groups (p = .072). In contrast,
none of the rhythm metrics yielded any significant group differences despite the fact that the
group means for both dysarthric groups tended to fall more towards the syllable timed end of
the spectrum (e.g. higher values for %V, lower values for nPVI-V, nPVI-VC or VarcoV,
Table 3). It is noteworthy that measures differed from each other in terms of how they
captured group performance. For example, the hypokinetic group displayed considerably
higher variability than the other two groups for nPVI-V, nPVI-VC and VarcoV, suggesting
that the lack of significant differences might have been due to within group variability.
However, this explanation does not apply to all measures equally, i.e. for the other metrics,
standard deviation values for the hypokinetic group are comparable to or even below those of
the other two groups. 3
For Review Only
The only other significant result was yielded by the syllables count variable, with lower
values for speakers with dysarthria, indicating that they omitted syllables inappropriately.
- insert table 3&4 around here ---
This latter result suggested significant differences in articulatory performance in the
dysarthric group, and this was therefore investigated further to assess whether particular
speech characteristics might have impacted on the results of the rhythm metrics. The analysis
also served to examine the second research question, i.e. whether methodological issues
might have affected the results. A number of interesting issues were identified, which are
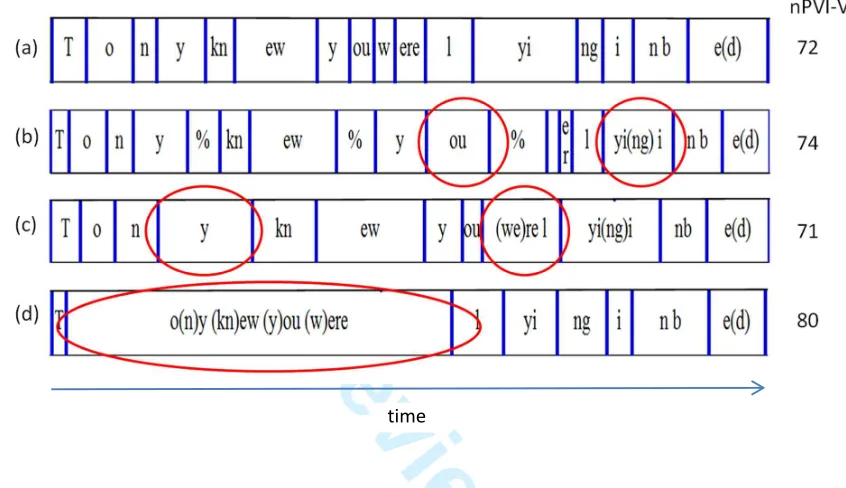
illustrated in Figure 2. The figure represents a time-aligned map of segment durations (i.e.
overall sentence durations were equalised whilst maintaining the timing relationships of
individual segments) for one control and three disordered speakers, based on the Praat
labelling of consonantal and vocalic intervals performed for the metric analysis (cf. Figure 1).
In addition, the speaker’s nPVI-V score is listed. Given the large number of metrics
investigated in this study it was not possible to represent all results in the figure. As none of
the metrics performed better than others in terms of differentiating disordered speakers from
healthy controls, the choice was based on the fact that the nPVI-V is the most frequently
reported measure in clinical research to date, and results can thus be more easily related to
previous studies.
--- insert Figure 2 around here --- 3
For Review Only
The figure shows the data of only one control speaker as it was not possible to present mean
group performance in this format. The selection of this particular individual was based on the
fact that she performed close to the group mean for the nPVI-V and in addition, showed the
expected vowel duration pattern, i.e. vowels with strong beats were long (Tony knew you
were lying in bed), and the remaining vowels were short. Exceptions to this pattern were the
/i/ in “Tony”, where the inherent nature of the vowel did not allow for as much reduction as in the other syllables. In addition, the /ɛ/ in “bed” was longer than might be expected due to phrase final lengthening. All control speakers consistently omitted the second syllable in
“lying”, which was produced as a single syllable i.e. /lɑɪŋ/.
The comparison of this pattern with the disordered speakers highlights a number of
differences. Speakers (b) and (c), who had ataxic dysarthria, clearly produce deviating vowel
durations compared to the normal pattern by lengthening unstressed syllables (“you” in
speaker (b) and “Tony” in speaker (c)), the latter actually leading to a reversal of the normal
timing relationship for “Tony”. A slightly different version of timing shift can be found in the
sequence “knew you were”. The two vowels in “you” and “were” in the control speaker were
relatively similar, but there was a contrast between “knew” and “you”, leading to a
“long-short-short” pattern. On the other hand, the lengthening of “you” observed in speaker (b)
reduced the contrast between “knew” and “you”, but at the same time increased the
difference between “you” and “were”, resulting in a “long-long-short” pattern. In all of these
examples, the degree of variability between successive vowels was thus maintained despite
clear deviations from normal speech rhythm.
A different feature that could be expected to affect the rhythm metrics was the deletion (or
elision) of segments and syllables. For example, both speaker (b) and (c) elided the
unstressed word “in”. This resulted in two long vowels appearing next to each other instead
of the long-short-long sequence apparent in the control speaker. Speaker (c) shows another 3
For Review Only
example of this with the elision of “were”, i.e. “you were” is inappropriately reduced to the
single syllable “you’re”.
These features were not restricted to the sentence repetition task but were also underlined in
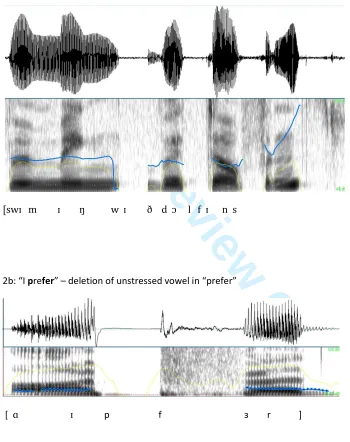
the speakers’ naturalistic speech data. Figure 3 a & b present further examples of segment or
syllable deletion, i.e. the word “prefer” loses the “re” in the first syllable, creating a new “pf”
consonant cluster and reducing the word to a single syllable. This had the added effect of
reducing the variability between successive vowels, i.e. the long – short – long patters of “I
prefer” is reduced to two adjacent long vowels. The reduction of “accommodation” to
“komdeish” is an even more severe example of this process, effectively deleting three of the
five syllables in the word and again only maintaining the two long vowels.
Figure 2c, on the other hand, is a further example of the inversion of expected vowel
duration. The sentence “swimming with dolphins” has stress on the first syllable in the first
and final word, with the expectation that the vowels in these syllables should be slightly
longer than those in the unstressed parts of the word. However, in this speaker the stressed
vowels are between 86 and 100 ms long, whereas the unstressed ones last between 112 and
133 ms. This results in the perceptual impression that the person is stressing the wrong
syllable (i.e. “-ming”, and “-phins”).
--- insert Figure 2 around here ---
The final speaker in Figure 2 demonstrates a very different speech characteristic which
clearly impacted on the rhythm metric, resulting in a considerably higher nPVI-V result than 3
For Review Only
for the other speakers. Speaker (d) had PD rather than ataxia, and presented with problems
with segmental production, which resulted in her omitting all consonants and merging five
separate syllables into one continuous vowel. This is a common problem in speakers with PD
whose reduced speed and range of movement can cause stops and fricatives being replaced
by approximants, or in severe cases being completely elided with only vowels remaining, as
evidenced in the first part of speaker (d)’s utterance. Although the number of syllables could
be identified perceptually through the change in vowel quality, the methodology for the
acoustic rhythm metrics prescribes that consecutive vowel or consonant intervals should be
labelled as one unit, thus resulting in an excessively long vocalic period for this speaker. The
resulting difference in length to the neighbouring syllable leads to the high nPVI-V result.
The impact of this segmentation rule becomes apparent when it is ignored and the different
vowels are separated, in which case the speaker’s nPVI-V value drops to 66, i.e. below rather
than above the control mean. It should be noted that this method was not without its problems
either though, as the separation of the vowel into distinct segments introduced an element of
unreliability given the poor acoustic landmarks available to identify the boundaries between
different vowels.
Task 2 – Syllable Repetition
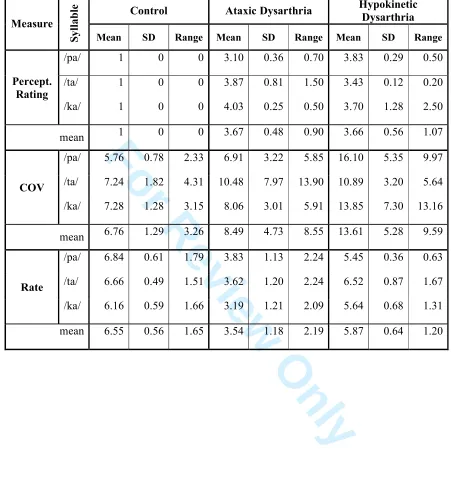
Table 5 summarises the results for the analysis of the DDK tasks, indicating the perceptual
rating, the variability measure (COV), and the rate of articulation. In addition, the means for
all three syllable types are indicated, as these were pooled for the purpose of reducing the
number of comparisons for the statistical analysis (this was deemed appropriate as they
essentially represented the same speech task and no particular syllable stood out as eliciting
specific behaviours that could not be observed in the others. 3
For Review Only
--- insert table 5 around here ---Despite the elevated group means suggesting more variable behaviour in the dysarthria
speakers, the results of the Kruskal Wallis Test did not indicate any significant difference for
the variability meassure (COV, p= .101). However, the perceptual evaluation and articulation
rate separated the control speakers from the dysarthric groups (p = .009 for both variables,
post-hoc analyses showed significant results for comparisons between the control and either
of the dysarthria groups (p = .024)). Although the hypokinetic participants showed a
considerably different mean rate to the ataxic speakers, the post-hoc analysis only just
confirmed this (p = .05).
Following the renewed mismatch between the perceptual evaluation and speech timing metric
for this task, further qualitative evaluation of the acoustic data was performed again, paying
attention to clarity of syllable production, as well as intensity and F0 variability between
successive syllables. Figure 4 presents some examples of the kinds of issues this analysis
highlighted. The first speaker (1) is a control participant, demonstrating relatively regular
durations intensity peaks and F0 levels, with clear separation of syllables. In comparison,
speaker (2), who had ataxic dysarthria, shows a lot more variability in her F0 performance
and speaker (3), a participant with hypokinetic dysarthria, shows highly variable intensity
peaks. Finally, speaker (4) shows behaviour typical for PD in that he accelerates towards the
end of the utterance despite having been quite regular initially. In addition, he also presented
with reduced clarity of syllable production, particularly during the acceleration period, which
is shown by the less defined gaps between syllables.
Although each of the disordered speakers displayed a degree of durational variability in
addition the above features (see speaker (3) in particular), this was not sufficient to take them
into the abnormal range, as control speakers were not completely regular in their repetitions 3
For Review Only
either (note for example the shorter 3rd syllable for speaker (1)). It could therefore be
hypothesised that the listeners based their judgements not only on durational regularity, but
might also have been influenced by other factors such as those described above, thus leading
to the mismatch between perceptual results and the COV measure.
Discussion
This paper aimed to explore the degree to which acoustic rhythm metrics in their current form
are able to reflect the nature of impairment in people with motor speech disorders and
whether their results might be affected by measurement conventions, in an attempt to better
understand how applicable existing rhythm metrics are to the analysis of disordered speech.
The results showed that there was poor relationship between the acoustic and perceptual
measures in that none of the metrics applied captured the differences between control and
disordered speakers that had been identified perceptually by the listeners. There was also
some suggestions that in at least some cases, certain dysarthric speech symptoms such as
inappropriate duration, segmental articulation errors or changes in intensity and F0
modulation either influenced the results of the metrics directly or affected listener perception
of rhythm, thus leading to the mismatch between the two types of analyses. These findings
have implications for the use of acoustic based metrics to characterise speech performance in
disordered populations, suggesting that care needs to be taken in the interpretation of these
results and additional analysis methods might need to be employed to arrive at a valid
characterisation of a speaker’s performance. 3
For Review Only
The lack of differentiation between groups by the rhythm metrics in task 1 was unexpected,
given that speakers had been selected on the basis that they perceptually presented with
rhythmic deviance. The current findings contradict earlier studies which demonstrated good
sensitivity of the investigated rhythm metrics to different types of speech impairments (20) as
well as significant correlations between at least one of the measures applied here (nPVI-V)
and perceptual ratings of disordered speakers (28). On the other hand they confirm Kim et
al.’s (27) findings, as these authors also failed to differentiate disordered from healthy
speakers with their PVI measure. Small sample size and intra-group variability are frequently
cited as reasons for lack of statistical significance, both of which can be said to apply in the
current study. There is certainly a possibility that a larger sample group would have resulted
in more affirmative group differences for the rhythm metrics. In addition, one could argue
that the highly repetitive nature of the task might have influenced results in some way,
leading to a loss of distinction between speakers groups. The results reported by Henrich et
al. (28) could support this conclusion as they also observed that groups differed from each
other in some but not other tasks. Irrespective of these explanations, the issue remains that
there was a considerable mismatch between the acoustic and perceptual analysis. More
importantly, this study identified a number of issues that appeared to affect way rhythmic
deviations were captured by the metrics. These would apply even in cases where these
metrics did highlight differences to healthy speakers, and it is thus important to consider them
in future research as well as clinical practice.
Two patterns in particular were identified in the sentence repetition as well as the
spontaneous speech task, i.e. changes to vowel duration and segment deletion. As already
described in the results section, they both caused changes to the normal speech timing
pattern, however, they could not be captured equally well by the metrics. The effects of
segment deletion, resulting in the proliferation of stressed syllables and thus less durational 3
For Review Only
differences between successive vowels, should become apparent in the rhythm metrics. On
the other hand, the observed changes to vowel changes can have a more serious effect on
rhythm measures, particularly if the speaker is so severely impaired that the normal timing
relationships are reversed. Rhythm metrics solely focus on the duration of vowels,
irrespective of whether their relative timing is correct or not, hence they might yield results
within the normal range even in cases where speakers are producing highly inappropriate
patterns. It should be noted that none of speakers produced exclusively one or the other of the
described speech deviances, and parts of the utterance were always produced correctly. This
could be another contributing reason why the rhythm metrics did not show the expected
group differences as the effects of the various types of speech deviations the metrics
cancelled each other out.
Whilst there are currently no other published clinical data available to my knowledge that
report on mismatches between acoustic and perceptual results, there are some parallels from
findings in crosslinguistic investigations of rhythm. Arvaniti (39) observed that different
types of accented English were classified into the same rhythm category despite diverse
speech patterns, e.g. English materials spoken by native Korean and Spanish speakers were
both classified as syllable timed according to the rhythm metric results, but this was
attributable to phrase-final lengthening by Korean speakers as opposed to lenition of
intervocalic consonants by Spanish participants.
Both the current and Arvaniti’s results thus highlight the possibility that metrics might not
pick up on rhythmic differences that are perceptually evident. However, they also suggest
that this problem could be solved by crosschecking results with an additional articulatory
analysis of the participants’ speech. This conclusion does not only impact on research
methods but also has significant implications for effective clinical practice. For example, it
has already been discussed that syllable deletion could make the rhythm metric suggest a 3
For Review Only
more syllable timed rhythm. This result sits well with previous research, particularly into
ataxic dysarthria, which is characterised as displaying equalised syllable durations (2, 20, 28).
However, this is often assumed to be due to a lengthening of unstressed syllables and not
syllable deletion. The correct identification of the underlying reason for the observed acoustic
and even perceptual findings is very important for clinical decision making, as the treatment
strategies for addressing inappropriate vowel length are distinct from those maximising
articulatory accuracy and wrong assumptions made about the nature of the problem could
lead to ineffective treatment of the disorder.
The current data furthermore highlight that it is important to consider the overall speech
context in the detailed evaluation of the data rather than particular errors in isolation. As
indicated in Figure 2, both speaker (b) and speaker (c) lengthened unstressed syllables (e.g.
“you” (speaker (b)) or “Tony” (speaker (c)). However, there is an important distinction
between the patterns produced by these two speakers. Speaker (c) inappropriately lengthened
a weak syllable, giving “To-” and “-ny” equal emphasis (cf. “swimming” in Figure 3a), and
thus presented with the syllable timed speech commonly associated with ataxic dysarthria.
On the other hand, the changes in speaker (b) could at least partly be attributed to phrase final
lengthening as she inserted a pause after “you” (Figure 2). Again different treatment
approaches would be warranted depending on the reason for the unnatural lengthening of the
unstressed syllable. That is, treatment might focus on phrasing and pause placement in
speaker (b) to reduce the amount of intrusive phrase final lengthening, whereas speaker (c)
might benefit more from exercises aimed at producing appropriate distinctions between
stressed and unstressed syllables. 3
For Review Only
Further problems specific to clinical data were highlighted by the speech patterns of speaker
(d) (Figure 2) who fused several words into one long vowel. These data highlight that
segmentation issues have to be considered carefully when applying rhythm metrics to
disordered populations, i.e. the choice of data labelling method impacted on whether this
speaker was described as a producing a higher or lower degree of variability between
successive syllables. It could even be argued that the application of a metric was not
appropriate in her case. Whilst she represented an extreme example of how disordered speech
features might require methodological adjustments in order for rhythm metrics to remain
valid reflections of speech timing, there might have been other more subtle issues that also
had an impact on the acoustic results, potentially providing further explanations for the lack
of group differences observed for the rhythm metrics. Again a more detailed analysis of the
speech data in addition to acoustic metrics and perceptual analysis might help to highlight
any methodological issues arising from the particular rhythmic features of speaker.
Similar to the sentence repetition task, the DDK data also showed less group differences than
had been anticipated on the basis of previous research. Irregular syllable repetitions in DDK
tasks are frequently quoted as strong diagnostic markers of speech disturbances in speakers
with dysarthria. Yet again, the current group of participants did not show the expected
increases in durational variability indicated by the results of the perceptual analysis. More
detailed investigation of these data revealed two possible methodological issues. A number of
speakers presented with reduced clarity of syllable production, particularly irregular release
bursts for the stop consonants and less clear boundaries between syllables, which could have
produced the perceptual impression of irregular rhythm. In addition, some speakers showed
differences in their intensity and F0 performance, which was more irregular than in the
control participants. It is thus possible that listeners perceived rhythmic disturbances not 3
For Review Only
because of irregularities in timing between successive syllables per se, but due to other
compounding speech disturbances such as inconsistencies in intensity and F0 production, and
reduced articulatory accuracy.
The concept of intensity and F0 influencing the perception of rhythmic disorder is interesting
in that it reflects similar discussions in the crosslinguistic arena. A number of researcher now
argue that defining rhythm in terms of timing is a somewhat flawed concept, and that instead,
other features such as F0 or intensity patterns, as well as speech rate need to be taken into
account (31), (40), (41). Arvaniti (31) furthermore calls for a reconsideration of Dauer’s (42)
arguments to view rhythm as a function of stress placement. Stress is based on prominence
(realised through changes in duration, F0 and intensity) rather than only temporal patterns.
This suggestion sits well with the current data, as stress production is a prominent area of
disturbance in speakers with dysarthria, and recent research into disordered intonation has
highlighted that these speakers tend to produce shorter phrases and overaccentuate, i.e. place
more pitch accents into utterances than healthy controls (43, 44). In addition, Lowit et al. (45)
have already demonstrated a link between intonational and rhythmic disturbance in an
exploratory study involving speakers with ataxia. In view of the evidence presented by
research into unimpaired as well as disordered speech there is thus an argument to investigate
rhythm beyond the confines of speech timing features.
In summary, the results of the current investigation lend further support to the need for a
multi-layered approach to characterising rhythmic performance in a clinical context. This
means that it is not sufficient to only capture timing characteristics without considering how
these tie in with intensity and F0 production to create the rhythmic patterns of the observed
speech sample. In addition, the present data suggest that measurement conventions developed 3
For Review Only
with unimpaired speech data might need to be evaluated carefully to determine their
appropriateness for the analysis of disordered populations. Finally, the results highlight the
value of a detailed analysis of segmental speech performance and the context in which they
occur, in order to (1) validate the results of the perceptual and acoustic analyses, (2) arrive at
appropriate conclusions of why speakers are identified as presenting with disordered rhythm,
which will inform future research studies and aid clinicians in their decision making.
Whilst not under direct investigation in this study, the results raise some further questions
that could be the focus of future research. First, the effects of abnormally short utterance
lengths and the associated increase in phrase final lengthening on rhythm metrics are one area
that might benefit from further investigation, particularly as shorter utterances are prolific
amongst most types of MSD. Second, although many rhythm metrics are normalised for rate,
the effects of rate variation on rhythm would also benefit from further investigation, to better
understand which abnormalities observed in disordered speakers are due to actual motor
control deficits, and which can be attributed to reductions in articulation rate. Finally, the
current study did identify group differences in relation to the number of syllables produced,
which presented the only other variable besides the perceptual ratings to yield statistically
significant results. This measures clearly ties in with the observed feature of syllable deletion.
Whilst it is by no means suggested that this variable could replace rhythm metrics to capture
speech timing characteristics, it would be interesting to investigate its clinical diagnostic
value, as it is a relatively simple and fast measure to perform and does not required
specialised software or analysis skills, unlike the rhythm metrics. 3
For Review Only
ConclusionIn conclusion, the field of rhythm research still has far to go in terms of establishing a valid
and reliable suite of measurement tools that can capture the intricate differences between
languages or between disordered and unimpaired speakers. Although each of the findings
discussed above needs to be interpreted with caution due to the small number of participants
as well as listeners included in the experiments, this detailed investigation has highlighted a
number of issues that question the validity of existing quantitative approaches to the study of
disordered rhythm to at least some degree and stresses the importance of more detailed
analysis than is common in both research and clinical practice to ensure the correct
conclusions are drawn and appropriate clinical decisions are made.
In particular, any future tool needs to look beyond timing as the only measurement parameter.
In addition, more work is necessary to better understand performance variations, particularly
those caused by speaker individuality and the structure of the speech materials. Given the
similarities in the concerns that have been raised about current methods in both the theoretical
and applied field, it appears sensible to ensure that future advances in either field of research
take cognisance of the issues raised in the other.
Acknowledgements
I would like to extend my thanks to all participants in this research, and to Frits van Brenk for
providing some of his data for further analysis. The collection of the original data was
supported by a Scottish Funding Council Studentship Award. 3
For Review Only
References1. Darley FL, Aronson AE, Brown JR. Differential Diagnostic Patterns of Dysarthria. J Speech Hear Res. 1969;12(2):246-69.
2. Duffy JR. Motor Speech Disorders - Substrates, Differential Diagnosis, and Management. 3rd ed. St. Louis: Elsevier, Mosby; 2013.
3. Skodda S, Visser W, Schlegel U. Vowel Articulation in Parkinson's disease. Journal of Voice. 2011.
4. Tanaka Y, Nishio M, Niimi S. Vocal Acoustic Characteristics of Patients with Parkinson's Disease. Folia Phoniatrica et logopaedica. 2011;63(5):223-30.
5. Huber JE, Darling M. Effect of Parkinson's Disease on the Production of Structured and Unstructured Speaking Tasks: Respiratory Physiologic and Linguistic Considerations. Journal of Speech Language and Hearing Research. 2011;54(1):33-46.
6. Martinez-Sanchez F. Speech and voice disorders in Parkinson's disease. Rev Neurologia. 2010;51(9):542-50.
7. Blanchet PG, Snyder GJ. Speech Rate Deficits in Individuals with Parkinson's Disease: A Review of the Literature. Journal of Medical Speech-Language Pathology. 2009;17(1):1-7.
8. Ackermann H, Graber S, Hertrich I, Daum I. Phonemic vowel length contrasts in cerebellar disorders. Brain and language. 1999;67(2):95-109.
9. Ackermann H, Hertrich I. Speech rate and rhythm in cerebellar dysarthria: an acoustic analysis of syllabic timing. Folia Phoniatrica et Logopaedica. 1994;46(2):70-8.
10. Schalling E, Hammarberg B, Hartelius L. Perceptual and acoustic analysis of speech in individuals with spinocerebellar ataxia (SCA). Logopedics Phoniatrics Vocology. 2008;32(1):31-46. 11. Kent RD, Kent JF, Duffy JR, Thomas JE, Weismer G, Stuntebeck S. Ataxic dysarthria. Journal of Speech, Language and Hearing Research. 2000;43(5):1275-89.
12. Wang Y, Kent R, Duffy J, Thomas J. Analysis of diadochokinesis in ataxic dysarthria using the motor speech profile program. Folia Phoniatr Logop. 2009;61(1):1-11.
13. Darley FL, Aronson AE, Brown JR. Clusters of Deviant Speech Dimensions in the Dysarthrias. J Speech Hear Res. 1969;12(3):462-96.
14. Pike K. The intonation of American English. Ann-Arbor: University of Michigan Press; 1945. 15. Lloyd James A. Speech signals in telephony. London: Pitman&Sons; 1940.
16. Ramus F, Nespor M, Mehler J. Correlates of linguistic rhythm in the speech signal. Cognition. 1999;73:265–92.
17. White L, Mattys SL. Calibrating rhythm: First language and second language studies. J Phonetics. 2007;35:501-22.
18. Low EL, Grabe E, Nolan F. Quantitative characterizations of speech rhythm: “Syllable-timing” in SingaporeEnglish. Language and Speech. 2000;43:377-401.
19. Grabe E, Low EL. Durational variability in speech and the rhythm class hypothesis. In: Warner N, Gussenhoven C, editors. Papers in Laboratory Phonology Berlin, Germany: Mouton de Gruyter; 2002. p. 515–46.
20. Liss JM, White L, Mattys SL, Lansford K, Lotto AJ, Spitzer SM, et al. Quantifying speech rhythm abnormalities in the dysarthrias. Journal of speech, language, and hearing research. 2009;52(5):1334-52.
21. Deterding D. The measurement of rhythm: a comparison of Singapore and British English. J Phonetics. 2001;29(2):217-30.
22. Fant G, Kruckenberg A, Nord L. Durational Correlates of Stress in Swedish, French and English. J Phonetics. 1991;19(3-4):351-65.
23. Stuntebeck S. Acoustic analysis of the prosodic properties of ataxic speech. Madison: University of Wisconsin; 2002.
For Review Only
24. Wang Y-T, Kent RD, Duffy JR, Thomas JE, Fredericks GV. Dysarthria following Cerebellar Mutism Secondary to Resection of a Fourth Ventricle Medulloblastoma: A Case Study. Journal of Medical Speech-Language Pathology. 2006;14(2):109-22.
25. Liss J, Spitzer S, Lansford K, Choe Y-k, Kennerley K, Mattys S, et al. Quantifying Speech Rhythm Deficits in Dysarthria. The Journal of the Acoustical Society of America. 2007;121(5):3134-5. 26. Hartelius L, Runmarker B, Andersen O, Nord L. Temporal speech characteristics of individuals with multiple sclerosis and ataxic dysarthria: 'scanning speech' revisited. Folia Phoniatrica et Logopaedica. 2000;52(5):228-38.
27. Kim Y, Kent RD, Weismer G. An Acoustic Study of the Relationships Among Neurologic Disease, Dysarthria Type, and Severity of Dysarthria. J Speech Lang Hear Res. 2011;54(2):417-29. 28. Henrich J, Lowit A, Schalling E, Mennen I. Rhythmic Disturbance in Ataxic Dysarthria: A Comparison of Different Measures and Speech Tasks. Journal of Medical Speech Language Pathology. 2006;14(4):291-6.
29. Renwick MEL. What Does %V Actually Measure? Cornell Working Papers in Phonetics and Phonology. 2012;3:1-20.
30. Wiget L, White L, Schuppler B, Grenon I, Rauch O, Mattys SL. How stable are acoustic metrics of contrastive speech rhythm? Journal of the Acoustical Society of America. 2010;127:1559–69. 31. Arvaniti A. The usefulness of metrics in the quantification of speech rhythm. J Phonetics. 2012;40(3):351-73.
32. van Brenk F, Lowit A. The relationship between acoustic indices of speech motor control variability and other measures of speech performance in dysarthria. Journal of Medical Speech Language Pathology. 2012;20:24-9.
33. Mioshi E, Dawson K, Mitchell J, Arnold R, Hodges JR. The Addenbrooke's Cognitive Examination Revised (ACE-R): A brief cognitive test battery for dementia screening. International Journal of Geriatric Psychiatry. 2006;21:1078-85.
34. Smith A, Goffman L, Zelaznik HN, Ying G, McGillem C. Spatiotemporal stability and the patterning of speech movement sequences. Experimental Brain Research. 1995;104:493-501. 35. Boersma P, Weenink D. Praat - doing phonetics by computer [www.praat.org]. 1992-2013. 36. Kent RD, Kim YJ. Toward an acoustic typology of motor speech disorders. Clinical Linguistics and Phonetics. 2003;17(6):427-45.
37. Nakagawa S. A farewell to Bonferroni: the problems of low statistical power and publication bias. Behavioral Ecology. 2004;15:1044-5.
38. Perneger TV. What’s wrong with Bonferroni adjustments. British Medical Journal. 1998;316 1236-8.
39. Arvaniti A. Rhythm, Timing and the Timing of Rhythm. Phonetica. 2009;66(1-2):46-63. 40. Nolan F, Jeon H-S. Speech rhythm - a metaphor? PhilosTransRSocLond B BiolSci. in press. 41. Tilsen S, Arvaniti A. Speech rhythm analysis with decomposition of the amplitude envelope: Characterizing rhythmic patterns within and across languages Journal of the Acoustical Society of America. 2013;134(628):628-39.
42. Dauer RM. Phonetic and phonological components of language rhythm. Proceedings of XIIth ICPhS. 1987:447–9.
43. Lowit A, Kuschmann A. Characterizing Intonation Deficit in Motor Speech Disorders: An Autosegmental-Metrical Analysis of Spontaneous Speech in Hypokinetic Dysarthria, Ataxic Dysarthria, and Foreign Accent Syndrome. J Speech Lang Hear Res. 2012;55(5):1472-84.
44. Kuschmann A, Lowit A, Miller N, Mennen I. Intonation in neurogenic foreign accent syndrome. Journal of Communication Disorders. 2012;45(1):1-11.
45. Lowit A, Kuschmann A, MacLeod JM, Schaeffler F, Mennen I. Sentence Stress in Ataxic Dysarthria - A Perceptual and Acoustic Study. Journal of Medical Speech - Language Pathology. 2010;18:77-82.
For Review Only
3For Review Only
Table 1: Summary of prominent rhythm metrics reported in the crosslinguistic literature
Measurement unit:
Vowel Consonant Syllable Stress group
%V (16) ∆V (16) VarcoV (17) PVI (18) nPVI-V (19)
∆C (16) VarcoC (17) rPVI-C (19)
VarcoVC (20) VI (21)
ISI (22) 3
For Review Only
Table 2: Participant informationParticipant Age Gender Diagnosis Intelligibility in % Medication
AD2 38 F FA 58
AD4 58 M SCA 8 47
AD5 44 F MS 72
HD9 54 M IPD 94 Madopar 8 × 50/12.5 mg;
Stalevo 8–10 × 0/200/200 mg
HD11 75 M IPD 72 Madopar 3 × 50/12.5 mg
Sinemet-Plus 6 × 25/100 mg
HD14 75 F IPD 88 Ropinirole 3 × 8 mg
Sinemet 1 × 50/200 mg Dysarthric
Group
mean: 57.3 SD: 15.4
3 male 3 female Control
Group
mean: 56.2 SD: 15.7
3 male 3 female
NA NA NA
Abbreviations: AD = ataxic dysarthria, HD = hypokinetic dysarthria, F = female, M = male, FA = Friedreich’s Ataxia, SCA = Spino-cerebellar Ataxia, MS = Multiple Sclerosis, IPD = idiopathic Parkinson’s Disease
NB: No intelligibility analysis was conducted for the control speakers as this measure served to indicate severity of dysarthria which was absent by default in the unimpaired speakers. 3
For Review Only
Measure Control Ataxic Dysarthria Hypokinetic Dysarthria mean SD range mean SD range mean SD range
∆V
0.08 0.02 0.05 0.09 0.04 0.07 0.07 0.01 0.02 ∆C
0.05 0.02 0.04 0.06 0.03 0.06 0.05 0.01 0.01 %V
53.58 1.11 2.47 55.40 2.15 3.87 57.39 2.37 4.38 nPVI-V
73.45 3.63 9.84 71.63 4.27 7.92 58.47 22.41 42.47 rPVI-C
0.05 0.02 0.05 0.05 0.03 0.06 0.04 0.01 0.02 VarcoV
56.47 5.76 17.47 51.78 3.68 7.29 49.23 15.30 30.19 VarcoC
48.86 12.02 29.86 44.60 16.34 32.46 45.68 10.54 20.21 rPVI-VC
0.14 0.03 0.08 0.16 0.08 0.15 0.13 0.02 0.04 nPVI-VC
60.97 6.42 17.65 51.24 3.16 5.70 50.64 12.00 22.43 Artic. rate
4.30 0.77 1.96 3.57 1.12 2.23 3.91 0.94 1.83 Syll. No.
8.03 0.08 0.20 7.20 0.53 1.00 6.60 0.87 1.60 Percep Rating 1 0 0 3.53 0.87 1.70 2.60 0.17 0.30
Table 3: Descriptive statistics for each of the measurement parameters split by participant group.