City, University of London Institutional Repository
Citation
:
Dykes, J. and Mountain, D. (2002). What I did on my vacation: spatio-temporal
log analysis with interactive graphics and morphometric surface derivative. Paper presented
at the GIS Research UK 10th Annual Conference (GISRUK 2002), 3 - 5 Apr 2002, Sheffield,
UK.
This is the unspecified version of the paper.
This version of the publication may differ from the final published
version.
Permanent repository link:
http://openaccess.city.ac.uk/417/
Link to published version
:
Copyright and reuse:
City Research Online aims to make research
outputs of City, University of London available to a wider audience.
Copyright and Moral Rights remain with the author(s) and/or copyright
holders. URLs from City Research Online may be freely distributed and
linked to.
City Research Online:
http://openaccess.city.ac.uk/
[email protected]
WHAT I DID ON MY VACATION: SPATIO-TEMPORAL LOG ANALYSIS WITH
INTERACTIVE GRAPHICS AND MORPHOMETRIC SURFACE DERIVATIVES
David Mountain and Jason Dykes
Geographical information Science Group, Dept IS, City University, Northampton Square, London, EC1V 0HB Tel +44 (0)20 7040 4044, Fax +44 (0)20 7040 8485, email {dmm,jad7}@soi.city.ac.uk
Abstract
Developments in computing and mobile communications mean that massive amounts of data are being produced. MacEachren & Kraak (2001) report that up to 85% of the million terabytes or so of digital data generated every year (Lyman et al., 2000) has a spatial component. This has at least two important consequences for GI science : more spatial data is being generated and new techniques are required to analyse and summarise it ; advantage may be gained from managing data that are not traditionally considered to be spatial in a geographic framework.
The research presented here focuses on the former issue. It may result in insight that is of benefit to those undertaking the latter with a view to providing location-based services (LBS) and the like.
1. The Problem
The developing influence of the global positioning system (GPS) and various forms of triangulation and other geo-referencing associated with mobile telecommunications mean that we are able to collect and are often inadvertently collecting masses of information about our locations in time and space. Plenty of applications exist for these data including : various levels of sophistication of location and user-dependent information provision (where am I? where am I going? what do I know? how familiar am I? what has changed since my last trip?), data synthesis and potentially explanation and prediction. A range of potential measurements exist to help us achieve these aims including : sinuosity, bearing, speed and rates of change. But in order to progress with the new forms of data and derive meaning from them we need to gain an understanding of what we are actually able to collect and how the data might be utilised. We also need techniques for summarising the masses of data that we collect.
Here a series of methods for extracting information from the kinds of logs of spatio-temporal activity recorded by mobile navigation and communication devices are presented and used to distinguish clear trends. These include interactive data sifting with the Location Trends Extractor (LTE), the use of feature networks derived from continuous density surfaces of recorded spatio-temporal activity and geocentric parallel plots that relate sequences of spatial locations to multivariate attributes of that space.
A number of sample logs have been recorded using GPS receivers. These range in spatio-temporal scope from distinct trips that last for only a few minutes, to a single week’s activity in a space of just a few kilometres radius to a period of a year in which intercontinental travel has occurred. Each contains a sequence of locations with an associated time-stamp. A number of the logs describe periods of vacation! We aim to describe and make inferences about ‘what we did on our vacations’.
2. Visualization : Working Towards a Solution
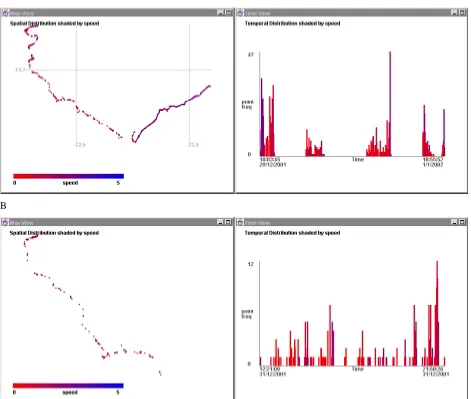
Indices such as absolute speed, direction, sinuosity and measurements of their variation can be derived using LTE. Graphical selection techniques have been incorporated to identify sections of activity with a particular speed, direction or sinuosity. Sudden changes in spatial co-ordinates, time or any of these derived indices can be used to identify break points between episodes of homogenous spatio-temporal behaviour. Conjectured activity can be measured from these episodes to summarise the likely means by which a user is travelling through time and space. Figure 1 demonstrates.
A
[image:3.612.72.543.157.556.2]B
Figure 1. Example visual output from the Location Trends Extractor
3. Spatio-Temporal Activity Surfaces and Morphometric Derivatives
The high frequency and precision associated with many data collection devices means that several iterations of spatial and temporal selection are often required when using LTE. Use of the software, familiarity with the data type and a need to summarise the information lead to the development of additional synoptic views in order to describe the data.
Density surfaces can be generated from sequences of spatio-temporal positions to reveal the frequency at which locations are visited. These overcome some of the perceived difficulties in detecting structure and form in large point clouds and enable us to infer the magnitudes of point densities.
An opportunity exists for detecting morphometric features from continuous fields such as density surfaces. These can be generated with appropriate analytical software (Wood, 1996). Topological networks of features can be derived from them (Pfaltz, 1976; Wolf, 1984). These descriptions can provide useful summaries of form for visualization (Bajaj et al., 1998). Such networks consist of peaks, pits, channels, ridges and saddles and determine the topology of continuous surfaces at specified scales. They summarise variations in surface form, indicating in this instance, variations in the regularity with which locations are recorded in a spatio-temporal log. Surface feature networks (SFNs) can be derived at a range of spatial scales resulting in the potential for multi-scale descriptions of the density surfaces of spatio-temporal activity.
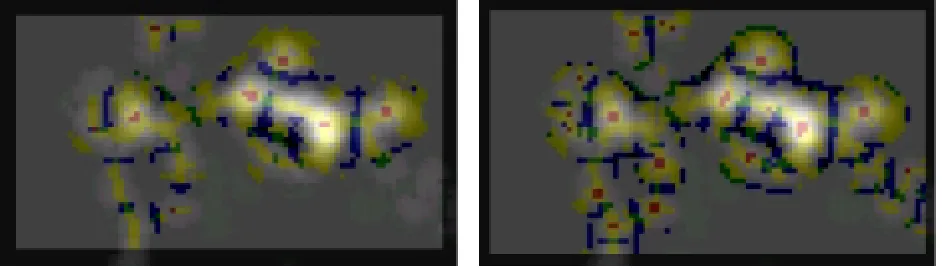
The first pair of images in figure 2 shows a cloud of points collected in a relatively continuous manner over a period of one week. The basic distribution is shown in figure 2a, whilst 2b adds some contextual information : the extent of the land and sea in the study area. A density surface is derived in figure 2c and shaded by varying brightness from dark (low density) to light (high density). Figures 2d-2f show the features that are detected from this surface at a range of spatial scales. Combining these with the brightness shaded density surface provides information about the surface magnitude as well as morphometry.
a) b)
c) d)
Figure 2 : A spatio-temporal log representing one week’s activity.
The log is shown as the original set of point locations, with and without contextual information, as a density surface, and a set of maps of features detected from the surface at a series of spatial scales. These latter maps are graphically combined with the density surface to show point density as well as features. The colours relate to peaks (red), ridges (yellow), channels (blue) and passes (green).
The topological geographies that result reveal peaks, ridges and channels relating to locations that are much visited, favoured navigation conduits between these and barriers that demarcate areas of inaccessibility. Places of interest and bases of activity are clearly identifiable, as are less favoured areas and the routes and boundaries between these. These features can be calculated at a range of spatial scales as shown in figures 2d-2f. In figure 2d the widest window has been used to detect features at a broad spatial scale (equivalent to twice the width of the dark border). The single red peak shown here represents the address used throughout this week of activity and the yellow ridges the main routes taken along the island on which the accommodation was located. Figure 2e shows the results of a mid-scale feature extraction. The peaks here represent key destinations and transportation nodes : home, shop, crossroads and two quays. The blue channels represent barriers to movement. Known features such as shallow water (shoals) and routes that could not be taken during the period of data collection due to temporary local access restrictions resulting from the foot and mouth epidemic of 2000. At the smallest scale (figure 2f), red peaks represent locations at which significant periods of time were spent. These include various beauty spots, beaches and picnic locations. The exact mapping between scale, feature and event/activity can only currently be deduced with additional knowledge of the data collected. But the fact that these surfaces reveal recognisable and important characteristics from a spatio-temporal record of points and can be generated at a range of temporal and spatial scales gives us cause to investigate the technique and undertake more rigorous analysis. The derivation of vector SFNs that describe the topological structure of the features provides an opportunity to summarise a relatively complex data type and use the data effectively to describe locations that are familiar to users, likely paths through space and known obstacles (whether tangible or due to habit). In combination with the LTE-type analysis we believe that an opportunity exists to infer various types of activity from these representations.
4. Data Synthesis
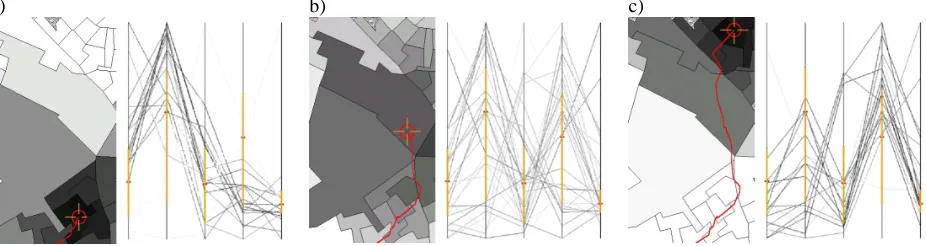
In figure 3, three images taken during a visualization session with the panoraMap software are shown. panoraMap aims to synthesize qualitative and quantitative geographic data in an interactive environment for visualization (Dykes, 2000). A series of area-based attributes are mapped and parallel co-ordinates plots produced. Interrogating the map results in real time changes in symbolism within the parallel plots visually emphasising the cases that are closest to the location that has been selected. A less freely specified sequence of locations can be loaded from a GPS log. In figure 3 the parallel plot is updated as a loaded GPS track is plotted. The changes in the distribution of darker lines on the parallel plot clearly shows spatial variation across the route recorded on the ground in the plotted attributes.
[image:6.612.77.540.173.296.2]a) b) c)
Figure 3: These three pairs of maps and geo-centric parallel plots show how the symbolism of the plot changes in relation to successive locations along a route recorded on the ground with a GPS receiver.
The red line on the maps represents the spatio-temporal activity; in this case a track log of a moving individual. Each has a target symbol (emphasised in red) identifying a particular location visited at a given point in time. The surrounding areas in which quantitative data have been recorded are shaded according to a centroid-based distance weighting function. Each (non vertical) line in the parallel plot represents one of these area units and is coloured with the same brightness as the area on the map (for units beyond a threshold distance, the faintness of the lines renders them non-visible on the parallel plot). The parallel vertical axes represent attributes of the population recorded in the census. In this example the five axes relate to rates of owner occupancy (1=outright ownership, 2=buying), proportions of the population living in rented accommodation (3=furnished, 4=unfurnished) and the percentage of households without access to private transportation (the 5th line furthest to the right). The geo-centric symbolism shows clear spatial structure in the multidimensional statistical space represented by the parallel plot, with very different profiles at the start, middle and end of the recorded route.
Figure 3a focuses on an area with relatively high levels of owner occupancy (high values for the 1st and 2nd axes) and few households without car ownership. As the track moves upwards through to figure 3c renting becomes the dominant form of tenure (high values for the 3rd and 4th axes) and the proportion of households without access to a car increases.
Such patterns are particularly apparent when the graphics are used interactively as the parallel plots swing and pulse as shading is updated for successive locations selected from the map or route. The technique can be extended to show greater numbers of independent variables.
5. Conclusion
formal incorporation of contextual data and more refined tools for navigation. Surface analysis also offers potential as information needs are likely to change according to elevation, viewshed, and a user’s arrival at significant morphometric features such as passes. And larger data sets will need to be mined as full histories are recorded for individuals and groups.
REFERENCES
BAJAJ, C., PASCUCCI, V. and SCHIKORE, D. (1998) Visualization of scalar topology for structural enhancement. Proceedings of IEEE Visualization, Research Triangle Park, NC, pp. 51-58.
CLEARY, S. (2002) Mobile phones: what the press says.
http://www.knorrcapital.com/pages/cenews/pm/psinv/psi062501.htm [online: 23/01/02]
DYKES, J. A. (2000) An Approach to Virtual Environments for Fieldwork Using Linked Geo-Referenced Panoramic Imagery, Computers, Environment and Urban Systems, 24(2), pp. 127-152.
http://www.geog.le.ac.uk/jad7/CE&US/ [online: 18/01/02]
IMFELD, S. (2000) Time, points and space: Towards a better analysis of wildlife data in GIS, Doctoral Thesis, Zurich, University of Zurich.
LYMAN, P., VARIAN, H. R., DUNN, J., STRYGIN, A. and SWEARINGEN, K. (2000) How much information? Executive summary. [online: 18/01/02]
http://www.sims.berkeley.edu/research/projects/how-much-info/summary.html
MACEACHREN, A. M. and KRAAK, M.-J. (2001) Research challenges in geovisualization, Cartography and Geographic Information Science, 28(1), pp. 1-12.
PFALTZ, J. L. (1976) Surface networks, Geographical Analysis, 8(1), pp. 77-93.
TAYLOR, G. (2000) GPS Tracks and Transportation Networks, in Halls, P. (Ed) GISRUK, York.
WOLF, G. W. (1984) A mathematical model of cartographic generalization. Geo-Processing, 2, pp. 271-286. WOOD, J. (1996) The Geomorphological Characterisation of Digital Elevation Models. Doctoral Thesis, Leicester, Department of Geography, University of Leicester.
BIOGRAPHY
David Mountain is a full-time researcher in the City University GI Science Group working on the EU funded Webpark project. He is also studying part-time for a PhD in the visualization and analysis of spatio-temporal information and has previously worked on the Hypergeo and Virtual Field Course projects. Prior to joining the GI Science Group, he acquired an MSc in GIS from Leicester University and a BSc in Geography from Leeds University.