Extraction of available and labile fractions of mercury from
1
contaminated soils: the role of operational parameters
2 3
Authors: Ana Teresa Reis1, Cláudia B. Lopes1, Christine M. Davidson2, Armando C.
4
Duarte1, Eduarda Pereira1 5
6
Address: 1CESAM/Chemistry Department, University of Aveiro, Campus
7
Universitário de Santiago, 3810-193, Aveiro, Portugal 8
2
WestCHEM, Department of Pure and Applied Chemistry, University of Strathclyde, 9
295 Cathedral Street, Glasgow G1 1XL, UK 10
11
Corresponding Author: Ana Teresa Reis (teresareis@ua.pt)
12
Phone: +351 234 370 737 13
Fax: +351 234 370 084 14
Abstract
15One of the recognized challenges in chemical extraction of mercury from soil is 16
the diversity of procedures that are current available in literature and that differ in 17
terms of the extractant solution used, soil:extractant ratio and duration of extraction. 18
Therefore, this study focused on establishing the role of operational parameters for 19
extraction of the available and labile fractions of mercury from soils, considering 20
different soil:extractant ratios and the kinetics of extraction. The suitability of 1.0 mol 21
L-1 ammonium acetate at pH 7 and 0.1 mol L-1 HCl as extractants for the available 22
fraction and the extraction of the labile fraction using 0.5 mol L-1 hydrochloric acid 23
*Manuscript
and 0.1 mol L-1 HCl; therefore both extractants can be used for estimating the 25
available fraction. It was also observed that a soil:extractant ratio of 1.5 g of soil to 26
100 mL of extractant favours mercury extraction. For the available fraction an 27
extraction of 30 minutes seems enough, as no further significant change was 28
observed in the quantity of mercury extracted thereafter. For the labile fraction 29
increase the extraction duration to at least 24 hours is recommended. 30
The data was fitted into kinetic models, and it was observed that the two first-31
order reactions and the diffusion models help to understand the behaviour of 32
mercury extraction from soil, clearly showing that in all cases the rate of mercury 33
extraction was faster in the first 10 hours and declined after that period. The 34
characteristics of the soil influenced the extraction of mercury, and it was verified that 35
pH and particle size of the soil influenced the mercury extraction process, as results 36
suggested that an acidic soil might have a reduced ability to strongly retain metals 37
and soils with higher porosity showed lower rates of mercury extraction. 38
39
Keywords: soil; mercury; fractionation; available fraction; labile fraction;
40
ammonium acetate; hydrochloric acid; extraction kinetics 41
1
Introduction
42
Mercury (Hg) is one of the most critical contaminants in the environment (Hissler 43
and Probst, 2006) and can be found in water, air, soils and sediments. 44
Anthropogenic inputs (mining, industry, sludge dumping, etc.) have increased its 45
natural concentration and led to contaminated environments (Hylander and Meili, 46
2003). Soils, in particular, can retain mercury for long periods of time and release it 47
initial deposition (Oliveira et al., 2007). Mercury can also enter and bioaccumulate in 49
the food chain, causing adverse health effects. These effects are intimately related to 50
the speciation (chemical form) and binding state (precipitated with primary or 51
secondary minerals, complexed by organic ligands, etc.) of the metal in soil, which 52
control its toxicity and mobility (Gleyzes et al., 2002). Hence the importance of 53
understanding mercury association and distribution in the solid fraction 54
(fractionation), which is usually accomplished by applying chemical extraction 55
procedures. These, however, have been widely criticized, with several recognized 56
limitations (Bacon and Davidson, 2008; Issaro et al., 2009). Still, despite the 57
development of alternatives to mercury speciation/fractionation, such as thermo-58
desorption (Biester and Scholz, 1997; Reis et al., 2012) and X-ray absorption 59
spectroscopy (Kim et al., 2000), the chemical extraction procedures continue to be 60
commonly used and are considered an essential tool in establishing element 61
fractionation in soils (Gleyzes et al., 2002). This is particularly important in the 62
assessment of the most bioavailable and toxic forms of the metal. 63
One of the major problems concerning mercury chemical extractions is the 64
variety of procedures available in literature (Issaro et al., 2009). The 3-step BCR 65
scheme remains amongst the most widely used sequential extraction schemes for 66
elements such as Cd, Cr, Cu, Ni, Pb and Zn (Bacon and Davidson, 2008) and, 67
although it has been applied to mercury fractionation in sediments (Sahuquillo et al., 68
2003), it has not been validated for this element. On the other hand, Han et al. 69
(2003) developed an extraction procedure, specific for mercury fractionation, that 70
divides mercury species according to their potential mobility in the environment. This 71
A common step in all sequential extraction procedures for soil targets the so-73
called exchangeable fraction, which is the more mobile and available fraction of the 74
metal in soil. A large number of extractants have been used to assess plant available 75
trace elements, including: i) chelating solutions, such as EDTA (Fangueiro et al., 76
2005); ii) salt solutions such as NH4Ac, MgCl2, or CaCl2, due to their capacity to 77
release Hg by ion-exchange (Gismera et al., 2004; Han et al., 2006); and iii) dilute 78
solutions of acid, such as for example HCl (Kashem et al., 2007). Amongst these, 79
the neutral (pH 7.00) 1.0 mol L-1 ammonium acetate (NH4Ac) extraction is one of the 80
most widely applied reagents for leaching the exchangeable fraction (Bondareva et 81
al., 2014; Filgueiras et al., 2002; Hagarová et al., 2003; Hass and Fine, 2010; Jing et 82
al., 2008; Nyale et al., 2014). Additionally, due to its strong complexing power, 83
acetate should prevent the re-adsorption or precipitation of the released metal ions 84
(Filgueiras et al., 2002). Use of 0.1 mol L-1 HCl has also been regarded to estimate 85
the available fraction of the metal in soil (Kashem et al., 2007). 86
Another approach is to determine in one step the labile fraction of the metal in 87
soil, by application of a single extraction procedure (Sutherland, 2002). This should 88
include the more available species, such as water-soluble, exchangeable, and 89
carbonate associated. Though this single extraction does not provided exactly the 90
same geochemical information as sequential extraction does, it provides enough 91
information about the more toxic and available species present in the soil, while it 92
has the advantages of being faster, cost-effective, and require less technical skill and 93
reagents (Sutherland and Tack, 2008). Of the numerous reagents that can be used 94
for extraction of the labile fraction, dilute HCl has been the most commonly applied 95
(Andrews and Sutherland, 2004; Snape et al., 2004; Sutherland, 2002; Sutherland 96
Besides the already discussed variety of extractants, other operational 98
conditions change as well, namely the soil:extractant ratio and the duration of 99
extraction. Soil:extractant ratio can vary from 1.0 g of soil per 100 mL of extractant to 100
20 g of soil per 100 mL of extractant, while the duration of extraction has been 101
reported to vary from 30 minutes to 18 hours (Biester and Scholz, 1997; Bloom et al., 102
2003; Boszke et al., 2006; Neculita et al., 2005; Panyametheekul, 2004; Renneberg 103
and Dudas, 2001). The extraction procedures needed to be optimized in order to 104
better reflect the reactions taking place in the environment and to recover the entire 105
target fraction. The kinetics involved in the extraction of mercury from soil have 106
occasionally been considered (Issaro et al., 2010; Reis et al., 2014), but there is still 107
shortage of information needed to help harmonize extraction procedures. Studying 108
the rate and extent of metal extraction from the matrix is important as on it depends 109
the fate, transport, and bioavailability of metals in soils. 110
Therefore, this study focused on establishing optimal procedural conditions for 111
extraction of the available and labile fractions of mercury from soils, considering 112
different soil:extractant ratios and the kinetics of mercury extraction from soils. The 113
soil’s characteristics and the origin of the contamination can influence the 114
fractionation as, usually, metals of anthropogenic origin tend to be in more readily 115
extractable fractions (exchangeable, carbonate bound, Fe and Mn oxide bound, 116
organic matter bound) and therefore are more labile, while metals of geogenic 117
occurrence are typically found in the residual fraction (Ratuzny et al., 2009). 118
Therefore, soil samples from an industrially impacted zone and from a mine area 119
Overall, this study intends to contribute to the understanding of mercury 121
behaviour in soil, and optimize crucial steps of mercury extraction procedures and of 122
soil toxicity assessment methods. 123
124
2
Materials and methods
125
2.1 Sampling sites and methodology
126
For this work, soils from two contaminated areas were chosen - Estarreja 127
(North-East Portugal) and Caveira (South-East Portugal). Mercury in Estarreja soils 128
results from the effluents of mercury-cells of a chlor-alkali plant (Reis et al., 2009), 129
while the latter is a mine area, situated in the Iberian Pyrite Belt (Barriga, 1990). 130
One sample was collected in an agricultural field close to a former effluent stream 131
of the Industrial Complex of Estarreja, where during more than 50 years a large 132
chlor-alkali plant operated using the mercury cell process (Ullrich et al., 2007). 133
Mercury-cell chlor-alkali plants have previously been identified as a major source of 134
mercury to the environment (Lacerda and Salomons, 1998; Ullrich et al., 2007). Due 135
to its persistency, the metal can still be found in Estarreja soils even after the plant 136
completely ceased the use of mercury in 2002 (Ospar Commission, 2006; Reis et al., 137
2009). The Caveira mine sample was collected at an agricultural field located near 138
the mine pit. The Caveira sulfide mine is situated in the Iberian Pyrite Belt (IPB), a 139
mining district of worldwide significance due to its unusual concentration of large and 140
medium sized mineral deposits, including ores of copper, iron, lead, sulfur and zinc. 141
Antimony, arsenic, cadmium, cobalt, gold, mercury, selenium and silver can also be 142
but the tailings are sill present in the surroundings and acid mine drainage 144
constitutes a problem. 145
Sampling was performed using a plastic spatula and samples were placed in 146
plastic bags for transport to the laboratory. The soil sampling depth was 0–15 cm. 147
Once in the laboratory, soil samples were air dried at room temperature to constant 148
weight. Stones were removed and soil clumps were crushed and homogenised 149
during the drying stage. The dried samples were sieved to < 2 mm using a nylon 150
sieve. The air-dry soil, < 2 mm fraction, was used for the chemical extraction 151
procedures. 152
153
2.2 Soils samples physical-chemical characterization
154
The soil pH (CaCl2) was determined using a WTW pH meter-538, according to 155
the ISO 10390:1994 method. Total carbon (TotC) was measured on an elemental 156
analysis instrument (LECO CNH-2000), according to ISO 10694:1995. For the 157
determination of organic carbon content (OrgC), an excess of 4 mol L-1 of 158
hydrochloric acid was added to a crucible containing a weighed quantity of soil. The 159
crucibles were left to stand for 4 hours at room temperature and then were digested 160
for 16 hours at 60-70°C to remove the organic carbon. The residue was then 161
analysed to give the inorganic carbon content, and organic carbon was calculated by 162
the difference. 163
The particle size distribution and clay contents of the soil samples were 164
determined using a Coulter LS230 laser diffraction particle size analyzer. The 165
classification of soils followed the USDA Texture Classes: sand fraction 166
Classification of samples was achieved by using the Talwin 42® classification 168
software program. 169
170
2.3 Procedures for chemical extraction of mercury from soil samples
171
For the experiments, the effect of leaching duration on metal extraction was 172
evaluated using the following solutions: 1.0 mol L-1 NH4Ac (pH 7.0), 0.1 mol L-1 HCl, 173
and 0.5 mol L-1 HCl. The first two solutions were used to study the available fraction 174
of mercury in soils (Jing et al., 2008; Kashem et al., 2007) and 0.5 mol L-1 HCl was 175
employed to assess the labile fraction of mercury (Sutherland and Tack, 2008). 176
For the three mentioned solutions, soil:extractant ratios considered were 1.5 177
g:100 mL (1.5:100), 10 g:100 mL (10:100) and 20 g:100 mL (20:100). As soils are 178
very heterogeneous media, samples were thoroughly homogenized prior to 179
weighting. The mixtures (12 g, 80 g, and 160 g of sample in 800 mL of extractant) 180
were shaken at room temperature (23±5 °C), using an e nd-over-end shaker at a 181
constant rate of 60 rpm, and all extractions were performed in duplicate. 182
Eight mL of the mixture were removed for analysis, using a syringe, at t=30 183
seconds, 15 minutes and 30 minutes, 1, 2, 4, 6, 18 and 24 hours, and then every 24 184
hours until equilibrium had been reached Care was taken in order to ensure that a 185
homogenous aliquot was removed from solution and that the soil:extractant ratio was 186
preserved in the remaining suspension. Removed aliquots were immediately filtered 187
through a 0.45 µm filter of cellulose type membranes (Millipore®, USA) and stored at 188
4°C until analysis (performed within 24 hours). 189
Possible variations in the pH could affect the extraction process and therefore, 190
192
2.4 Mercury quantification in soils and extracting solutions
193
Mercury contents in soils and in extracted solutions were determined by thermal 194
decomposition atomic absorption spectroscopy (AAS) with gold amalgamation 195
(LECO model AMA-254), as described by Costley et al. (2000). The system consists 196
of a nickel boat in a quartz combustion tube containing a catalyst in which the 197
sample is initially dried, prior to combustion at 750°C (150 seconds) in an oxygen 198
atmosphere (oxygen flow: 200 mL min-1). The mercury vapor produced is trapped on 199
the surface of a gold amalgamator. After a pre-specified time interval (120–150 200
seconds), the amalgamator is heated to 900°C to quanti tatively release the mercury 201
which is transported to a heated cuvette (120°C) prio r to analysis by AAS using a 202
silicon diode detector at 253.6nm. A quantification limit of 0.05 ng of mercury was 203
established. 204
205
2.5 Quality control and quality assurance of the results
206
Analytical procedures were conducted using ultra-clean glassware (previously 207
soaked in 5% Derquin for 24 hours; then 25%, HNO3 for 24 hours), to avoid 208
contamination of sample extracts. Care was taken to avoid cross-209
contamination of the samples. The extractant solutions were all tested and 210
found to be sufficiently low in mercury (less than 10 ng L-1) before use. 211
Quality control for the determination of total carbon in LECO CNH-2000 was 212
performed through the analysis of certified reference material Synthetic Mix for Soil 213
The accuracy of the Leco AMA-254 instrument was assessed daily by the 215
analysis of certified reference materials BCR CRM 142R (Light sandy soil; certified 216
Hg concentration: 0.067 mg kg-1) and RTC CRM 021 (Sandy loam; certified Hg 217
concentration: 4.7 mg kg-1). Mercury concentrations obtained were always within the 218
certified interval of confidence and recoveries were within the range 82–109% (n=16 219
for CRM 142R; n=12 for CRM 021). Because certified reference materials are not 220
available for mercury fractionation, it is not possible to check the accuracy of the 221
chemical extractions. 222
223
2.6 Chemical extraction data fitting
224
In order to perform the extraction data fitting, the results were expressed as 225
mercury extracted per unit of soil (mg kg-1) between extraction initiation time (t0) and 226
ti, and as a function of the volume of extractant solution (V) and sample mass (m). 227
228
Equation 1
229
230
The removal rate per unit time (mg kg-1 h-1), between extraction initiation time (t0) 231
and ti was determined as: 232
233
Equation 2 !"#$%"& ()*+,*,*- .
()*-/()*+ *-/*+
234
235
The data obtained for mercury extracted per unit of soil was modeled by 236
nonlinear regression analysis, using GraphPad Prism 5 (trial version) that uses the 237
adjusting the variables; this method blends the method of linear descent and the 239
method of Gauss−Newton. 240
The most common models used to fit data from metal extraction from soil, the two 241
first-order reactions model and the diffusion model, were used to fit the extraction 242
rate data. Each of the kinetic models was tested for data fitting. In order to assess 243
the goodness of the fit to the experimental data the coefficient of determination (R2) 244
and the standard deviation of residues (Sx/y) were determined. A relatively high R2
245
and low value of Sx/y were used as criteria for best fit. For each case, the fitting was 246
tested using the mean of the whole set of chemical extraction data. 247
248
2.6.1 Two first-order reactions model
249
This model has been regarded as the most appropriate model to explain the 250
kinetics involved in metal fractionation in soil (and sediment) (Fangueiro et al., 2005; 251
Issaro et al., 2010). It advocates that extraction of the metal from soil takes place in 252
multiple steps (first-order reactions) which reaction rates are independent from each 253
other. This implies that metals are bound to distinct sites available in soil, resulting in 254
a readily extractable (C1) and a less extractable (C2) metal fraction. In addition, the 255
total non extractable metal fraction (C3) can be estimated through the difference 256
between total mercury and C1+C2. The two first-order reactions model is described 257
as: 258 259
Equation 3 0 . 0121 3 "41*5 6 0721 3 "47*5
260
where and C2 (mg kg-1) are mercury concentration extracted in the first and 262
second stages, respectively, and k1 and k2 are the associated apparent rate 263
constants. 264
265
2.6.2 Diffusion model
266
The diffusion model assumes that the desorption of metals from the soil matrix is 267
initially fast but the rate is limited by the diffusion from the mineral lattice or the intra-268
particle diffusion from pores of inner soil surfaces (Gismera et al., 2004). According 269
to Gismera et al. (2004), the metal desorption rate of a solid fraction due to diffusion-270
controlled kinetics may be described as: 271
272
Equation 4
273
274
Where C is the removed metal concentration; Ceq is the metal concentration at the 275
equilibrium; t is the time; D is the diffusion coefficient; S is the surface area of the 276
solid particle, V is the solution volume; δ is the thickness of the diffusion layer around 277
the particle; and k is a constant of proportionality. Including the parameters D, S, δ
278
and V in the constant k and rearranging and solving Equation 4, a first-order 279
equation is obtained: 280
281
Equation 5
282
3 Results and discussion
284
3.1 Soil samples physical-chemical characteristics
285
The Estarreja sample has a total mercury content of 70.0 mg kg-1, and is 286
classified as loamy sand soil (sand 78%; silt 19%; clay 3%), with a pH of 6.0 and 287
total and organic carbon contents of 2.2% and 1.9%, respectively. 288
The Caveira sample has lower total mercury content and pH - 6.3 mg kg-1 and 289
3.3, respectively. Total carbon content is 4.1%, while organic carbon constitutes 290
3.5%, and the soil is classified as silt loam (sand 27%; silt 58%; clay 15%). 291
292
3.2 Mercury extracted from soil
293
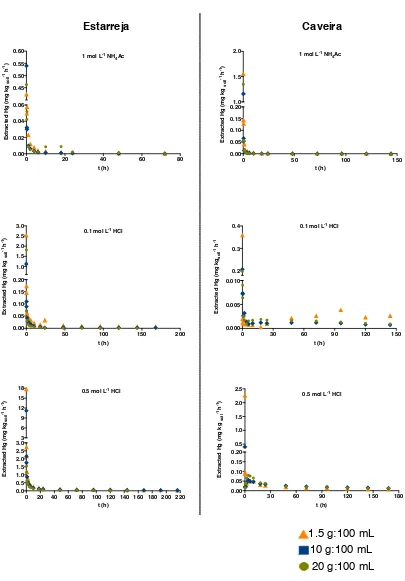
The amounts of mercury extracted per unit time are depicted in Figure 1, while 294
Table 1 presents the mercury extracted from the solid matrix per kg of soil, and the 295
percentage of extracted mercury (percentage of mercury extracted in comparison 296
with total mercury). In general, all the extraction curves are similar in shape, with a 297
fast extraction rate in the first 10 hours that becomes slower after that period. This 298
type of extraction rate data, with two distinct stages, has been observed in other 299
studies concerning metal extraction from soils (Bermond et al., 2005; Issaro et al., 300
2010; Reis et al., 2014; Varrault and Bermond, 2011). Studying extraction processes 301
in heterogeneous systems such as soils is therefore challenging, due to the 302
complexity of the matrix and the numerous components that it is constituted of. 303
These components interact with each other resulting in a multitude of sites for metal 304
sorption with different reactivity. In this context, the present study demonstrated that 305
mercury extraction from soil is associated with kinetically different compartments: 306
more exposed, reactive sites; and a second where the slower extraction of the metal 309
indicates its release from sites of relatively higher bonding energy that need more 310
time to dissociate, diffusion from the intricate mineral lattice or from pores of inner 311
soil surfaces that need more time to dissociate. It must be clarified though that these 312
compartments are only operationally defined and not related to soil compartments, 313
such as iron oxides or organic matter, for example. In terms of risks to the living 314
organisms present in the environment, the first stage (i.e. the metal that is extracted 315
in the first hours) has more impact because it is easily mobilized to the soil solution, 316
becoming readily available for plant uptake, contaminating crops or the aquatic 317
compartment. 318
The interpretation of the obtained results is next presented in order to highlight 319
the differences between extractants and the influence of soil:extractant ratio, 320
duration of extraction and soil sample physical-chemical characteristics. 321
3.2.1 Differences between extractant solutions
322
For the three extractant solutions studied, the percentage of mercury removed 323
from soil samples was higher when 0.5 mol L-1 HCl was applied, followed by 0.1 mol 324
L-1 HCl and 1.0 mol L-1 NH4Ac (Table 1). To evaluate the statistical difference among 325
the three extraction procedures, Friedman’s test, followed by post-hoc test for 326
pairwise comparison, was performed. The results presented in Table 1 show that 327
more mercury is extracted when using 0.1 mol L-1 HCl, when compared to 1.0 mol L -328
1 NH4Ac, and that the difference between extractant solutions is larger in Caveira 329
soil. As both these extractant solutions are used to estimate the available fraction of 330
metals in soil, the Friedman’s test was used and showed that there is a significant 331
10:100 and 1.5:100 ratios for the Estarreja sample. In other cases, the test did not 333
show statistical differences between extraction procedures. 334
The 0.5 mol L-1 HCl has frequently been used in single extractions of the labile 335
fraction of a metal in solid fraction (Sutherland and Tack, 2008), providing 336
information of environmental importance. As more mercury was extracted using this 337
solution when compared to the other two considered in this study (between 5 and 338
13% in Estarreja sample, and 21 to 33% in Caveira sample), this means that the 339
available fraction is only a small part of the labile fraction of mercury in the studied 340
soils. Friedman’s test revealed that results when applying 0.5 mol L-1 HCl are 341
statistically different from the ones obtained for the other two solutions (used to 342
estimate the available fraction; Table 2). 343
344
3.2.2 Influence of soil:extractant solution ratio
345
The effect of soil:extractant ratio is an important factor in metal removal from soils 346
but rarely considered in this kind of studies. The soil (g):extractant solution (mL) 347
effect was tested by comparing the ratios 1.5:100, 10:100, and 20:100. The data 348
here presented shows that mercury extraction from soil was favoured by lower 349
soil:extractant ratio, as the percentage of mercury removed from soil generally 350
follows the trend 1.5:100 > 10:100 > 20:100 (Table 1 and Figure 1); exceptions were 351
observed for the extraction with 1.0 mol L-1 NH4Ac in Estarreja soil and 0.5 mol L-1 352
HCl in Caveira soil. The Friedman’s test did not reveal statistical differences among 353
the three considered ratios (p=0.280; α=0.05). Therefore, soil:extractant solution 354
ratio does not seem to have a major effect in mercury extraction from these soils 355
liquid ratio possible to more efficiently leach the mercury species (Issaro et al., 358
2010), but in practice other implications must be considered. While in this study no 359
problems of reproducibility were experienced when using 1.5 g of sample to 100 mL 360
of extractant solution (therefore this ratio seems feasible), in fractionation studies the 361
choice of the ratio must assure the accurate weigh of small sample masses, that is 362
repeatable among replicates, i.e., representativeness of the sample. For example, 3-363
step BCR scheme applied by Sahuquillo et al. (2003) for mercury speciation in 364
sediments considered a solid:liquid ratio of 1:40 and an RSD lower than 10% was 365
obtained in most of the samples. Quantification of mercury in solution must also be 366
guaranteed. A higher concentration of metal in solution will result from the use of a 367
higher soil:extractant, which has the advantage of overcoming any potential 368
problems with detection limits of the instruments used for metal quantification. On 369
the other hand, higher soil:extractant ratios can lead to extractant saturation and can 370
also hinder the filtration process due to filter clogging. In the current work, when 371
using the 20:100 ratio, more than one filter was needed, meaning that the soil was in 372
contact with the solution for a longer time and increasing the procedures financial 373
costs. 374
375
3.2.3 Effect of time on mercury extraction from soils
376
Desorption and sorption of a metal in soil are time dependent phenomena, but 377
the mercury extraction kinetics from soil has rarely been studied. The results 378
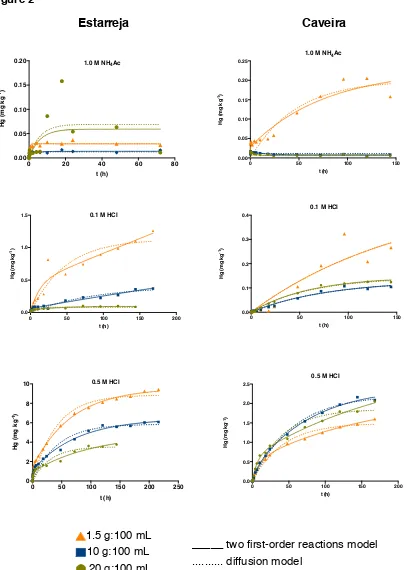
presented in Figure 2 show similar curve shapes for mercury extracted from both soil 379
samples by using the three extractants and the three considered soil:extractant 380
As already mentioned, the mercury extraction profile is made up of two different 382
stages: a fast extraction stage (t < 10 hours) and a relatively slower one (t > 10 383
hours). It is important to note that mercury extraction from soil is almost immediate, 384
as between 60 to 90 % of the total metal extracted occurs in the first 30 seconds. 385
When using 1.0 mol L-1 NH4Ac for mercury extraction, equilibrium was reached at 386
ca. 24 hours (which corresponds to the maximum quantity of mercury extractable by 387
this solution). For the extraction with 0.1 mol L-1 and 0.5 mol L-1 HCl, the reaction did 388
not reach equilibrium in either sample, even after 150 hours (Figure 2). For the 389
Caveira soil, the extraction with 0.5 mol L-1 HCl was extended to 216 hours (9 days) 390
and still the equilibrium was not reached. This suggests that, in acidic conditions, 391
mercury present in soil can be continuously released from the solid matrix into other 392
environmental compartments, such as water bodies. It also means that the duration 393
suggested in extraction procedures, usually 30 minutes to 1 hour (Han et al., 2006; 394
Kashem et al., 2007; Sutherland and Tack, 2008), may only estimate a portion of the 395
target fraction. The comparison of the percentage extracted at the end of the 396
experiment with the percentage extracted at 30 minutes revealed that for the 397
extractions with 1.0 mol L-1 NH4Ac and 0.1 mol L-1 HCl this difference is 0.45% in 398
Estarreja and 1.5% in Caveira. Therefore, it can be suggested that for the study of 399
the available fraction of mercury in soils using the two considered solutions, it would 400
be possible to use an extraction time of 30 minutes, without neglecting important 401
information. When using 0.5 mol L-1 HCl to estimate the labile fraction in soil, the 402
difference in percentage of mercury extracted at 1 hour reached 5.7 % and 7.8%, 403
respectively in Estarreja and Caveira soil samples, which suggests that it is 404
407
3.2.4 Fitting of kinetics data of mercury extraction from soil
408
To test for the fitting of the kinetic results, the mercury extracted per kg of soil 409
was plotted against time (Figure 2). The experimental data were fitted into the two 410
first-order reactions model (Equation 3), as this model considers the observed 411
biphasic extraction behaviour and, therefore, seemed appropriate for the dataset. 412
Because a diffusion mechanism may also be involved in mercury extraction, the 413
diffusion model (Equation 5) was tested as well. The kinetic parameters are 414
presented in Tables 3 and 4. As can be seen, the R2 values obtained with the 415
diffusion model are generally slightly lower than the ones obtained with the two first-416
order reactions model. Nevertheless, in most cases the two models fitted the 417
experimental data and the good agreement between the experimental and fitted 418
curves is visible in Figure 2. The standard deviation of residues obtained was in most 419
cases high and data of the extraction with 1.0 mol L-1 NH4Ac rarely fitted to either of 420
the adopted models. The phenomenon of re-adsorption that can be observed during 421
the extraction process is particularly noted for this extractant solution, causing a 422
more “irregular” dataset, hampering its fit. Re-adsorption problems are one of the 423
disadvantages recognized to chemical extraction procedures (Bacon and Davidson, 424
2008). 425
Concerning the two first-order reactions model, the kinetic constant k1 is always 426
larger than k2, corroborating the two different kinetic stages and the faster removal 427
rate during the first hours. For mercury extraction with HCl (both concentrations) k1 428
and k2 from Estarreja soil are superior to k1 and k2 from Caveira soil, which can be 429
related to the soils physicochemical characteristics. Estarreja and Caveira soils have 430
higher porosity. In turn, the high porosity of this soil suggests that mercury extraction 432
could be controlled by intra-particle diffusion. This desorption mechanism had 433
already been observed in the study of the water-soluble fraction and a thorough 434
explanation can be found in Reis et al. (2014). Additionally, the smaller particle size 435
of the Caveira soil increases its mercury retention capacity but metal extraction is 436
also dependent on soil-extractant equilibrium (extractant solution may become 437
saturated) and on the strength of the bound between the metal and the solid 438
particles. In short, all these processes can contribute to the observed results. 439
In general, the C2 fraction estimated by the two first-order reactions model was 440
larger than the C1 fraction and both increased with decreasing soil:extractant ratio 441
(exception for Caveira soil, 0.5 mol L-1 HCl). This confirms previous observation that 442
more mercury is extracted when low soil:extractant ratios are applied. It also means 443
that, even though the extraction is faster in the first 10 hours, a smaller quantity is 444
extracted in that period, when compared to the second stage. 445
The Ceq values estimated by the diffusion model increase in the order 1.0 mol L-1 446
NH4Ac < 0.1 mol L-1 HCl < 0.5 mol L-1 HCl, and decrease as soil:extractant ratio 447
increases. Also, Ceq in Estarreja is higher than Ceq in Caveira soil sample. The 448
kinetic constant, k, is larger in 0.5 mol L-1 HCl than in 0.1 mol L-1 HCl, confirming that 449
extraction reaction occurs faster in the presence of more concentrated acid. Between 450
the two studied samples, there is no meaningful difference in the constant k, 451
although in Caveira soil the process is slightly slower. The explanation for the slower 452
mercury extraction in Caveira soil can be due to the sample texture and was already 453
discussed. 454
were calculated. The experimental value of C1 was defined as the amount of 457
mercury desorbed per unit of soil at t=10 hours; the experimental value of C2 was 458
calculated by the difference between the amount of mercury extracted at equilibrium 459
and C1. Ceq, in the diffusion model, was defined as the amount of mercury desorbed 460
per unit of soil at t=equilibrium. Therelative error associated with C1 and C2 is not 461
satisfactoryas it ranges from 6% to approximately 60% and, in a few cases, is as 462
high as 95%. Both under and overestimation of the experimental value occurred. The 463
error associated with Ceq is considerably lower, meaning that this constant better 464
estimates the real concentration reached at equilibrium. 465
In summary, both the two first-order reactions and the diffusion models help to 466
understand the mechanisms involved in mercury extraction, meaning that mercury 467
extraction from the studied soils occurs in two concurrently stages and that 468
extraction is limited by diffusion of less labile mercury complexes. 469
470
3.2.5 Effect of soil physicochemical characteristics on mercury extraction
471
Mercury availability can be dependent on contamination source (anthropogenic or 472
geogenic) and it is generally recognized that metals are more labile in 473
anthropogenic-contaminated soils (Ratuzny et al., 2009). The results of this work, 474
are however different, as a higher percentage of mercury was extracted in Caveira 475
soil (although at an apparent slower rate), a mine soil where mercury is of geogenic 476
origin, when compared to the percentage extracted in the Estarreja soil, where 477
contamination results from the effluents of a chlor-alkali plant. Caveira soil has 478
physicochemical characteristics that would apparently retain mercury more 479
efficiently, like higher content of organic matter, sulfur and clay. The observed 480
influence on mercury extraction from soil. The pH was adjusted to 7 in the 1.0 mol L-1 482
NH4Ac solution, and was controlled during the extraction, during which time pH 483
changes were not relevant. For Estarreja soil, pH varied between 6.6 and 7.0 and for 484
Caveira between 5.2 to 5.8 (pH was slightly higher in the 1.5 g:100 mL ratio). 485
However, Caveira soil is considerable more acid than Estarreja soil (3.3 versus 6.0), 486
therefore, and due to soil’s buffering capacity, it is expected that the solutions will 487
also have lower pH. The increased tendency for a soil to release metals with 488
decreasing pH has been well documented, due to H+ removing and replacing the 489
metal cations (Gabriel and Williamson, 2004). Also, Sutherland and Tack (2008) 490
showed that metal extraction with diluted HCl was greater in soil richer in finer 491
particles, as is the case with the Caveira sample. 492
Nonetheless, for environmental relevance, it is more important to consider 493
absolute mercury concentration that is, in fact, released to other compartments. The 494
total Hg concentration in the two soil samples is very different and hence a small 495
fraction of a large amount represents considerably more than a large fraction of a 496
small amount. Indeed, when considering absolute concentrations, mercury found in 497
extracts from Caveira is in lower concentration (Table 1). 498
499
3.2.6 Comparison with the Kingston method (mobile fraction)
500
The Kingston method had been previously applied to the same samples (Reis et al., 501
2010). The first fraction (mobile fraction) includes the most mobile/bioaccessible 502
species (Han et al., 2003) and, hence, should be comparable to the results 503
presented in this study. The comparison presented in Figure 3 shows that the mobile 504
the labile fraction was extracted with 1.5 g:100 mL, which again shows that 507
soil:extractant ratio does not have a major influence on the extraction procedure. In 508
both cases mercury extracted is superior to the amount extracted by any of the 509
reagents used for the exchangeable fraction. In terms of the laboratory work involved 510
in both extractions (mobile in the Kingston method vs. 0.5 mol L-1 HCl labile), the 511
latter is less labor intensive, and therefore less prone to procedural errors. Although 512
this was not tested, 0.5 mol L-1 HCl could be an alternative reagent in extraction of 513
the mobile fraction in Kingston method and it would be interesting, in a future 514
assessment, to consider and study this hypothesis. 515
516
4
Conclusion
517
In this work some parameters have been studied in order to determine the 518
optimal experimental conditions for the extraction of available and labile fractions of 519
mercury from soil. The experiment considered the effects of the extractant used, 520
soil:extractant ratio, time of extraction and extraction kinetics, and soil 521
physicochemical properties. 522
From a general point of view, it was determined that: 523
a) Soil physicochemical characteristics have a strong influence on mercury 524
fractionation. In the analysed samples, soil pH and texture controlled the 525
rate and mechanism of extraction; 526
b) Extraction time needs to be increased, particularly in labile fraction 527
extraction (at least 24 hours). The majority of procedures recommend a 30 528
c) It is recommendable to use the lowest soil:extractant ratio that offers 530
efficient extraction, because this gives the best chance that mercury 531
concentrations will be above quantification limits, and also improves the 532
representativeness of the soil sample. 533
d) The work showed that it is feasible to use both 1.0 mol L-1 NH4Ac (pH 7) 534
and 0.1 mol L-1 HCl to estimate the mercury available fraction, as both 535
solutions yielded equivalent results. However, some problems of mercury 536
re-adsorption were observed with 1.0 mol L-1 NH4Ac, and therefore 0.1 mol 537
L-1 HCl seems more advantageous. 538
539
The outcomes of this study contribute to a better estimation of the labile fractions 540
of mercury in soil and therefore for a more accurate risk assessment of contaminated 541
sites. Future research should be focused on validation of the procedures here 542
presented, such as organization of an interlaboratory trial. 543
Acknowledgments
545
This work was supported by European Funds through COMPETE and by National 546
Funds through the Portuguese Foundation for Science and Technology (FCT) within 547
project PEst-C/MAR/LA0017/2013, project SEPMERCURY – Sequential extraction 548
methods for assessing the origin, mobility and toxicity of mercury from contaminated 549
solid matrices and preparation of new sediment and soil reference materials 550
(PTDC/AAC-AMB/105157/2008), and via a PhD grant (SFRH/BD/43681/2008; A.T. 551
Reis). 552
References
Andrews, S., Sutherland, R.A., 2004. Cu, Pb and Zn contamination in Nuuanu watershed, Oahu, Hawaii. Sci Total Environ, 324(1–3), 173-182.
Bacon, J.R., Davidson, C.M., 2008. Is there a future for sequential chemical extraction? Analyst, 133(1), 25-46.
Barriga, F., 1990. Metallogenesis of the Iberian Pyrite Belt. In: R.D. Dallmeyer, E. Martinez (Eds.), Pre-mesozoic geology of Iberia. Springer-Verlag, pp. 369-379.
Bermond, A., Varrault, G., Sappin-Didier, V., Mench, M., 2005. A kinetic approach to predict soil trace metal bioavailability: preliminary results. Plant Soil, 275, 21– 29.
Biester, H., Scholz, C., 1997. Determination of Mercury Binding Forms in Contaminated Soils: Mercury Pyrolysis versus Sequential Extractions. Environ Sci Technol, 31, 233-239.
Bloom, N.S., Preus, E., Katon, J., Hiltner, M., 2003. Selective extractions to assess the biogeochemically relevant fractionation of inorganic mercury in sediments and soils. Anal Chim Acta, 479, 233-248.
Bondareva, L., Teisserenc, R., Pakharkova, N., Shubin, A., Le Dantec, T., Renon, L., Svoboda, I., 2014. Assessment of the Bioavailability of Cu, Pb, and Zn through Petunia axillaris in Contaminated Soils. 2014, 6.
Costley, C.T., Mossop, K.F., Dean, J.R., Garden, L.M., Marshall, J., Carroll, J., 2000. Determination of mercury in environmental and biological samples using pyrolysis atomic absorption spectrometry with gold amalgamation. Anal Chim Acta, 405(1-2), 179-183.
EPA, 2005. Method 3200 Mercury species fractionation and quantification by microwave assisted extraction, selective solvent extraction and/or solid phase extraction
Fangueiro, D., Bermond, A., Santos, E., Carapuça, H., Duarte, A., 2005. Kinetic approach to heavy metal mobilization assessment in sediments: choose of kinetic equations and models to achieve maximum information. Talanta, 66(4), 844-857.
Filgueiras, A.V., Lavilla, I., Bendicho, C., 2002. Chemical sequential extraction for metal partitioning in environmental solid samples. J Environ Monitor, 4(6), 823-857.
Gabriel, M.C., Williamson, D.G., 2004. Principal Biogeochemical Factors Affecting the Speciation And Transport of Mercury through the terrestrial environment. Environ Geochem Hlth, 26(4), 421-434.
Gismera, M.J., Lacal, J., da Silva, P., Garcı́a, R., Teresa Sevilla, M., Procopio, J.R., 2004. Study of metal fractionation in river sediments. A comparison between kinetic and sequential extraction procedures. Environ Pollut, 127(2), 175-182. Gleyzes, C., Tellier, S., Astruc, M., 2002. Fractionation studies of trace elements in
Hagarová, I., Zemberyová, M., Bajcan, D., 2003. Sequential and single step extraction procedures used for fractionation of selenium in soil samples. Chem Pap, 59(2), 93-98.
Han, F.X., Su, Y., Monts, D.L., Waggoner, C.A., Plodinec, M.J., 2006. Binding, distribution, and plant uptake of mercury in a soil from Oak Ridge, Tennessee, USA. Sci Tot Environ, 368(2-3), 753-768.
Han, Y., Kingston, H.M., Boylan, H.M., Rahman, G.M.M., Shah, S., Richter, R.C., Link, D.D., Bhandari, S., 2003. Speciation of mercury in soil and sediment by selective solvent and acid extraction. Anal Bioanal Chem, 375(3), 428-436. Hass, A., Fine, P., 2010. Sequential Selective Extraction Procedures for the Study of
Heavy Metals in Soils, Sediments, and Waste Materials—a Critical Review. Crit Rev ENv Sci Technol, 40(5), 365-399.
Hissler, C., Probst, J.L., 2006. Impact of mercury atmospheric deposition on soils and streams in a mountainous catchment (Vosges, France) polluted by chlor-alkali industrial activity: The important trapping role of the organic matter. Sci Total Environ, 361, 163-178.
Hylander, L.D., Meili, M., 2003. 500 years of mercury production: global annual inventory by region until 2000 and associated emissions. Sci Total Environ, 304(1-3), 13-27.
Issaro, N., Abi-Ghanem, C., Bermond, A., 2009. Fractionation studies of mercury in soils and sediments: A review of the chemical reagents used for mercury extraction. Anal Chim Acta, 631(1), 1-12.
Jing, Y.D., He, Z.L., Yang, X.E., Sun, C.Y., 2008. Evaluation of Soil Tests for Plant-available Mercury in a Soil–Crop Rotation System. Commun Soil Sci Plan, 39, 3032–3046.
Kashem, M.A., Singh, B.R., Kondo, T., Huq, S.M.I., Kawai, S., 2007. Comparison of extractability of Cd, Cu, Pb and Zn with sequential extraction in contaminated and non-contaminated soils. Int J Environ Sci Tech, 4(2), 169-176.
Kim, C.S., Brown, G.E., Rytuba, J.J., 2000. Characterization and speciation of mercury-bearing mine wastes using X-ray absorption spectroscopy. Sci Total Environ, 261(1-3), 157-168.
Lacerda, L., Salomons, W., 1998. Mercury from Gold and Silver Mining: A Chemical Time Bomb? 1.ª ed. Springer-Verlag, Berlin.
Neculita, C.-M., Zagury, G.J., Deschenes, L., 2005. Mercury Speciation in Highly Contaminated Soils from Chlor-Alkali Plants Using Chemical Extractions. J Environ Qual, 34(1), 255-262.
Nyale, S., Eze, C., Akinyeye, R., Gitari, W., Akinyemi, S., Fatoba, O., Petrik, L., 2014. The leaching behaviour and geochemical fractionation of trace elements in hydraulically disposed weathered coal fly ash. J Environ Sci Health A Tox Hazard Subst Environ Eng, 49(2), 233-242.
Oliveira, L.C., Serudo, R.L., Botero, W.G., Mendonça, A.G.R., Santos, A.d., Rocha, J.C., Neto, F.S.C., 2007. Distribuição de mercúrio em diferentes solos da bacia do médio Rio Negro-AM: influência da matéria orgânica no ciclo biogeoquímico do mercúrio. Quim Nova, 30(2), 274-280.
Panyametheekul, S., 2004. An operationally defined method to determine the speciation of mercury. Environ Geochem Hlth, 26, 51-57.
Ratuzny, T., Gong, Z., Wilke, B.M., 2009. Total concentrations and speciation of heavy metals in soils of the Shenyang Zhangshi Irrigation Area, China. Environ Monit Assess, 156(1-4), 171-180.
Reis, A.T., Coelho, J.P., Rodrigues, S.M., Rocha, R., Davidson, C.M., Duarte, A.C., Pereira, E., 2012. Development and validation of a simple thermo-desorption technique for mercury speciation in soils and sediments. Talanta, 99, 363-368.
Reis, A.T., Lopes, C.B., Davidson, C.M., Duarte, A.C., Pereira, E., 2014. Extraction of mercury water-soluble fraction from soils: An optimization study. Geoderma, 213(0), 255-260.
Reis, A.T., Rodrigues, S.M., Araújo, C., Coelho, J.P., Pereira, E., Duarte, A.C., 2009. Mercury contamination in the vicinity of a chlor-alkali plant and potential risks to local population. Sci Total Environ, 407(8), 2689-2700.
Reis, A.T., Rodrigues, S.M., Davidson, C.M., Pereira, E., Duarte, A.C., 2010. Extractability and mobility of mercury from agricultural soils surrounding industrial and mining contaminated areas. 81(11), 1369-1377.
Renneberg, A.J., Dudas, M.J., 2001. Tranformations of elemental mercury to inorganic and organic forms in mercury and hydrocarbon co-contaminated soils. Chemosphere, 45, 1103-1109.
Snape, I., Scouller, R.C., Stark, S.C., Stark, J., Riddle, M.J., Gore, D.B., 2004. Characterisation of the dilute HCl extraction method for the identification of metal contamination in Antarctic marine sediments. Chemosphere, 57(6), 491-504.
Sutherland, R.A., 2002. Comparison between non-residual Al, Co, Cu, Fe, Mn, Ni, Pb and Zn released by a three-step sequential extraction procedure and a dilute hydrochloric acid leach for soil and road deposited sediment. Appl Geochem, 17(4), 353-365.
Sutherland, R.A., Tack, F.M.G., 2008. Extraction of labile metals from solid media by dilute hydrochloric acid. Environ Monit Assess, 138, 119-130.
Ullrich, S., Ilyushchenko, M., Kamberov, I., Tanton, T., 2007. Mercury contamination in the vicinity of a derelict chlor-alkali plant. Part I: Sediment and water contamination of Lake Balkyldak and the River Irtysh. Sci Total Environ, 381, 1-16.
31 1 . M e rc u ry e x tr a c te d fr o m s o il s b y 1 .0 m o l L -1 NH 4 A c , 0 .1 a n d 0 .5 m o l L
-1 H
C l s o lu ti o n s a t t h re e s o il :e x tr a c ta n t r a ti o s . A m o un ts p re s s e d a s m g o f m e rc u ry e x tr a c te d p e r kg s o il fo r t ≤ 1 0 h o u rs , t > 1 0 h o u rs a n d t o ta l e x tr a c te d ( in e q u ilib ri u m ). P er cen tag e o f m e rc ur y e x tr a c te d w a s de te rm ine d in c o m pa ri s o n to t ot a l m e rc u ry i n s o il . Hg r e m o v e d Re la ti v e Hg r e m o v e d Re la ti v e to ta l Hg r e m o v e dt o ta l H g R e la ti v e (m g k g -1) t< 1 0 h er ro r (m g k g -1) t> 1 0 h er ro r (m g k g -1) re m o v e d ( % ) e rro r 20 :1 0 0 0 .0 8 6 0 .0 6 4 3 -0 .0 2 3 n .e . -0 .06 3 0. 09 0. 069 -8. 4 10 :1 0 0 0 .0 1 0 .0 0 8 9 1 3 0 .00 5 9 0 .0 0 4 9 2 0 .4 0 .01 6 0. 0 23 0. 013 23 1. 5: 10 0 0 .0 3 2 0. 02 9 1 2 0 .00 4 4 n .e . -0 .03 7 0. 0 53 0. 029 27 ta rr e ja 20 :1 0 0 0 .0 5 1 0. 03 5 4 7 0 .0 4 8 0 .06 2 -2 2 .4 0 .1 0. 14 0. 083 20 7 0 mg kg -1) 10 :1 0 0 0 .0 8 9 0. 06 4 3 9 0 .2 8 2 .4 -8 8 .3 0 .3 7 0. 53 0. 41 -9 .8 1. 5: 10 0 0 .2 2 0 .4 6 -5 2 1 n .e . -1 .3 1. 8 1. 1 15 20 :1 0 0 1 .4 0 .9 3 5 1 2 .4 3 .9 -3 9 .5 3 .8 5. 4 3. 5 7. 4 10 :1 0 0 1 .7 1 .1 5 7 4 .4 5 .4 -1 9 .4 6 .1 8. 7 5. 9 3. 1 1. 5: 10 0 2 .6 1 .4 8 4 6 .8 8 .1 -1 5 .6 9 .4 13 8. 9 5. 8 20 :1 0 0 0. 00 7 4 0. 01 6 -5 4 0 .00 2 2 0 .00 9 -7 6 0 .0 0 9 6 0. 15 0. 00 91 5. 3 10 :1 0 0 0 .0 1 2 0. 01 6 -2 4 -0 .0 0 2 7 0 .0 0 8 3 -1 3 2 0 .0 0 9 5 0. 15 0. 0 1 1 -13 1. 5: 10 0 0 .0 4 7 0. 02 8 6 7 0 .1 6 0 .1 9 -1 8 0 .2 3. 2 0. 21 -3 .3 v e ir a 20 :1 0 0 0 .0 1 8 0 .1 5 -8 8 0 .1 n .e . -0 .1 2 1. 9 0. 14 -1 4 6 .3 mg kg -1) 10 :1 0 0 0 .0 1 0 .1 3 -9 2 0 .0 9 n .e . -0 .1 1. 6 0. 13 -2 3 1. 5: 10 0 0. 00 7 2 0 .4 8 -9 8 0 .2 5 0 .0 0 00 2 6 9 7 2 0 5 4 0 .2 6 4. 1 0. 49 -4 7 20 :1 0 0 0 .6 6 0 .6 2 6 .3 1 .4 2 .5 -4 4 2 .1 33 1. 9 7. 9 10 :1 0 0 0 .4 7 0 .2 4 9 5 1 .6 2 .2 -2 6 2 .1 33 2. 2 -5 1. 5: 10 0 0 .4 9 0 .5 1 -4 .5 1 .1 1 .7 -3 5 1 .6 25 1. 5 6. 7 0. 1 m ol L
-1 H
C l 0. 5 m ol L
-1 H
C l C1 C2 Ceq 1. 0 m o l L
-1 N
H4 Ac 0. 1 m ol L
-1 H
C l 0. 5 m ol L
-1 H
C l 1. 0 m o l L
-1 N
H4
Table 2. Friedman’s test (p-value; α = 0.05) for extraction procedure comparison.
20g:100mL 10g:100mL 1.5g:100mL
1 mol L-1 NH4Ac - 0.1 mol L-1 HCl p=0.102 p=0.014 p=0.015 1 mol L-1 NH4Ac - 0.5 mol L
-1
HCl p=0.0001 p=0.0005 p=0.0003 0.1 mol L-1 HCl - 0.5 mol L-1 HCl p=0.004 p=0.014 p=0.014
1 mol L-1 NH4Ac - 0.1 mol L-1 HCl p=0.855 p=0.465 p=0.068 1 mol L-1 NH
4Ac - 0.5 mol L-1 HCl p=0.002 p=0.0001 p=0.0003 0.1 mol L-1 HCl - 0.5 mol L-1 HCl p=0.003 p=0.003 p=0.018
Estarreja
33 3 . K ine ti c m od e ls ’ p a ra m e te rs f o r th e E s ta re ja so il . 20 :10 0 1 0 :1 0 0 1 .5 :1 0 0 2 0: 10 0 10 :10 0 1 .5 :1 0 0 20 :1 00 10 :10 0 1 .5 :1 0 0 C1 6. 0x 1 0 -2±5 .7 x1 0 -2 8. 9 x 10 -3±1 .0 x 1 0 -3 2. 9 x 10 -2±3 .0 x 1 0 -3 3. 5x 10 -2±6 .0 x 1 0 -3 6. 4x 10 -2±1 .2 x1 0 -2 0. 46 ± 0. 33 0. 93± 0. 12 1. 1± 0. 1 1. 4± 0 .1 k1 0 .1 7 ±0 .3 2 8 3 ± 5 8 2 .3 ±0 .7 2 .8 ±1 .5 1 .4 ±1 .1 8. 3 x 10 -2±7 .6 x 1 0 -2 1. 3 ± 0. 1 2. 0± 0. 7 1. 9± 0 .4 C2 ~ -3 .3 x1 0 -8 4. 9 x 10 -3±1 .6 x 1 0 -3 ~ -6 .9 x 1 0 -2 6. 2x 10 -2±7 .0 x 1 0 -3 2. 4± 7. 8 ~ 2 2 1 3. 9 ± 0. 7 5. 4± 0. 2 8. 1± 0 .1 k2 ~ -7 .9 x1 0 -1 2 0. 18 ± 0. 17 ~ 6 .1 x1 0 -5 2. 7x 10 -2±1 .0 x 1 0 -2 8. 4x 10 -4±3 .0 x1 0 -3 ~ 2 .1 x1 0 -5 9. 5x 10 -3±3 .4 x1 0 -3 1. 3x 10 -2±1 .0 x1 0 -3 1. 5 x1 0 -2±1 .0 x1 0 -3 95 % C o nf ide n c e Int e rv al s C1 -0 .0 7 1 - 0 .1 9 0 .0 0 5 8 - 0 .0 1 2 2. 3x 10
-2
3 .5 x 1 0 -2 2. 3 1 0
-2
4 .7 x1 0 -2 3. 7x 10
-2
9 .2 x 1 0 -2 -0 .2 5 1 .2 0 .6 7 - 1 .2 0 .8 6 - 1 .3 1 .3 1 .6 k1 -0 .5 6 - 0 .8 9 -4 8 .2 - 2 1 5 .0 0 .6 9 - 3 .9 -0 .3 9 5 .9 -0 .8 9 3 .7 -0 .0 8 1 0 .2 5 9. 4x 1 0
-2
2 .6 0. 44 3 .6 1 .0 - 2. 8 C2 (V e ry w id e ) 0 .0 0 11 - 0 .0 0 8 6 (V e ry w id e ) 4. 7x 1 0
-2
7 .7 x1 0 -2 -1 5 - 2 0 (V e ry w id e ) 2 .4 - 5 .5 4 .9 5 .7 7 .9 - 8 .4 k2 (V e ry w id e ) -0 .2 1 0 .5 6 (V e ry w id e ) 4. 3x 1 0
-3
4 .8 x1 0 -2 5. 7x 10
-3
7 .4 x 1 0 -3 (V e ry w id e ) 2. 0x 10
-3
1 .7 x 1 0 -2 1. 0 x1 0
-2
1 .6 x 1 0 -2 1. 3x 10
-2
1 .6 x1 0 -2 Go o d n e ss o f F it R 2 0. 388 0. 842 4 0. 905 1 0. 9483 0. 97 18 0. 953 9 0. 985 3 0. 9947 0. 9987 Sy .x 4. 1x 10 -2 2. 1x10 -3 4. 0x10 -3 8. 0x10 -3 2. 2x10 -2 0. 1 0 .17 0. 18 0. 13 Ce q 6. 9x 1 0 -2±2 .0 x1 0 -2 1. 3 x 10 -2±1 .0 x 1 0 -3 2. 9 x 10 -2±1 .0 x 1 0 -3 8. 3x 10 -2±6 .0 x 1 0 -3 0. 4 1± 0 .08 1. 1± 0. 1 3. 5 ± 0. 3 5. 9± 0. 3 8. 9± 0 .0 k 0 .1 7 ±0 .1 7 4 .1 ± 1 .6 2 .3 ±0 .6 0 .1 4 ± 0 .0 5 1. 1x 10 -2±4 .0 x1 0 -3 2. 1 x 10 -2±5 .0 x 1 0 -3 3. 2x 10 -2±8 .0 x1 0 -3 2. 4x 10 -2±4 .0 x1 0 -3 2. 5 x1 0 -2±3 .0 x1 0 -3 95 % C o nf ide n c e Int e rv al s Ce q 0 .0 2 5 0 .1 1 1. 1 x10
-2
1 .4 x1 0 -2 2. 6x 10
-2
3 .2 x 1 0 -2 7. 1x 1 0
-2
9 .7 x1 0 -2 0. 24 0 .5 7 0. 92 1. 3 2 .9 - 4. 2 5 .3 6 .4 8 .2 - 9. 6 k-0 .2 2 0 .5 4 0 .5 7 7 .6 1 .1 3 .6 0 .0 4 9 0 .2 3 2. 3 x1 0
-3
0 .0 2 1 9 .8 -1 0
-3
3 .2 x1 0 -2 1. 5x 10
-2
5 .0 x 1 0 -2 1. 5 x1 0
-2
3 .2 x 1 0 -2 1. 8x 10
-2
3 .2 x1 0 -2 Go o d n e ss o f F it R 2 0. 4089 0. 734 9 0. 905 0 0. 7900 0. 90 17 0. 925 0 0. 886 6 0. 9474 0. 9673 Sy .x 0. 0366 2. 4x10 -3 3. 6x10 -3 1. 5x10 -2 3. 9x10 -2 0. 1 2 0. 4 4 0. 53 0. 64 a0 .0 5 7 ± 0 .1 5 4 1 0 .9 ± 2 0 .3 2 .3 ± 2 .9 9. 2x 10 -2±3 .0 x 1 0 -3 7. 5x 10 -3±2 .5 x1 0 -3 4. 0 x 10 -2±1 .1 x 1 0 -2 0. 37± 0. 12 0. 37± 0. 08 0. 51± 0. 07 b8 2 ± 6 9 9 1 8 ± 1 7 7 3 1 7 ± 5 4 7 4 ± 8 6 .4 ± 1 .8 2 .5 ± 0 .5 1 .2 ± 0 .2 0 .6 5 ± 0 .06 0. 41± 0. 03 95 % C o nf ide n c e Int e rv al s a − 0. 28 14 0 .3 95 4 − 34 5 6 − 4. 2 8 .9 3 .4x 1 0
-3
0 .1 8 2 .5 x1 0
-3
1 .2 x 1 0 -2 1. 5x 10
-2
6 .5 x 1 0 -2 0. 12 0 .6 2 0 .2 1 - 0 .5 3 0. 36 0. 6 7 b − 70 .69 - 23 4. 5 5 29 - 1 30 8 1 97 4 39 56 - 91 2. 6 - 1 0 1. 5 3 .5 0 .8 2 1 .5 0 .5 3 0 .7 8 0 .3 5 0 .4 7 Go o d n e ss o f F it R 2 0. 2857 0. 852 4 0. 865 8 0. 9321 0. 91 57 0. 944 7 0. 944 3 0. 9742 0. 9876 Sy .x 0. 0402 1. 7x10 -3 4. 3x10 -3 8. 5x10 -3 3. 6x10 -2 0. 1 1 0. 3 1 0 .3 7 0 .4 0. 5 m o l L
-1 H
C l K in e ti c m o d e l Pa ra m e te rs 1 m o l L -1 NH 4 Ac 0. 1 m o l L
-1 H
[image:33.612.124.404.72.722.2]34 Ta b le 4 . K ine ti c m od e ls ’ p a ra m e te rs f o r th e C a v e ir a so il . n. e . n o n -e st im at e d . 20 :10 0 1 0 :1 0 0 1 .5 :1 0 0 2 0: 10 0 10 :10 0 1 .5 :1 0 0 20 :1 00 10 :10 0 1 .5 :1 0 0 C1 1. 6x 1 0 -2±1 .0 x1 0 -3 1. 6 x 10 -2±1 .0 x 1 0 -3 2. 8 x 10 -2±8 .0 x 1 0 -3 0. 15 ± 0. 15 0. 1 3± 0 .23 0. 48 ± 0. 63 0. 62± 0. 09 0. 24± 0. 1 1 0. 51± 0 .0 9 k1 149± 54 11 3 ± 26 72± 149 1. 7x 10 -2±1 .0 x 1 0 -2 1. 3x 10 -2±2 .0 x1 0 -2 6. 3 x 10 -3±9 .9 x 1 0 -3 0. 15± 0. 03 0. 14± 0. 08 0. 10± 0. 02 C2 9. 9 x1 0 -3±1 .4 x1 0 -3 8. 3 x 10 -3±8 .6 x 1 0 -4 0. 19± 0. 1 ~ -8 .2 x 1 0 -8 ~ 1 .1 x 1 0 -3 2. 6x 1 0 -5±0 .8 2. 5 ± 0. 7 2. 2± 0. 1 1. 7± 0 .3 k2 0. 21± 0. 1 6. 2 x 10 -2±2 .0 x 1 0 -2 1. 3 x 10 -2±6 .0 x 1 0 -3 ~ -7 .1 x 1 0 -1 1 ~ 6 .8 x1 0 -1 0 2. 2x 1 0 -1 0±5 3 4 .9 x1 0 -3±2 .5 x1 0 -3 1. 3x 10 -2±2 .0 x1 0 -2 6. 1 x1 0 -3±2 .5 x1 0 -3 95 % C o nf ide n c e Int e rv al s C1 1. 3 x1 0
-2
1 .9 x 1 0 -2 1. 4 x10
-2
1 .7 x1 0 -2 1. 1x 10
-2
4 .7 x 1 0 -2 -0 .1 9 - 0 .4 8 -0 .3 7 - 0 .6 3 -0 .9 0 1 .9 0 .4 1 - 0 .8 3 4. 8-10
-3
0 .4 7 0. 30 0. 7 1 k1 31 - 2 67 5 6 - 17 0 -253 39 7 -0. 01 1 0 .044 -0. 02 4 - 0. 04 9 -0 .0 1 5 - 0 .0 28 0 .0 68 0 .2 3 -0 .03 9 0. 32 5. 1x 10
-2
0 .1 5 C2 − 1. 3x 10
-2
-− 6. 8 x 10 -3 − 1. 0x 10
-2
-− 6. 4x 10 -3 0. 11 - 0 .29 (V e ry w id e ) (V e ry w id e ) − 1. 9 x 10
7
1 .9 x1 0 7 0. 91 4 .1 2. 0 - 2. 4 1. 0 2 .3 k2 3. 0x 10
-2
0 .3 8 1 .9 x 1 0
-2
0 .1 0 − 2. 4x 10
-4
2 .6 x 1 0 -2 (V e ry w id e ) (V e ry w id e ) -1 1 4 1 1 4 − 5. 4x 10
-4
1 .0 x1 0 -2 8. 6 x1 0
-3
1 .7 x 1 0 -2 6. 6x 10
-4
1 .2 x1 0 -2 Go o d n e ss o f F it R 2 0. 8673 0. 932 2 0. 935 1 0. 9927 0. 97 91 0. 896 7 0. 996 2 0. 9982 0 .998 Sy .x 1. 8x 10 -3 1. 3x10 -3 1. 9x10 -2 4. 8 x1 0-3 6. 7x10 -3 3. 9x10 -2 4. 9 x10 -2 3. 9x 10 -2 2. 9x10 -2 Ce q 9. 1x 1 0 -3±1 .1 x1 0 -3 1. 1 x 10 -2±1 .0 x 1 0 -3 0. 21 ± 0. 03 0. 14 ± 0. 01 0. 1 3± 0 .01 0. 49 ± 0. 32 1. 9 ± 0. 1 2. 2± 0. 1 1 .5 ± 0 .1 k ~ 2 .7 x 1 0 13 227± 250 2. 1 x 10 -2±7 .0 x 1 0 -2 1. 7x 10 -2±2 .0 x 1 0 -2 1. 3x 10 -2±3 .0 x1 0 -3 5. 9 x 10 -3±5 .4 x 1 0 -3 2. 5x 10 -2±3 .0 x1 0 -2 1. 8x 10 -2±1 .0 x1 0 -3 2. 4 x1 0 -2±3 .0 x1 0 -3 95 % C o nf ide n c e Int e rv al s Ce q 6. 8 x1 0
-3
1 .1 x 1 0 -2 9. 3 x10
-3
1 .3 x1 0 -2 0. 14 0. 26 0. 13 0 .1 6 0 .1 0 - 0. 16 -0. 19 1. 2 1. 7 2 .1 2 .1 2 .4 1 .4 1 .6 k( V e ry w id e ) -3 0 9 7 6 4 6. 0x 10
-3
3 .7 x 1 0 -2 1. 3x 1 0
-2
2 .0 x1 0 -2 6. 9x 10
-3
1 .8 x 1 0 -2 − 5. 7x 10
-3
1 .8 x 1 0 -2 1. 7x 10
-2
3 .3 x 1 0 -2 1. 5 x1 0
-2
2 .0 x 1 0 -2 1. 8x 10
-2
2 .9 x1 0 -2 Go o d n e ss o f F it R 2 0. 2492 0. 416 3 0. 864 9 0. 9932 0. 97 91 0. 896 7 0. 968 4 0. 9952 0. 9826 Sy .x 4. 0x 10 -3 3. 5x10 -3 2. 6x10 -2 4. 3x10 -3 6. 2x10 -3 3. 7x10 -2 0. 1 3 5. 9x 10 -2 7. 9x10 -2 a 6. 6 x 10 -3±2 .7 x 1 0 -3 2. 8x 10 -3±3 .7 x 1 0 -4 1. 8x 10 -3±1 .1 x1 0 -3 2. 9 x 10 -3±9 .7 x 1 0 -4 8. 8x 10 -2±1 .1 x1 0 -2 5. 6x 10 -2±3 .0 x1 0 -3 6. 1 x1 0 -2±4 .0 x1 0 -2 b 1 3 ± 4 1 4 ± 2 1 3 ±3 2 .3 ±2 .6 1 .7 ± 0 .1 1 .1 ±0 .1 1 .9 ± 0 .1 95 % C o nf ide n c e Int e rv al s a 7. 6x 10
-4
1 .2 x 1 0 -2 1. 9x 1 0
-3
3 .6 x1 0 -3 1. 1x 10
-3
2 .4 x 1 0 -3 7. 9x 10
-4
4 .9 x 1 0 -3 6. 5 x10
-2
0 .1 1 4 .9 x1 0
-2
6 .3 x 1 0 -2 5. 2x 10
-2
7 .0 x1 0 -2 b 4. 6 - 22 9. 5 18 5. 6 - 2 0 − 3. 3 7 .8 1. 5 1 .9 1. 0 - 1. 21 .8 2 .2 Go o d n e ss o f F it R 2 0. 2306 0. 389 5 0. 860 2 0. 9858 0. 97 29 0. 894 1 0. 990 8 0. 9975 0. 9967 Sy .x 4. 1x 10 -3 3. 5x10 -3 2. 6x10 -2 6. 2x10 -3 7. 1x10 -3 3. 7x10 -2 7. 2 x10 -2 4. 3x 10 -2 3. 5x10 -2 Sa m p le K in e ti c m o d e l Pa ra m e te rs 1 m o l L -1 NH 4 Ac 0. 1 m o l L
-1 H
C l 0. 5 m o l L
-1 H
[image:34.612.126.407.71.728.2]FIGURE CAPTION
Figure 1. Mercury extracted from soil samples for the three soil:extractant solution ratios (mg kg-1 of soil) as function of the time (hours) for Caveira (left) and Estarreja (right) samples. Extractants are, from top to bottom, 1 mol L-1 NH4Ac pH 7, 0.1 and 0.5 mol L-1 HCl.
Figure 2. Kinetics of the extraction of mercury from soil samples, using 1 mol L-1 NH4Ac pH 7, 0.1 and 0.5 mol L-1 HCl (top to bottom), and curves obtained with the two first-order reactions and diffusion models for Caveira (left) and Estarreja (right) samples.