City, University of London Institutional Repository
Citation
:
Kovacevic, A., Mujic, E., Stosic, N. and Smith, I. K. (2011). Extending the Role of
Computational Fluid Dynamics in Screw Machines. Proceedings of the Institution of
Mechanical Engineers, Part E: Journal of Process Mechanical Engineering, 225(2), pp.
83-97. doi: 10.1177/0954408910397586
This is the accepted version of the paper.
This version of the publication may differ from the final published
version.
Permanent repository link:
http://openaccess.city.ac.uk/5469/
Link to published version
:
http://dx.doi.org/10.1177/0954408910397586
Copyright and reuse:
City Research Online aims to make research
outputs of City, University of London available to a wider audience.
Copyright and Moral Rights remain with the author(s) and/or copyright
holders. URLs from City Research Online may be freely distributed and
linked to.
Extending the Role of Computational Fluid
Dynamics in Screw Machines
Ahmed Kovacevic, Nikola Stosic, Elvedin Mujic, Ian K Smith and Diego Guerrato
Centre for Positive Displacement Compressor Technology City University London, United Kingdom
ABSTRACT
Previous publications show that Computational Fluid Dynamics (CFD) can be readily used for the flow prediction and analysis of screw compressors. Several case studies are presented in this paper to show the scope and applicability of such methods. These include solid-fluid interaction in screw compressors, prediction of flow generated noise in screw machines, cavitation modelling in gear pumps, and flow in multiphase pumps for oil and gas industry. Numerical grids for all these cases were generated by us of an in-house grid generator, while the CFD calculations were performed with a variety of commercially available CFD codes.
In order to validate the accuracy of the CFD calculations, an extended test programme was carried out using Laser Dopler Velocimetry (LDV) to measure the mean and fluctuating velocity distribution in screw compressor flow domains. The measurement results are then compared with the CFD simulations. The results confirm the viability of the developed techniques.
It is shown in this publication that the flexibility of the developed method creates further opportunities for a broader use of Computational Fluid Dynamics for analysis of twin screw machines in a range of new applications.
1 INTRODUCTION
prediction of external flows. A comprehensive overview of available methods for the utilisation of CFD is given by Ferziger and Perić [6]
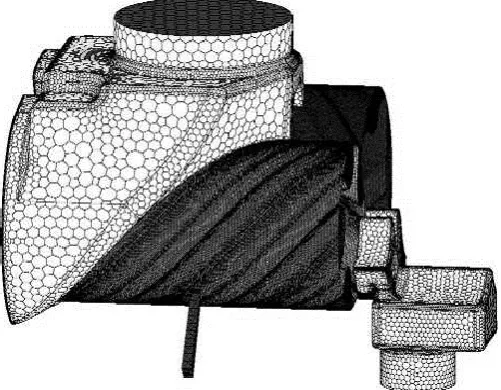
[image:3.476.114.365.229.424.2]The calculation of internal unsteady flows was for a long time regarded of secondary importance. However with increased demands for accurate prediction of flows in internal combustion engines, compressors and other types of machines, CFD analysis became particularly interesting for internal flows within moving boundaries. In the last decade it was shown that ability to accurately predict flows in screw machines gives competitive advantage to manufacturers of such machinery. There are two basic issues which make such calculation difficult. Firstly, due to the complex geometry of its internal passages, the flow regimes inside a screw displacement machines can vary significantly within different flow domains. Secondly, it can be very difficult to replace such domains with a computational grid of sufficient quality for accurate and reliable calculation. A pioneering approach, published in the works of Demirdžić, Perić and Muzaferija, [4], [18] enabled the calculation of such flows with a variety of grid topologies by use of finite volume methods of discretisation.
Figure 1 Numerical mesh for CFD calculation of screw compressor
overview of the methods and tools used. These are applicable to the majority of commercial CFD software packages and can accommodate use of a variety of CAD systems [14]. A typical arrangement of a numerical mesh for the CFD calculation of screw compressors is shown in
Figure 1. The moving parts of the flow domain are mapped with a hexahedral block structured numerical mesh while the remaining stationary parts are modelled by an unstructured polyhedral mesh, produced directly from a CAD system [18], by the proprietary commercial grid generators suitable for non moving geometries. Although mainly used for CFD in screw machines, the same concept may be utilized for a variety of other applications, for example, in the grid generation of the flow paths in a rotary heat exchanger [1].
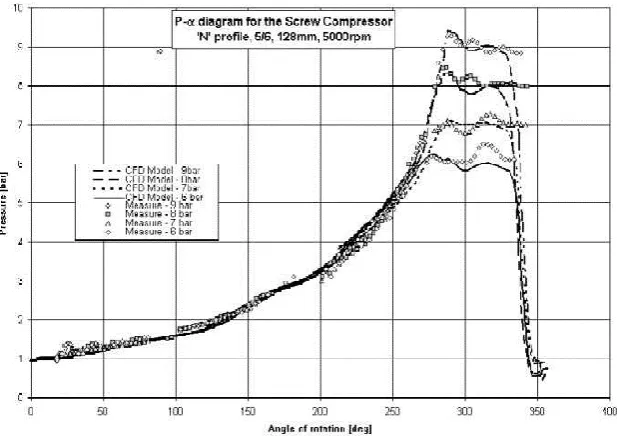
The first experimental verification of the numerical results was obtained in 2002 and reported in [9]. This study was performed on an oil injected screw compressor of a 5/6 lobe configuration with a male rotor outer diameter of 128 mm of ‘N’ type profile. The numerical mesh used, contained just over half a million grid cells, of which about 200,000 were used to map the moving parts of the grid, the rotors and space between them. A converged solution was obtained on an office PC after 120 time steps each requiring approximately 15 minutes of computing time.
Figure 2 The comparison of measured and calculated pressures
However it was also shown that use of different differencing schemes and turbulence methods significantly influences predictions for local velocity and pressure values in certain machine regions. Although these differences have a low impact upon the overall performance, their influence upon flow development needs further investigation. Very few authors have analysed local effects in screw compressors. Examples are the work of Vimmr [22], following Kauder et al [8], who analysed the flow of a single leakage path through a static mesh at the male rotor tip to conclude that the rotor relative velocity does not affect flow velocities significantly and that none of the turbulence models used change the modelling outcome significantly. This agreed with the findings of Kovacevic et al [12], but also confirmed that further validation of full 3-D CFD calculation results could not be obtained by the use of simplified numerical or experimental methods. For this, a full understanding of the local velocities in the machine suction, compression and discharge chambers was needed.
2 FLOW MEASUREMENTS IN A SCREW COMPRESSOR BY USE OF LASER DOPPLER VELOCIMETRY
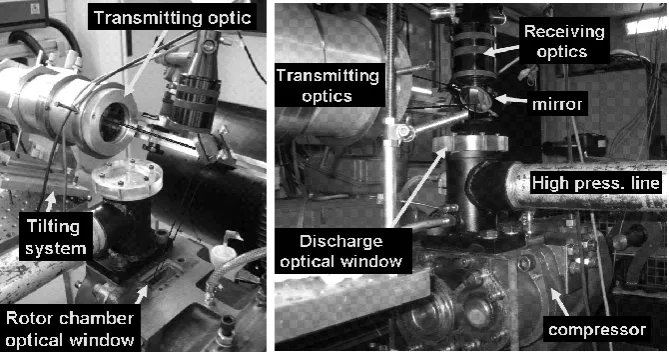
A transparent window for optical access into the rotor chamber of the test compressor was machined from acrylic to the exact internal profile of the rotor casing and was positioned on the pressure side of the compressor near the discharge port, as shown in Figure 3. After machining, the internal and external surfaces of the window were fully polished to allow optical access. Optical access to the discharge chamber was arranged through a transparent plate, 20 mm thick, installed on the upper part of the exhaust pipe. The optical compressor was then installed in a standard laboratory air compressor test rig, modified to accommodate the transmission of a laser beam and its traverses, as shown to the right of Figure 3. The laser Doppler Velocimeter operated in a dual-beam near backscatter mode. It comprised a 700 mW argon-ion laser, a diffraction-grating unit, to divide the light beam into two and provide frequency shift, and collimating and focusing lenses to form the control volume. A Fibre optic cable was used to direct the laser beam from the laser to the transmitting optical system, and a mirror was used to direct the beams from the transmitting optics into the compressor through one of the transparent windows. The collecting optics were positioned around 25 of the rotor chamber and 15 of the discharge chamber to the full backscatter position and comprised collimating and focusing lenses, a 100
[image:6.476.71.406.339.515.2]m pin hole and a photomultiplier equipped with an amplifier. The signal from the photomultiplier was processed by a processor interfaced to a PC and led to angle-averaged values of the mean and RMS velocities. In order to synchronise the velocity measurements with respect to the location of the rotors a shaft encoder that provides one pulse per revolution and 3600 train pulses, with an angular resolution of 0.1, was used and fixed at the end of the drive shaft. Instantaneous velocity measurements were made over thousands of shaft rotations to provide a sufficient number of samples. In the study described, the average sample density was 1350 data per shaft degree. Since the processing software enables use of 4 external channels, one of them was used to collect the pressure signal coming from the high data rate pressure transducer via an amplifier.
Figure 3 Optical compressor (left), LDV optical set for discharge chamber (right)
2.1 Flow measurements within the compression chamber
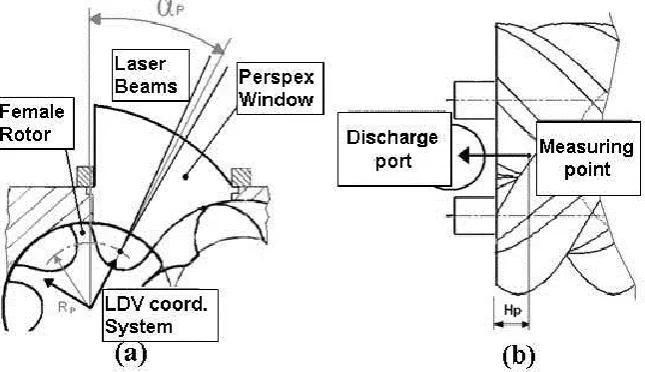
Two coordinate systems were defined within the rotor chamber of the compressor, one for the male and the other for the female rotor. The female rotor coordinate system is shown in Figure 4. Each of them was applied to one of the rotors where αp and Rp are, respectively, the angular and radial position of the
appropriate coordinate system, measurements were obtained at Rp=48, 56,
63.2mm, αp=27º and Hp=20 mm for the male rotor, and at Rp=42, 46, 50 mm,
αp=27º and Hp=20 for the female rotor.
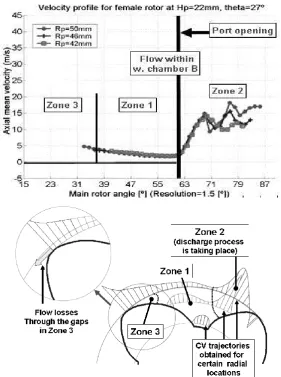
[image:7.476.78.401.115.301.2]Figure 5: LDV measurements of the axial velocity in the working chamber (top), Schematic representation of zones in the compressor interlobe domain (bottom)
Typical velocity values measured in the working chamber are shown in Figure 5. Three zones were identified in the working chamber near the discharge port. Zone (1) covers most of the main trapped working domain with fairly uniform velocities. Zone (2) is associated with the opening of the discharge port. The velocities and turbulence in this zone are much higher then in Zone (1). In this zone the flow is driven by the pressure difference between rotors and the discharge chamber, which is especially visible in this case as the pressure in the discharge system was maintained at practically atmospheric conditions. Zone (3) is associated with the leakage flows between the rotors and the casing, where velocities increase to values higher then in Zone (1) but are not as chaotic as in Zone (2).
up to 10% more pronounced near the leading edge of the rotor. (2) The mean axial flow within the working chamber decreases from the trailing to the leading edge with velocity values up to 1.75 times larger than the rotor surface velocity near the trailing edge region (3). The effect on velocities of the opening of the discharge port is significant near the leading edge of the rotors and causes a complex and unstable flow with very steep velocity gradients. The highest impact of the port opening on the flow is experienced near the tip of the rotor with values decreasing towards the rotor root.
2.2 Flow measurements within the discharge chamber
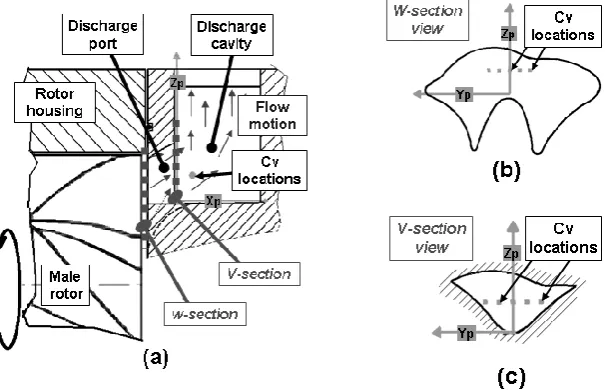
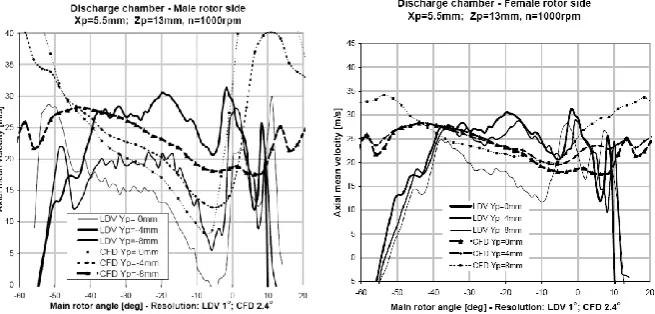
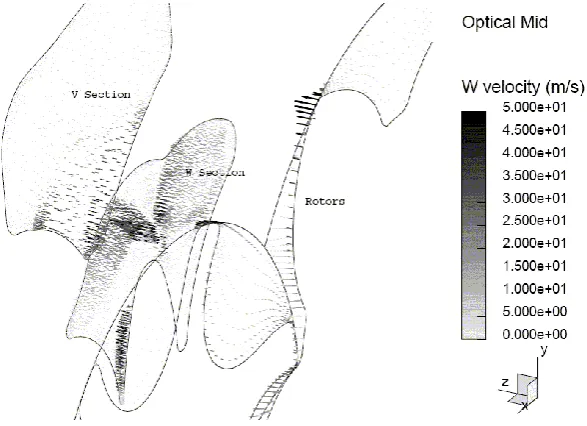
[image:9.476.78.381.221.416.2]Figure 6 (a) shows a schematic arrangement of the discharge chamber divided into the discharge port domain and the discharge cavity. Figure 6 (b) and (c) show the measurement locations for two characteristic cross sections called the W and V sections. The coordinate system, drawn in all of the sketches in Figure 6, identifies the location of the measured CV. Measurements were made at Xp=5.5mm, Zp =13mm and Yp = -8 to 13mm.
Figure 6: Measurement points in the discharge chamber: (a) Axial section through the discharge (b) “W” section, (c) “V “section;
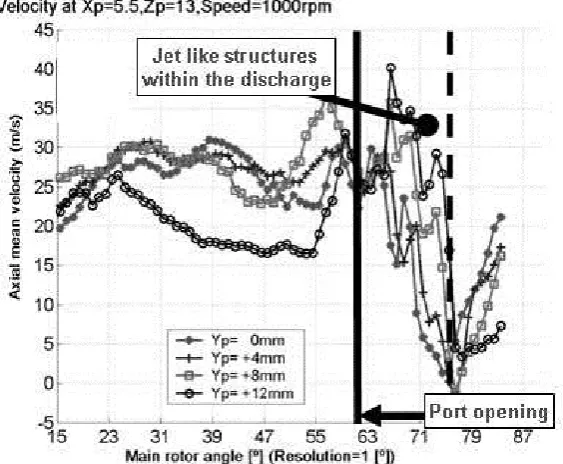
opening line in Figure 7. (3) The jet flows create velocity peaks making the flow in that region highly turbulent.
Figure 7 LDV measured axial velocity component inside the discharge chamber: male rotor side (left), female rotor side (right)
[image:10.476.75.402.354.503.2]3 VALIDATION OF CFD RESULTS BY LDV MEASUREMENTS
The numerical mesh used for CFD calculation is shown in
Figure 1. The flow paths around the rotating machine parts are generated using the in-house developed software package SCORG. The pre-processing script generated in SCORG is then used to connect the mesh for the rotating parts with the stationary numerical mesh of the compressor ports and other housing elements, generated directly from a CAD system. They are then transferred together to the commercial CFD solver.
For the purpose of obtaining the grid independent solution, three different meshes were generated, the smallest consisting of 600000 numerical cells, the mid sized mesh consisting of 935000 numerical cells and the largest with 2.7 million cells.. Results used for comparison with LDV measurements in this paper are obtained on the mid sized mesh. One full rotation of the male rotor that consisting of 300 time steps was sufficient to obtain a converged solution. Each time step took approximately 25 minutes of computer time
3.1 Compression Chamber
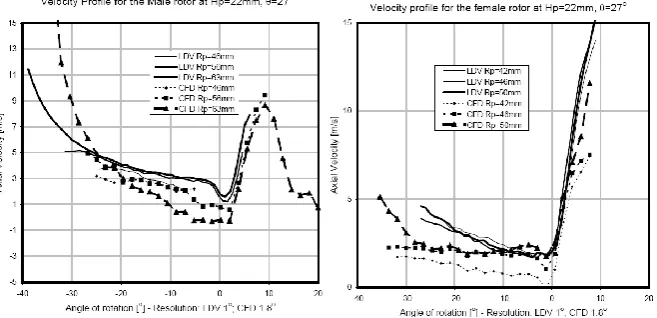
[image:11.476.76.405.381.540.2]The compressor working conditions and the position of the control volumes are identical for the CFD calculation and the LDV measurements. Figure 9 shows a comparison of the axial mean velocities in the compression chamber close to the discharge port. This figure shows a very good agreement throughout Zone (1) and Zone (2), as specified in Figure 5. In Zone (3), both the measured and calculated velocities increase but the increase in calculated velocities is larger than in the measured ones. It is believed that this difference is due to the inability of the k-e turbulence model to cope with near wall flows in the large numerical cells existing there. Such a configuration of the numerical mesh is a consequence of the methodology used for the generation and movement of the numerical mesh, as explained in more detail in [12].
Figure 9 Comparison of the LDV and CFD axial velocities in the compression domain
are low. Moreover, since the numerical mesh in each cross section contains 2640 cells, while there are only 240 numerical cells in the axial direction, it is necessary to interpolate velocities between neighbouring numerical cells. That inevitably leads to decreased accuracy, especially for low velocity flows with high local pressure gradients. Therefore, the difference between the measured and calculated circumferential velocity values is larger. Despite this, the calculation results show fairly good agreement with the measured values. Since the predicted integral parameters and pressure correlate well with the measured values, it is reasonable to assume that the small difference between the velocities in the circumferential direction does not play a significant role overall.
Figure 10 Comparison of the LDV and CFD circumferential velocities inside the compression chamber
3.2 Discharge Port
Figure 11 shows a comparison of the axial velocities in the discharge port. The differences appear to be rather large at locations where velocities are measured, although the trends and mean values are similar. It was confirmed by calculation that the highest values of axial velocity are in the middle section through the discharge port, which corresponds to the period of time when only one working chamber is connected to the discharge chamber.
[image:12.476.75.403.431.588.2]Figure 11 Comparison of the measured and calculated axial velocities in the discharge chamber
On both the male rotor side of the discharge port, as shown in the left diagram of Figure 11, and on the female rotor side of the port, shown in the right diagram, the velocities during that process decrease towards the walls. However during the phase when another working chamber is connected to the discharge port, the velocities near the walls increase due to the jet like flows induced by the higher pressure differences on the outside of the rotors.
[image:13.476.94.388.197.410.2]Moreover the leakage flows between the compression and discharge chambers, just prior to the opening of the discharge port, are large as presented in Figure 12. These cause an increase in velocity in the central region of the discharge chamber.
Figure 12 Axial velocities in three characteristic cross sections in the discharge region of the compressor
4 CASE STUDIES
The following four case studies are presented to demonstrate the flexibility of the method:
1) Calculation of fluid-solid interaction in screw compressors.
2) Estimation of pressure oscillations for noise prediction in a screw compressor discharge port
3) Investigation of cavitation in a helical gear pump 4) CFD modelling of a multiphase screw pump.
A numerical mesh was obtained in all cases, by the in-house grid generator described earlier in this paper. However, the CFD calculations were performed by a different CFD numerical solver in each case.
4.1 Fluid solid interaction
[image:14.476.117.359.293.459.2]Fluid solid interaction in screw compressors was investigated in three common applications of screw compressors, namely an oil-injected air compressor of moderate pressure ratio, a dry air compressor, of low pressure ratio, and a high pressure oil flooded compressor. In all cases the rotors were of the ‘N’ type with a 5/6 lobe configuration.
Figure 13 Rotor deformation in an oil injected compressor
Rotor deformation in an ordinary oil injected air screw compressor is caused mainly by pressure forces. The compressor in this analysis was working between 1 bar suction and 8 bar discharge pressure. Rotor deformation increases the clearance gaps between the rotors but by an order of magnitude smaller than the rotor clearances. Therefore this does not greatly affect compressor performance. In order to make the results visible, the deformations in Figure 13 are enlarged 20000 times and presented on the deformed numerical mesh.
In the oil free air compressor, due to the lack of cooling, the air temperature rise is much higher. For 3 bar discharge pressure the exit temperature has an average value of 180oC. The rotor deformation is presented in the left of Figure 14. The
as shown in the right diagram of the same figure. However, the temperature of the rotor pair is lower due to the continuous temperature averaging as shown in the right diagram of Figure 14. Deformation tends tp reduce the clearance between the rotors. To be visible on the deformed mesh, these are magnified 5000 times.
[image:15.476.72.404.110.240.2]Figure 14 Rotor displacement vectors and temperature distribution for an oil free compressor
Figure 15 Deformation of high pressure oil injected compressor rotors
The oil injected high pressure application of a CO2 refrigeration compressor with
suction at 30 bar and 0oC and discharge at 90 bar and 40oC is shown in Figure
15. In this case, the large pressure difference is the main cause of the rotor deflection. The highest deformation is in excess of 15m. The deformation pattern of the rotors is similar to the low pressure case but with slight enlargement at discharge.
[image:15.476.120.363.283.425.2]Figure 16 Deformations of a pair of combined compressor-expander rotors
4.2 Use of CFD for Noise Prediction
Figure 17 Pressure oscillations in the 3d CFD model of the discharge chamber
Figure 18 Comparison of results provided by various prediction models
The results obtained by the 3-D model agree very well with measurements, [16] but the model is too computation intensive for everyday industrial use. Therefore a combined model was developed which combines the accuracy of the full 3D model and the speed of a thermodynamic chamber model [13]. A comparison of these three models is presented in Figure 18. More details are given in [17] and [14].
4.3 Cavitation in gear pumps
Gear pumps are often used in the automotive and aero industries to supply fuel to an engine. A fuel gear pump geometry of is very similar to that of a screw compressor. It has two rotors with either straight or helical lobes which are contained in a housing and connected to other flow paths of the system through the suction and discharge chambers. The left side of Figure 19 shows a numerical mesh of such a gear pump. The hexahedral numerical mesh of rotors and flow around them was generated by SCORG, while the stationary parts were meshed by ANSYS CFX and ICEM tools into a tetrahedral mesh. These two domains were connected through transient sliding interfaces, readily available in the CFX solver.
given in [19]. The authors demonstrated the capability to generate the numerical mesh in such machines by the use of the SCORG software. The CFD calculation showed that cavitation occured in the flow through the interlobe gaps in the direction towards the suction chamber. It was outlined in [19] that the main challenge for a successful computation is a relatively complex geometry of the moving and deforming grids, as well as the transient interface. This was fully overcome by use of the SCORG software.
Figure 19 Numerical mesh of the gear pump and the occurrence of cavitation
4.4 CFD analysis of a multiphase screw pump
Multiphase screw pumps are regularly used in the oil and gas industry. A CFD analysis of the leakage flow and pressure distribution in these pumps has been calculated by Star CCM+. As an example, the pressure distribution on the first layer of cells of the 3/3 lobe combination rotors of a down hole pump passage flows for 1-10 bar pressure rise is presented in Figure 20. The leakage flow through the clearances and blow hole area is shown in the same figure.
.
[image:18.476.77.376.377.541.2]
Figure 21 Pressure field in a pump with 2 female rotors (left) and three female rotors (right)
The numerical grid was similarly generated by the SCORG grid generator, developed for screw compressors. In addition to the standard twin-screw arrangements, this grid generation software can generate multi-rotor arrangements as shown in Figure 21. The pressure distribution for the multi-rotor applications was calculated by StarCCM+. The machine with three female rotors shown in Figure 21 achieves a smaller pressure drop between its interlobes then in the pump with two female rotors. This means that lower leakage flows are achieved in the machine with more female rotors. The integration of pressure force over the rotor surfaces shows that the load on the female rotors is more or less independent of their number.
CONCLUSIONS
Comparison of estimated and measured velocities within a test optical screw compressor has confirmed the validity of CFD methods as a means of calculating both local and bulk velocities within twin screw machines. It has been shown that the modelling accuracy may be further improved by local tuning of the CFD model, including the use of turbulence models suitable for complex pressure driven internal flows.
It has also been shown that CFD modelling can be used not only for estimation of the screw compressor performance, but also for capturing of phenomena not possible by the use of other, simplified models. Case studies confirm that a number of available CFD and CCM software packages can be used for this purpose if combined with the SCORG mesh generator. These applications include prediction of multiphase flows in screw and gear pumps, even in configurations that differ from classical twin screw arrangements.
ACKNOWLEDGEMENTS
The authors gratefully acknowledge contribution and support of all participants in this work.
REFERENCES
1. Alagic S., Stosic N., Kovacevic A., Buljubasic I, A Numerical Analysis of Heat Transfer and Fluid Flow in Rotary Regenerative Air Pre-Heaters, Strojniski Vestnik, Journal of
Mechanical Engineering, Vol 51, 7-8, pp 411-417, 2005
2. Albrecht, H.-E., M. Borys, N. Damaschke and C. Tropea, eds. Laser Doppler and Phase Doppler Measurement Techniques. 2003, Springer.
3. Durst, F., Fluid mechanism developement and advancements in the 20th century, in 10th International Symposium on Applications of Laser Techniques to Fluid Mechanics. 2000: Lisbona.
4. Demirdžić I, Muzaferija S, 1995: Numerical Method for Coupled Fluid Flow, Heat Transfer and Stress Analysis Using Unstructured Moving Mesh with Cells of Arbitrary Topology, Comp. Methods Appl. Mech Eng, Vol.125 235-255
5. Drain, L.E., ed. The laser Doppler technique. 1986, John Wiley: New York.
6. Ferziger J H, Perić, M, 1996: Computational Methods for Fluid Dynamics, Springer, Berlin 7. Guerrato D, Nouri J.M, Stosic N., Arcoumanis, C., Smith I.K., 2007, Flow Development in
the Discharge Chamber of a Screw Compressor. Int. Conf. on Compressors and their Systems, IMEchE, September 2007, London.
8. Kauder K., de Araújo-Rudolph L., Sachs R.: Experimental and numerical investigation of the gas flow using a plane model of male rotor-housing gap in a screw-type machine. Schraubenmaschinen 8, Dortmund 2000
9. Kovačević A, Stošić N, Smith I. K, 2003: Three Dimensional Numerical Analysis of Screw Compressor Performance, Journal of Computational Methods in Sciences and Engineering, vol. 3, no. 2, pp. 259- 284
10. Kovačević A, Stošić N, Smith I. K, 2004: A Numerical Study of Fluid-Solid Interaction in Screw Compressors, International Journal of Computer Applications in Technology (IJCAT), Vol. 21, No. 4, 2004, pp. 148-158
11. Kovačević A 2005: Boundary Adaptation in Grid Generation for CFD Analysis of Screw Compressors, International Journal for Numerical Methods in Engineering (IJNME), vol. 63, 2005
12. Kovačević A., Stošić N, Smith I.K, 2006: Screw Compressors Three Dimensional Computational Fluid Dynamics and Solid Fluid Interaction, ISBN-10: 3-540-36302-5 , Springer Berlin Heidelberg New York
13. Kovačević A., Mujic E., Stošić N, Smith I.K, An integrated model for the performance calculation of Screw Machines, Proceedings of International Conference on Compressors and their Systems, IMechE London, September 2007
14. Kovačević A., Stošić N, Smith I.K, E. Mujic, 2007, CFD Integrated Design of Screw Compressors, Engineering Applications of Computational Fluid Mechanics Vol. 1, No. 2, pp. 96–108
15. Nouri J.M, Guerrato D, Stošić N, Kovačević A, 2006: Cycle Resolved Velocity
Measurements Within a Screw Compressor, 18th International Compressor Engineering Conference at Purdue, Lafayette, Indiana, USA
16. Mujic E, Kovacevic A, Stosic N, Smith IK, The influence of port shape on gas pulsations in a screw compressor discharge chamber, Proceedings of the Institution of Mechanical Engineers, Part E, Journal of Process Mechanical Engineering, 2008
17. Mujic E, A Numerical and Experimental Investigation of Pulsation Induced Noise n Screw Compressors, PhD Thesis, City University London, 2009
18. Peric M.: Flow simulation using control volumes of arbitrary polyhedral shape, ERCOFTAC Bulletin, No. 62, September 2004
19. Steinman A, 2006: Numerical Simulation of Fluid Flow in Screw Machines with Moving Mesh Techniques in ANSYS CFX,” Schraubenmaschinentagung 2006”, Dortmund VDI Berichte
20. Stosic N, 1998: On Gearing of Helical Screw Compressor Rotors, Proceedings of IMechEng, Journal of Mechanical Engineering Science, Vol 213 (Part C): p. 587-594. 21. Stošić N, Smith I.K, Kovačević A., 2005: Screw Compressors Mathematical Modelling and
Performance Calculation, ISBN-10 3-540-24275-9, Springer Berlin Heidelberg New York 22. Vimmr J, Ondrey F, 2006, Numerical Simulation of Leakage Flow Between Moving Rotor