Manuscript submitted to: Volume 2, Issue 3, 260-275.
AIMS
Energy
DOI: 10.3934/energy.2014.3.260
Received date 24 June 2014, Accepted date 22 July 2014, Published date 5 August 2014
Research Article
Wind Turbines Support Techniques during Frequency Drops —
Energy Utilization Comparison
Ayman B. Attya1,*and T. Hartkopf2,*
1 Renewable Energies Section, Technical University of Darmstadt, Land-Graf Georg Str. 4, 64283
Darmstadt, Germany.
2 Renewable Energies Section, Technical University of Darmstadt, Darmstadt, Germany.
* Correspondence: Email: a.attya83@yahoo.com; uni@harkopfnet.de
Abstract: The supportive role of wind turbines during frequency drops is still not clear enough, although there are many proposed algorithms. Most of the offered techniques make the wind turbine deviates from optimum power generation operation to special operation modes, to guarantee the availability of reasonable power support, when the system suffers frequency deviations. This paper summarizes the most dominant support algorithms and derives wind turbine power curves for each one. It also conducts a comparison from the point of view of wasted energy, with respect to optimum power generation. The authors insure the advantage of a frequency support algorithm, they previously presented, as it achieved lower amounts of wasted energy. This analysis is performed in two locations that are promising candidates for hosting wind farms in Egypt. Additionally, two different types of wind turbines from two different manufacturers are integrated. Matlab and Simulink are the implemented simulation environments.
Keywords:wind turbine; wind energy; frequency drop; frequency support; de-loading
Nomenclature
WF Wind Farm
WS Wind Speed
SOs System Operators WT Wind Turbine
MPT Maximum Power Tracking KE Kinetic Energy
Pop Wind turbine output mechanical power
ρ Air density
A Rotor area
β Pitch angle of wind turbine rotor blades Cp Wind turbine performance coefficient
λo Optimum tip speed ratio
λHigh Higher tip speed ratio than optimum value
R Rotor radius
WScut-out Wind turbine cut-out wind speed WScut-in Wind turbine cut-in wind speed DFIG Double Fed Induction Generator DF De-loading Factor
WSB Base wind speed in partial de-loaded operation algorithm WSlow Low wind speed in partial de-loaded operation algorithm EMPT1 Generated energy by wind turbine based on MPT1 curve EMPT2 Generated energy by wind turbine based on MPT2 curve
EOS Generated energy by wind turbine operated using over-speeding algorithm ED Generated energy by wind turbine operated using de-loaded algorithm
EPD Generated energies by wind turbine operated using partial de-loaded algorithm
1. Introduction
frequency events. To achieve this aim, WTs are not operated based on maximum power tracking (MPT), but other control methods for speed and/or torque. Generally, the stored kinetic energy (KE) in WT plays a pivot role in these algorithms for example, extractable stored KE is converted into fixed amount of supportive active power during frequency drops elimination [5, 8]. The provision of inertial response by DFIG through artificial speed coupling, and its effects on the machine behavior were analyzed in [9]. On the other hand, WT output power and rotational speed are controlled together to provide active power over-production during frequency excursions. The three offered control regions were classified according to WT rotational speed. Meanwhile, pitch angle influence was neutralized by fixing the pitch angle as long as the WS is below its rated value (WSR) [10].
WT de-loading (some literature calls it “de-rating”) technique is highlighted in [11], such that WT output power is reduced by certain percentage; hence the frequency support is insured by the deficit between optimum and de-loaded power values. Proposed method did not cause any reduction in WT rotational speed; on the contrary, over-speeding technique was implemented to de-load the WT output. Further strategy is presented in [12], where pitch angle control is utilized to keep WT output de-loaded to a predetermined reference value below its optimum. An interesting conclusive comparison is offered in [13] between controlling WT as a conventional generator using droop theory from one side to virtual inertia principle on the other side. It also compared between keeping fixed reserve of active power, regardless the actual output, and keeping a variable reserve relative to the actual output through a fixed percentage (the paper called those two techniques “Balance and Delta” respectively).
Completely different point of view rejects any de-loading or reduction in WFs output, but it counts on energy storage mediums as a solution to curtail the influence of wind power generation intermittent nature. Wide range of energy storage facilities are discussed in literature, mainly, hydro pumping stations, batteries’ banks and flywheels [14]. The usage of energy storage eliminates any possibility for wind energy wasting; in contrast, more energy amounts are utilized in charging storage mediums, when the WFs’ outputs are high enough so that they are rejected by the grid [15]. The word ‘rejected’ reflects the conditions of load, conventional generation, and WFs’ output, where a portion from WFs output is not utilized to maintain the penetration level of wind power under certain threshold. As an explanation, SOs imposes strict margins on instantaneous wind power penetration in generation mix (i.e. WFs contribution in demand feeding should not exceed certain percentage from the overall generation). These restrictions are applied to minimize the expected drawbacks of sporadic nature of wind power especially, in case of sudden faults and events. Nevertheless, economic constrains halt the expansion of storage solutions, especially, batteries. In addition, geographical and technical problems might face hydro pumping storage plants, and fly wheels ratings are limited.
This paper compares between the amounts of wasted energy according to the integrated support technique. The authors have already presented an algorithm which provides competitive support power during excursions [7]. One of the claimed advantages for this algorithm is reducing the amount of wasted energy compared to other techniques. Thus, the authors demonstrate their claim by comparing the amounts of energies wasted in both de-loading techniques, with respect to the amount of generated energy in case of MPT operation.
authors is also presented. The second section also explains applied assessment method for generated energy and the investigated case studies. Third section highlights results and draws light on the merits and cons of each technique, and the last section concludes.
2. Materials and Method
2.1. MPT operation:
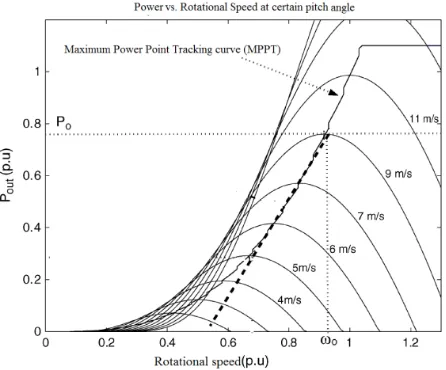
The WT output power (Pop) depends on three variable parameters, markedly, rotational speed,
WS and pitch angle as illustrated by (1) (A and ρ stand for rotor swept area and air density respectively). The integration of pitch angle (β) and rotor speed with the aerodynamic properties of WT decides the optimum value of performance coefficient (Cp) whose empirical formula is (2) (i.e.
c1 to c6, a and b are constants which differ from one WT type to another [16]). Consequently, the
optimum tip speed ratio (λo), which achieves optimum Cp of each WT type is obtained. The WT
rotational speed is adjusted such that Cp is tracking its optimum value all the time. This constrain is
fulfilled by adjusting the value of rotational speed continuously to maintain λ = λo at all WSs using
(3), where R stands for rotor radius in meters. Figure (1) illustrates the variation of rotational speed, at different WSs, and the corresponding Pop in per unit (p.u.). It is worth mentioning that; β is
increased gradually as soon as WS exceeds WSR. Pitch angle avoids Pop from violating the ratings of
WT generator. In fact, when WS increases beyond the cut-out WS (WScut-out), WT stops to avoid
physical damage [17].
3
0.5
op P
P C A WS (1)
5/
1 2 3 4 6
3 ( , ) ( / ) 1 1 ( ) 1 i p c i i i
C c c c c e c b a (2)
R rotor speed WS
(3)
The question now is how to simulate the estimation of optimum power value at each WS according to MPT operation. This paper represents the two following approaches to obtain WT performance curves fulfilling MPT:
2.1.1. Manufacturer power curve (MPT 1)
The WT fabricating company provides a standard power curve for each WT type where Pop at
each WS is indicated within the margin between WScut-in and WScut-out. These power values are based
on continuous monitoring for WT performance, and they are the average value of several records at the same WS. Power curve data is manipulated into a lookup table with appropriate interpolation method; hence optimum Pop is estimated at any WS using interpolation. The most critical region of
Figure 1. WT output power in MPT operation at different WSs.
2.1.2. Optimum power evaluation using WT model (MPT 2)
This method aims to minimize possible errors in the first one, and it counts mainly on WT model and Cp equation constants. It is well known that variable speed WT has certain range of rotor
speeds which is predetermined by the manufacturer. Therefore, the control algorithm driving the WT should not violate these limits to avoid possible loss of synchronism or physical damage. In the proposed algorithm, Pop at certain WS is evaluated, using (1 – 3), at all the allowed rotor speeds.
Thus, maximum (i.e. optimum) possible Pop is determined at each WS starting from WScut-in till WSR.
However, the step between two successive WSs (i.e. WS class; for example., WS class = 0.5 m/s thereupon, the examined WSs are; WScut-in + 0.5, WScut-in + 2×0.5, WScut-in + 3×0.5,…., WSR -
0.5) contributes in the accuracy of the obtained look-up table. In other words, reducing WS class mitigates the role of applied interpolation method, hence error is reduced. Illustrative Figures are provided in results section based on the considered case studies.
It should be highlighted that applying MPT algorithm makes the WT incapable of providing any active power support during frequency excursions, except with the integration of energy storage mediums. However, there still major economic obstacles, which halt the spreading of energy storage techniques to act as system saver during frequency deviations [18].
2.2. Frequency Support techniques
This section explains briefly the WT operation in over-speeding, de-loading and the proposed innovative support technique (it will be called from now on “partial de-loading”). In addition, it explicates the same method that is previously used to construct performance curves of WT in normal operation, but according to the investigated support algorithms.
2.2.1. Over-speeding operation
and extractable KE. The authors proposed an algorithm which controls the extractable KE by increasing WT rotor speed above its optimum value [5]. Offered algorithm maintains a higher value for λ, hence rotor speed increases, and then the available KE is enlarged. In particular, new value of λ
is called λHigh, which is more than λo by 15 % in this research work. In sequence, λHigh is used to
evaluate rotor speed at each WS using (4). Afterwards, the three parameters, namely, WS, rotor speed and β are used to estimate Pop using (1 – 2). It is worth mentioning that, over-speeding is valid only
in the range (WScut-in < WS < WSR). As an illustration, starting from WSR, WT operates at its
maximum rotor speed, thus it is invalid to over-speed the WT and violate the rotor speed limits. Moreover, the pitch angle in the considered range always equals to zero, because Pop doesn’t exceed
its rated value. Theoretically, the deviation from λo will reduce the amount of generated power in
normal operation leading to energy losses compared to MPT.
1.15
High i i
High o
WS Rotor speed
R
(4)
2.2.2. Continuous de-loading operation
WT is operated such that Pop is less than the optimum available power all the time. Thus, the
deficit between the actual output power, and the optimum one is considered as a strategic reserve to support the system during frequency deviations. As mentioned in the first section; de-loading could be applied by two methods:
Running the WT at rotational speed higher than the optimum speed (i.e. note that the optimum speed is the speed that leads to λ = λo). This method is called WT over-speeding which is valid
only for variable speed WTs (e.g. DFIG and Fully rated synchronous generator)
Activating pitch control at all WSs so that Pop is reduced based on the implied pitch angle. This
technique is applicable for any WT equipped with pitch angle controls. However, pitching is a slower alternative due to mechanical response of servo motors controlling blades feathering [17].
In both methods a predefined de-loading factor (DF) is selected by SOs according to their
required contribution of WFs in frequency drops mitigation. DF numerical value is adjusted based on
several givens including the level of WFs penetration in system and the history of frequency excursions in the system. Moreover, it is not necessary that all WFs have the same DF, but it counts on
the number and the nameplate ratings of WTs inside each WF. In this paper, it is assumed that DF
equals 15 %, and the minor differences between the two methods are ignored (i.e. WT de-loaded power is the same in both methods).
2.2.3. Partial de-loading algorithm
The major merits and uniqueness of this algorithm lie in three points; 1) it is adapted with WT and WS conditions in the WF location, 2) the de-loading is activated only within certain range of WS which is determined based on certain procedure, 3) its capability to handle WS drops, which intersect with frequency events, reducing the negative impact of WS sudden dips. The first step is to evaluate the pivot three parameters of proposed algorithm, namely, 1) base rotational speed, 2) base WS (WSB)
the WT type, installed in the WF, at the annual average WS in this location for the whole range of rotational speeds. Thus, the rotational speed yielding the highest Pop is selected as base value.
Likewise, the Pop arrays at base rotational speed are obtained at wide spectrum of WSs; WS at which,
Pop is within the range of 0.6 to 0.7 p.u. (with respect to nameplate rating) is selected as WSB.
Finally, WSlow is found to be 70 % from WSB according to extensive experiments. The proposed
algorithm operates WT in de-loaded operation within the WS range (WSlow < WS < WSR).
De-loading is implied using pitch angle control. It is worth mentioning that, when WS exceeds WSB by
certain margin, rotor speed is allowed to accelerate above its base value, hence higher Pop is supplied,
and more energy is harvested. At rated Pop, the de-loading is deactivated to utilize all the available
wind energy, and support is achieved by overloading the WT generator for a predefined duration. When instantaneous WS drops, KE is extracted from WT rotating parts by fixing the former Pop, and
decelerating the rotational speed to a new speed that avoids loss of synchronism. In words, de-loading is applied at the following conditions: 1) WSlow < WS < WSR and 2) normal Pop is less than 1 p.u.
Further details about this algorithm are not prerequisites to perform or comprehend the wasted energy analysis considered in this paper.
2.3. Wasted energy assessment
This subsection explains the method used to estimate the amount of generated energy by WT within certain time span according to a given chronological WS array. Therefore, the amount of wasted energies in the discussed frequency support algorithms, are evaluated and compared. WS chronological arrays in certain locations are the input to the constructed look-up tables to estimate the generated wind power within the required time span. A simplified method is implemented to estimate the generated energies using (5 – 8).
2
1 1 2
1 1
,
op MPT n
N N
MPT op MPT n WS MPT WS
n n
E P t E P t
(5)1
N
OS op OS WS
n
E P t
(6)2 (1 )
100
D MPT
DF
E E (7)
1
N
PD op PD WS
n
E P t
(8)EMPT1 and EMPT2 stand for generated energies within considered time span (T), when the output
of WT is predicted based on MPT curves that are explained in Subsections 2.1 and 2.2 respectively. EOS, ED and EPD stand for the generated energies within T, when WT operates using over-speeding,
de-loaded and partial de-loaded strategies respectively. The time step (i.e. time duration between each two successive WSs records) of the available chronological WS array is tWS, and N is the number of
WSs records within T.
Pop is evaluated based on the performance curves of WT type, and the implemented operation
data is obtained from the WT performance curve. However, the transients occurring during the shift from one WS to the next one are ignored due to their minor impact on the generated energy [19].
In general, the energy is the integration of power during time, and as the time deficit between each two successive WS records is fixed (i.e. tWS), hence the energy produced at each WSi is
equivalent to the product of corresponding Pop-i and tWS. Meanwhile, Pop is reduced by DF from MPT2
in continuous de-loading operation as implied in (7). Finally, the amount of wasted energy is calculated with correspondence to EMPT2, for example, the difference between EMPT2 and ED represents
the wasted energy due to the application of continuous de-loading method. 2.4. Case studies
To emphasis the impact of WS conditions and WT type on the wasted energy in each operation algorithm; two different locations and two WTs types namely, Gameza-90 2 MW (G-90), and General Electric-77-1.5 MW (GE-77) [16, 19], are involved in the presented analysis. Both WTs are characterized by a medium rated output, moderate size, average costs hence they are widely integrated in many WF. In addition, the GE-77 is almost the only WT whose aerodynamic parameters are identified in the MATLAB Simpower library, meanwhile the aerodynamic parameters of G-90 were previously estimated by the authors in [16]. It is not preferred to imply the analysis on a huge WT (e.g., Nordex 117-2.4 MW), as it will provide an optimistic view about the expected losses due to its aerodynamic characteristics, especially at low WSs. On the other side, highly rated WT (e.g., Enercon 101-3.05 MW) is also avoided, as it will aggravate the expected losses margins.
The two locations are selected from WFs candidate sites according to the Egyptian authority of new and renewable energies, namely, Nabq and Ghareb [20]. These two sites are dissimilar in WS conditions as indicated by table (1), such that Ghareb site is characterized by high annual average WS, in contrast to Nabq location with a lower average. These two locations are selected in Egypt because the fund covering this research is partially directed to investigate the Egyptian wind energy prospects. The available WS data are average WSs recorded every 10 minutes (i.e., tWS = 10 minutes and 52560
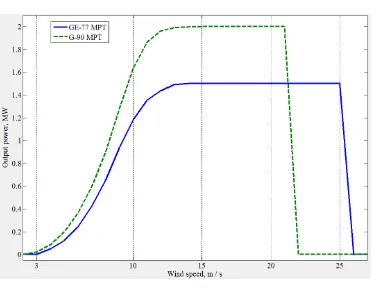
Figure 2. Manufacturer power curves of GE-77 and G-90.
Table 1. Selected locations WS characteristics.
Index Average Max. Cat*. 1 Cat. 2 Cat. 3 Cat. 4 Cat. 5 Nabq 6.9 m/s 18.4 m/s 25.3% 22.5% 15.1% 14.1% 13.3% Ghareb 9.8 m/s 20.1 m/s 7.1% 7.7% 13.1% 21.2% 21.8%
*: Cat. stands for ‘category’, and its value is the annual rate of occurrence based on the available WS chronological data (i.e., how many records from the overall 52,560 annual records)
Table 2. WS ranges of each category in m/s.
Cat. 1 2 3 4 5
WS range WS ≤ 4 4 < WS ≤ 6 6 < WS ≤ 8 8 < WS ≤ 10 10 < WS ≤ 12 Table 3. Technical specifications of Integrated WTs types.
WT type GE-77 G-90
Manufacturer General Electric Gameza
Rotor diameter, m 77 90
Hub height, m 80 78
Cut-in WS, m/s 3.5 3
Cut-out WS, m/s 25 21
Default rated WS, m/s 13 16
Nameplate rating, MW 1.5 2
Rotational speed range, radians/s 1.15 -2.51 0.94 -1.99
3. Results and discussion
3.1. Obtained performance curves
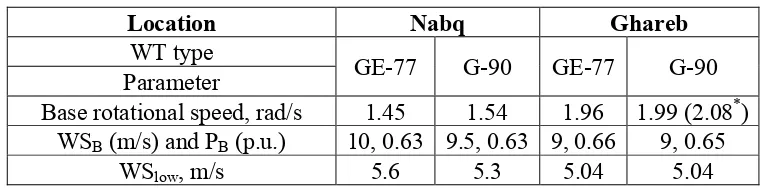
First of all, the pivot parameters of the proposed partial de-loading algorithm, clarified in Subsection 2.3, are estimated in the two locations with respect to the two WTs types. There is no big difference between the WTs dimensions and ratings, hence no major deviations in the parameters values as depicted in table (4). For example, the difference in base rotational speed between G-90 and GE-77 is just 0.09 rad/s to the favor of G-90. Likewise, WSB of G-90 is slower, because it has greater
rotor diameter. It is worth mentioning that in Ghareb site pre-analysis showed that, base rotor speed for G-90 should be 2.08 rad/s (the highlighted value in table (4)). However, this theoretical value exceeds the maximum allowed speed of G-90, hence the base speed is adjusted to the WT speed ceil, namely, 1.99 rad/s. In particular, the high average WS in Ghareb makes the WTs able to run at high base rotational speed without dissipating energy. On the contrary, WSB is less compared to Nabq site
as the high rotational speed makes the WT reaches PB at slower WS. For further illustration, the
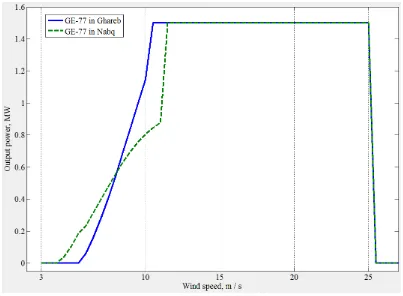
performance curves of GE-77, in case of partial de-loading algorithm, in the considered locations, are shown in figure (3). The breakpoint of Nabq curve is noticed at 12 m/s, because beyond this WS, the rotational speed can increase above its base value without decreasing Pop, but it increases. Conversely,
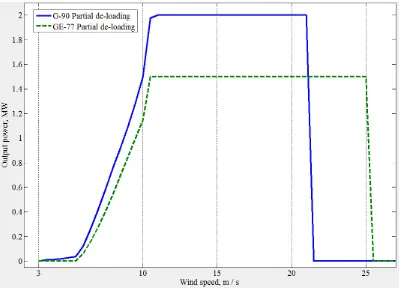
[image:10.595.99.501.434.724.2]breakpoint occurs at slower WS, namely 10 m/s in Ghareb, due to the higher base rotational speed. A comparison between GE-77 and G-90, implementing partial de-loading technique, is depicted in figure (4). It is interesting that, both WTs reach their rated output at almost the same WS, although their default rated WSs deviates by 3 m/s.
Figure 4. Partial de-loading performance curves for GE-77 in both sites.
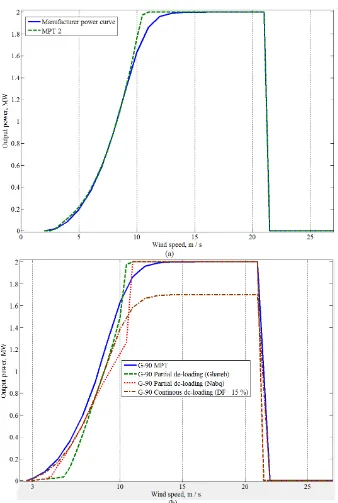
For extended clarification, figure (5) displays all G-90 power curves implied in this paper. Firstly, the manufacturer power curve, namely MPT, is compared to the obtained MPT2. The two curves are almost typical except the dissimilarity at the WSs just before the WT reaches rated Pop, where in
MPT2 curve, Pop is higher through this WS range. Likewise, a minor discrimination occurs at
relatively low WSs just beyond the WScut-in. These deviations return to the recording methods applied
Figure 5. Performance curves for G-90 in all conditions and sites.
Secondly, the breakpoint of Nabq curve lags that of Ghareb. This returns to the low average WS in Nabq location, hence, base rotational speed is slower. Consequently, the WT speed exceeds its base speed without reducing its Pop at higher WS. Thirdly, at very low WSs, Nabq curve yields
higher Pop compared to Ghareb. On the contrary, at medium WSs, Ghareb site has the superiority
over Nabq. As an illustration, the de-loaded operation parameters are adapted for low WSs in Nabq due to the lower average WS in this site. Finally, the MPT and the continuous de-loaded curve are typical in attitude. However, the MPT is only rescaled by DF factor to produce the continually,
Table 4. Proposed algorithm parameters in two locations.
Location Nabq Ghareb
WT type
GE-77 G-90 GE-77 G-90
Parameter
Base rotational speed, rad/s 1.45 1.54 1.96 1.99 (2.08*) WSB (m/s) and PB (p.u.) 10, 0.63 9.5, 0.63 9, 0.66 9, 0.65
WSlow, m/s 5.6 5.3 5.04 5.04
*: The value between brackets indicates that, the WT maximum speed limit is violated in the assessment of base rotor speed. Thus, base rotor speed is adjusted to the maximum value.
3.2. Wasted energy analysis
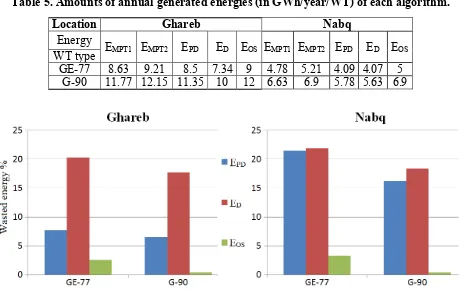
The generated electrical energies through one year, according to the available WS arrays in each location, from one WT in all cases, are gathered in table (5). Achieved results insure that MPT2 curve revealed better operation points for the WT that is why EMPT2 is higher than EMPT1 in all cases.
Nevertheless, the deviations between the two methods fluctuate according to WT type and WS nature in the considered location. In particular, Ghareb has better WS conditions compared to Nabq, hence the impact of the difference between MPT2 and standard power curve increased (i.e., in Nabq EMPT2 is
higher by 270 MWh compared to 380 MWh in Ghareb). Although the rating of 90 is more than G-77, but the difference between EMPT2 andEMPT1in Ghareb, is higher to the favor of GE-77 by 200
MWh. This could be justified by the accuracy and nature of aerodynamic models of both WTs types. The implementation of over-speeding technique wastes the lowest amount of energy according to table (5) and figure (6). This merit is achieved by over-speeding technique because: 1) it reduced Pop
by a small margin, 2) it has a limited activation range (WScut-in < WS < WSR), compared to continuous
de-loading technique. However, the provided support power from this algorithm is less compared to the other two methods, and it totally depends on the amount of extracted KE. Additionally, this algorithm must decelerate the rotor speed during frequency events, which consumes the electronic converters and increases the risk of loss of synchronism. Moreover, the rotor speed needs to recover its default value after support period, thus Pop is reduced until rotor speed satisfies λHigh again.
On the other hand, EPD is more than ED in all cases. In Ghareb site with GE-77 installed, the
partial de-loading technique wasted 7.5 %, with respect to EMPT2, compared to 21 % wasted by
continuous de-loading method. However, the superiority of partial de-loading is reduced in Nabq because the implied continuous de-loading wasted 21.9 % meanwhile partial de-loading wasted 21.4%. This might be seen trivial, but if the price of kWh based on Egyptian tariff is acknowledged, it means that the single WT wastes annually about 2390 € when it is continuously de-loaded (0.5 % x 4.78 GWh x 0.1 €/kWh). This value is enormously multiplied when the number of WTs in each WF is considered. The results of G-90 emphasize the great losses occurred due to continuous de-loading, as the rating of WT is greater, hence more energy is wasted (keep in mind that, DF is a percentage from
Pop not a fixed power amount). For example, in the lower WS site, Nabq, partial de-loading wastes 16 %
the negative influence caused by frequency support algorithms integrated into WT. Therefore, it neutralized the impact of aggregation method by comparing the output of two independent WTs. Moreover, the inclusion of WSs wake and tower effects inside the WF is expected not to cause a great deviation. As an illustration, all the WTs inside a WF should be running by the same algorithm [22]. Hence, the new reduction in WF energy is caused by WS propagation through WF terrain. As an illustration, wake effects and towers shadowing reduce incident WSs on WTs (compared to free stream speed), hence Pop of those affected WTs are curtailed. Accordingly, single WT is considered in
[image:14.595.67.528.234.525.2]this research work to neutralize the impacts of WFs dispatching and aggregation that are almost independent from WT operation algorithm.
Table 5. Amounts of annual generated energies (in GWh/year/WT) of each algorithm.
Location Ghareb Nabq
Energy EMPT1 EMPT2 EPD ED EOS EMPT1 EMPT2 EPD ED EOS
WT type
GE-77 8.63 9.21 8.5 7.34 9 4.78 5.21 4.09 4.07 5
G-90 11.77 12.15 11.35 10 12 6.63 6.9 5.78 5.63 6.9
Figure 6. Ratios of wasted energies of all support algorithms compared to MPT 2.
4. Conclusions
energy in the rotating parts of wind turbines, so that that this energy is converted into supportive power during frequency events. However, both methods are double edged weapons. Considering de-loading operation; certain amount of wind energy is wasted in normal mode. Additionally, wind turbine deceleration increases the risk of loss of synchronism, besides the recovery period required by the wind turbine to return to its default speed. This paper compared between these support techniques based on the amount of wasted energy, with respect to MPT operation. Results reveal the considerable differences between the two derived MPT curves, and their effect on harvested energy estimation. Outcomes insured the advantage of partial de-loading algorithm in the form of wasted energy reduction, and mitigating fluctuations in rotational speed of wind turbine.
References
1. Holttinen H, Orths AG, Eriksen PB, et al. (2011) Currents of changes. IEEE Power Energy Magazine 9(6): 47-59.
2. Kundur P. (1994) Power System Stability and Control. New York: McGraw-Hill Inc.
3. Ekanayake J, Jenkins N (2004) Comparison of the response of doubly fed and fixed-speed induction generator wind turbines to changes in network frequency. IEEE T Energy Conversion 19(4): 802-812.
4. Muyeen S, Takahashi R, Murata T, et al. (2009) Low voltage ride through capability enhancement of wind turbine generator system during network disturbance. IET Renewable Power Generation 3(1): 65-74.
5. Attya A, Hartkopf T (2013) Control and quantification of kinetic energy released by wind farms during power system frequency drops. IET Renew Power Generation 7(3): 210-224. 6. Attya AB, Hartkopf T (2012) Penetration impact of wind farms equipped with frequency
variations ride through algorithm on power system frequency response. INT J Electric Power
40: 94-103.
7. Attya AB, Hartkopf T (2014) Wind turbine contribution in frequency drop mitigation – Modified operation and estimating released supportive energy. IET J Generation Transmission and Distribution 8: 862-872.
8. Rahmat UN, Thiringer T, Karlsson D (2008) Temporary Primary Frequency Control Support by Variable Speed Wind Turbines-Potential and Applications. IEEE T Power Systems 23(2): 601-612.
9. Gautam D, Goel L, Ayanar R, et al. (2011) Control Strategy to Mitigate the Impact of Reduced Inertia Due to Doubly Fed Induction Generators on Large Power Systems. IEEE T Power Systems 26(1): 214-224.
10.Chang-Chien L, Lin W, Yin Y (2011) Enhancing Frequency Response Control by DFIGs in the High Wind Penetrated Power Systems. IEEE T Power Systems 26(2): 710-718.
11.de Almeida R, Peas LJ (2007) Participation of Doubly Fed Induction Wind Generators in System Frequency Regulation. IEEE T Power Systems 22(3): 944-950.
12.Le-Ren CC, Yao-Ching Y (2009) Strategies for Operating Wind Power in a Similar Manner of Conventional Power Plant. IEEE T Energy Conversion 24(4): 926-934.
189-199.
14.Martinez J, (2011) Modeling and characterization of energy storage devices. IEEE Power and Energy Society General Meeting; San Diego, CA.
15.Etherden N, Bollen M (2013) Dimensioning of Energy Storage for Increased Integration of Wind Power. IEEE T Sustainable Energy 4(3): 546-553.
16.Attya A, Hartkopf T (2012) Evaluation of Wind Turbines Dynamic Model Parameters using Published Manufacturer Product Data. IEEE International Energy Conference and Exhibition; Florence.
17.Ackermann T, (2005) Wind Power in Power Systems; John Wiley & Sons Ltd.
18.Yao D, Choi S, Tseng K, et al. (2012) Determination of Short-Term Power Dispatch Schedule for a Wind Farm Incorporated With Dual-Battery Energy Storage Scheme. IEEE T Sustainable Energy 3(1): 74-84.
19.Attya A, Hartkopf T (2013) Wind Energy in Egypt- Capacity Assessment and Analyzing Penetration Impact on Grid Frequency. IEEE 4th International conference on power engineering, energy and electrical drives; Istanbul.
20.Miller N, Price W, Sanchez-Gasca J (2003) Technical Report-Dynamic modeling of GE 1.5 and 3.6 wind turbine-generators; General Electric Company.
21.Mortensen NG, Said US (2009) Wind Atlas for Egypt. New and Renewable Energy Authority; Cairo.
22.Attya AB, Hartkopf T (2013) Wind farms dispatching to manage the activation of frequency support algorithms embedded in connected wind turbines. INT J Electric Power 53(1): 923-936.