Accepted author manuscript of the following research output: Tezdogan, T., & Taylan, M. (2011). A comparative study on ship motions: theory vs. model experiments. 329-335. Paper presented at 1st International Symposium on Naval Architecture and Maritime, Istanbul, Turkey.
A Comparative Study on Ship Motions: Theory vs. Model Experiments
Tahsin Tezdogan
Research Assistant, Istanbul Technical University, Turkey, [email protected]
Metin Taylan
Professor, Istanbul Technical University, Turkey, [email protected]
Abstract
The best way of validating theory on ship motions is to compare the outcome with that of the experimental analysis. In this work, a commercial seakeeping package, which is based on the strip theory, has been utilized. The software provides motion predictions and sea loads using 2-D linear strip theory of Salvesen et al. (1970).
This paper presents the comparative study of theoretical ship motions with experimental work. Detailed analyses were performed for a series 60 ship having block coefficient of 0.70 and a cargo ship in regular head waves using the software, and then the results were compared with the experimental data. For a series 60 ship form, experimental results are available in the literature, whereas for the cargo ship, the model experiments were conducted at ITU Ata Nutku Ship Model Testing Laboratory.
The results were presented in graphical form, and discussed in details.Comparing the output of the software with the experimental results for both vessels, it may be said that there is a considerable correlation between them.
Keywords
Seakeeping, Strip Theory, Ship Motions, Experiment
1. Introduction
obtained by the aid of the software for varying ship speeds, headings and wave frequencies. The results were compared with model experiments for both ship types.
First of all, transfer functions for series 60 form in regular head waves at zero speed are computed and compared with experimental data found in literature. In the following section, motions of a cargo ship with transom stern is examined. These results are compared with experiments data obtained in model ship laboratory of ITU.
2. Comparison of Response Amplitude Operators
Under the assumptions that the responses are linear and harmonic, the equations of motion for a ship advancing at constant forward speed with arbitrary heading in regular sinusoidal waves can be written in the following form:
6 1 , e i tjk jk k jk k jk k j
k
M A
B
C
F e
&& & j1, 2,3,...,6(1)
where Mjk are the components of the generalized mass matrix, Ajk and Bjk are the added mass and damping
coefficients, Cjk are the hydrostatic restoring coefficients, and Fj are the complex amplitudes of the exciting
force and moment. j=1,2,3,…,6 refer to the surge, sway, heave, roll, pitch, and yaw motion, respectively. The dots stand for time derivatives (Sarioz et al, 2000).
2.1 Series 60 CB=0.70 form
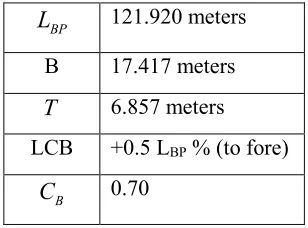
[image:2.612.229.383.566.680.2]The general characteristics of sample Series 60 ship studied in this paper is given in table 1. The body plan of the ship form is illustrated in figure 1.
Table 1. Principal dimensions of the series 60 CB=0.70 form
BP
L 121.920 meters
B 17.417 meters
T 6.857 meters LCB +0.5 LBP % (to fore)
B
Fig. 1. Body plan of the series 60 CB=0.70 form (Sarioz et al, 2000)
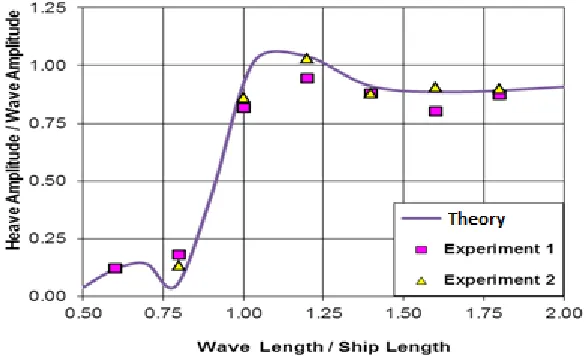
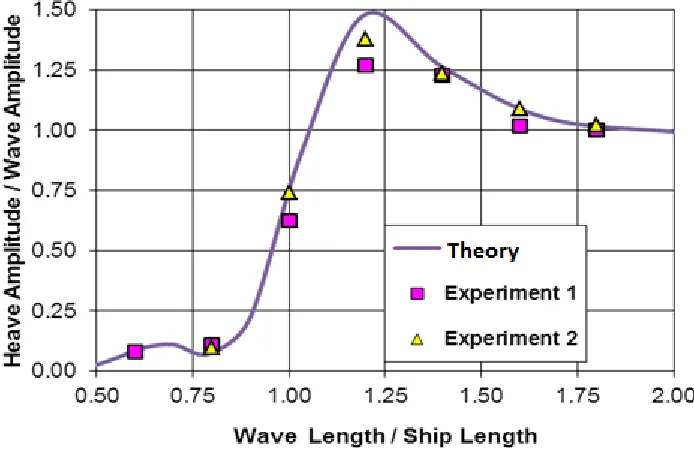
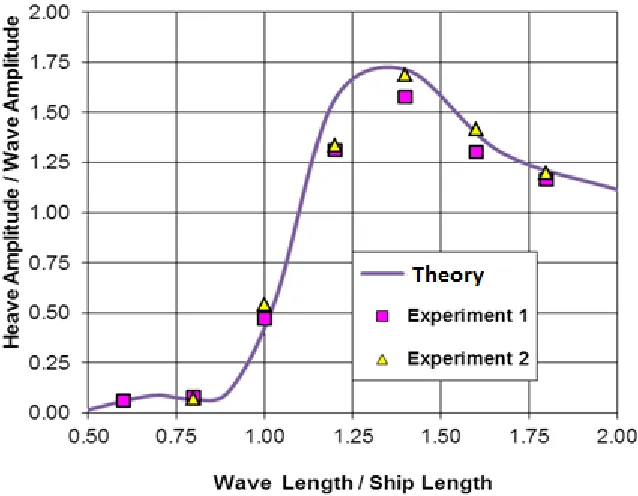
Heave and pitch RAOs for series 60CB=0.70 formare calculated by using the software, and the outputs of
the software are compared with experimental results, extracted from reports of Gerritsma and Beukelman (1966). The experiments were conducted for different model speeds corresponding to Fn=0.15, 0.20, 0.25, and 0.30 in regular head waves. Heave and pitch amplitudes and phases in head seas were measured in regular waves with two different wave height to wave length ratio, namely 1/50 and 1/40 (Sarioz et al., 2000)
All these comparisons are shown between figure 2 and 9.
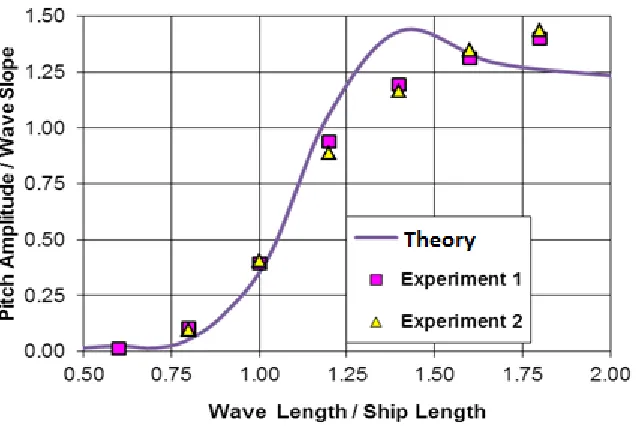
Fig. 3. Comparison of pitch RAO for series 60 CB=0.70 form (Fn=0.15, head waves)
[image:4.612.131.478.378.604.2]Fig. 5. Comparison of pitch RAO for series 60 CB=0.70 form (Fn=0.20, head waves)
[image:5.612.148.467.367.615.2]Fig. 7. Comparison of pitch RAO for series 60 CB=0.70 form (Fn=0.25, head waves)
[image:6.612.143.468.337.576.2]Fig. 9. Comparison of pitch RAO for series 60 CB=0.70 form (Fn=0.30, head waves)
As given between figure 2 and figure 9, it may be said that the outputs of the software are quite compatible with the experimental results even in high Froude numbers. These results may indicate that the software is successful at application of linear strip theory to series 60 forms in regular head seas.
2.2 Cargo ship form with transom stern
Some seakeeping experiments have been conducted in ITU Ata Nutku Ship Model Testing Laboratory for a cargo ship with transom stern for varying model speeds corresponding to Fn=0.0, 0.089, 0.1425, and 0.2138 in regular head waves. Heave and pitch RAOs for the ship and added resistance due to waves are computed in consequence of the experiments. The analytical analyses for the same conditions are made by the aid of the software. All analyses values are illustrated in the same graphic in order to see the difference and make a clear comparison.
The principal properties of the ship form are given in table 2. Strip theory is actually very suitable for slender ship forms. The cargo ship has a fuller hull form (CB=0.80), so it may not be appropriate for linear strip
theory application. Besides she has a transom stern which makes end effects correction mandatory. “This is a correction to the hydrodynamic coefficients for the effects at the aftermost station” (BMT, 2001). Classic strip linear theory does not include these corrections, since it assumes that ship sectional area varies gradually along the ship length (McTaggart, 1997). However, this is not applicable to a transom stern ship. End effect correction is applied to the cargo ship int.
Table 1. Principal dimensions of the cargo ship (Tezdogan, 2011)
BP
L 84.94 meters
B/T 2.44
B
C
0.80s
V
12 knots 5906 tons
Heave and pitch RAOs for the cargo ship at zero ship speed are given in figure 10.
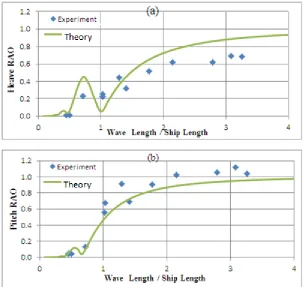
Fig. 10. Comparison of a) heave RAO, b) pitch RAO for the cargo ship (Fn=0.00, head waves)
[image:8.612.154.459.339.626.2]outputs of the software. According to these graphics, it may be noted that there is a strong concordance between experiments and the software.
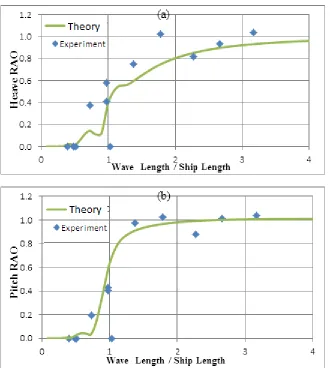
Fig. 12. Comparison of a) heave RAO, b) pitch RAO for the cargo ship (Fn=0.1425, head waves)
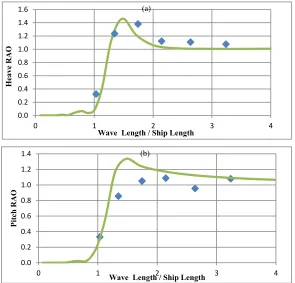
Fig. 13. Comparison of a) heave RAO, b) pitch RAO for the cargo ship (Fn=0.2138, head waves)
0.0 0.2 0.4 0.6 0.8 1.0 1.2 1.4
0 1 1 2 2 3 3 4 4
Hea
ve
R
A
O
Wave Length / Ship Length
(a) 0.0 0.2 0.4 0.6 0.8 1.0 1.2 1.4
0 1 1 2 2 3 3 4 4
Pit
ch
R
A
O
Wave Length / Ship Length (b) 0.0 0.2 0.4 0.6 0.8 1.0 1.2 1.4 1.6
0 1 2 3 4
Hea
ve
R
A
O
Wave Length / Ship Length
(a) 0.0 0.2 0.4 0.6 0.8 1.0 1.2 1.4
0 1 2 3 4
Pi tc h R A O
Wave Length / Ship Length
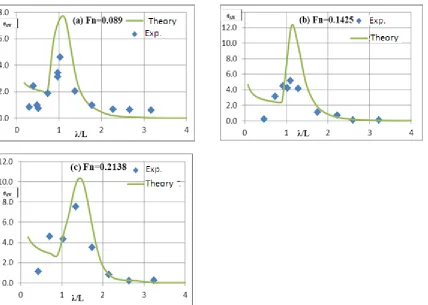
[image:10.612.159.454.401.684.2]Fig. 14. Comparison added resistance for the cargo ship for varying Froude numbers in regular head waves a)Fn=0.089, b)Fn=0.1425, c)Fn=0.2138
The added resistance prediction in the software is performed using the near-field method given by Faltinsen et al. (1980). The added wave resistances of the cargo ship for varying Froude numbers are shown in figure 14. Horizontal axis of the graphic is wave length to ship length ratio, and the vertical axis is non-dimensional added resistance coefficient. This coefficient is given in equation 2:
Non-dimensional added resistance coefficient: 2 2
( / )
AW AW
a
R
g B L
(2)
Conclusions
A comparative study of ship motions between the theory and experiment has been presented in this study. Basic ship motions, derived responses such as vertical and lateral accelerations, added resistance, motion induced interruption, slamming, propeller emergence, deck wetness, and sea loads, as well are computed for ships in regular and irregular seas in the software for varying ship speeds, headings and wave frequencies. However, only heave and pitch regular wave responses, i.e. the transfer functions or response amplitude operators (RAO) have been calculated and compared to experimental results within the scope of this paper. In addition, prediction of added resistance due to waves in regular head seas have been made by using the software and compared to the experimental data conducted in in ITU Ata Nutku Laboratory. Seakeeping analyses have been performed for two different ship types: a series with 60 CB=0.70 form and
a cargo ship which has a fuller form. All the results given in a comparative form were shown in details in the paper. The intrinsic approach of the software provides fair agreement with experimental results with respect to all graphics. Finally, reliability of the software to predict the ship motions was tried to present in the paper.
Acknowledgements
The authors wish to thank Prof. Kadir SARIOZ, who shared views and some documents and also Assoc. Prof. Emin KORKUT for his contribution in the experiments.
References
British Maritime Technology (BMT), (2001). ShipmoPC Version 3 User Manual. Revision 10, BMT Fleet Technology Limited, Canada, pp. 107.
Faltinsen, O. M., Minsaas, K. J., Liapis, N. and Skjordal, S. O., (1980). Prediction of resistance and propulsion of a ship in seaway. 13th Symposium on Naval Hydrodynamics, Tokyo, 505-529.
Gerritsma, J. ve Beukelman, W., (1966). Comparison of calculated and measured heaving and pitching motions of a Series 60 ship model in regular longitudinal waves. Laboratorium voor Scheepsbouwkunde, Technische Hogeschool Delft, Report No 139.
McTaggart, K. A., (1997). Shipmo7: An Updated Strip Theory Program for Predicting Ship Motions and Sea Loads in Waves. Defence Research Establishment Atlantic, Technical Memorandum 96/243.
Salvesen N., Tuck E. O. and Faltinsen O., (1970). Ship motions and sea loads. Transactions of SNAME 78, 250-287.