Strategic investments for existing power plants
G. Varympopiotis1*, A. Tolis1, A. Rentizelas1, I. Tatsiopoulos1 and K. Aravossis1
1
Industrial Engineering Laboratory, Sector of Industrial Management & Operational Research, School of Mechanical Engineering, National Technical University of Athens, 15780, Athens, Greece
*Corresponding author: E-mail: grevar@central.ntua.gr, Tel +30 2107722385
Abstract
A model to investigate a fuel based optimality approach for strategic investments in the power sector is presented. The innovative concept of switching between the available operating fuel sources of the power plant over its lifetime is examined. More specifically, the case study examined, concerns an existing lignite power plant that may switch its fuel to natural gas, and from that point on it may either switch back to lignite or retain natural gas or routinely switch between the alternative fuels. This research concentrates on the electricity market of Greece, for the period of 2010-2030. Probabilistic models to forecast future prices are used in conjunction with a real options model to cope with alternative strategies. Depending on the economical and environmental standings of each period, the power plant can alter its input fuel to maximize profits or reduce emissions. Therefore, more options for the operating fuel emerge, thus reducing business risks and exploiting the most profitable operational option in response to markets instabilities (i.e. fuel price differences over time, emissions cost fluctuation, etc.). Strategic flexibility, security of supply, stability, and increased profits are the potential advantages of the presented model dealing with energy investments.
Keywords: fuel switching; strategic investment; flexibility; power sector; electricity
1. INTRODUCTION
Power sectors’ investment opportunities are under investigation due to several changes induced in electricity markets. Firstly, deregulation of power markets has created investment opportunities. Moreover, European Union Emissions Trading Scheme (EU ETS) imposes new regulations for power plants, penalizing pollutant emissions (2003/87/EK). The amounts of these emissions depend on the input fuel and the technology used for power production. Consequently, the optimum input fuel or technology for power production is under consideration. What is more, market prices related to power production are characterized by volatility. Therefore, investigation for the optimum investment decisions should combine and consider all these new data.
When referring to investment decisions it is wiser to apply optional approaches [1]. Strategic flexibility creates the opportunity to revise decisions and accordingly to adapt to changing market conditions. The economic impacts of such strategic actions can be measured through the real options model. Real options represent the possible actions of a project in response to multiple business uncertainties or changing market conditions at known costs [2]. The amount of these costs and the economic impact of these actions will determine the worth of the alternative choices [3].
plants emissions depend on the type of the fuel used [7]. Therefore, the amounts of expenditures due to the ETS are correlated with the operating fuel. As a result, alternative fuel options may increase profits, reduce losses and provide security to the investment.
2. METHODS
2.1 Case study
This research concentrates on the electricity market of Greece. The investment opportunities on an existing lignite power plant (300MW gross output) operating in Greece are examined. Three case studies are examined:
1. To retain the power plant as it is and continue power production using lignite.
2. To discard this power plant and invest to create a new NGCC power plant operating with natural gas.
3. To create a power plant with the ability to operate with lignite or natural gas.
The optional approach to use alternative fuels in case study 3 requires the discrimination of the existing subunits of the power plant into: i) subunits that could work evenly in the NGCC unit, and ii) subunits that are unique to each unit (i.e. the NGCC and Lignite unit). The subunits that show similarity (i.e. electricity grid, cooling tower, steam pipe grid, waste capture, etc.) are transformed in order to operate evenly as parts of the NGCC or the Lignite unit. The subunits that show no similarity and are necessary for the autonomous operation of the NGCC unit are planned as peripheral subunits on the power plant. They will be constructed when operation with natural gas is more profitable, without destroying the ability to re-operate with lignite. The time period for these investment decisions is assumed to be 2010-2030.
2.2 Input data
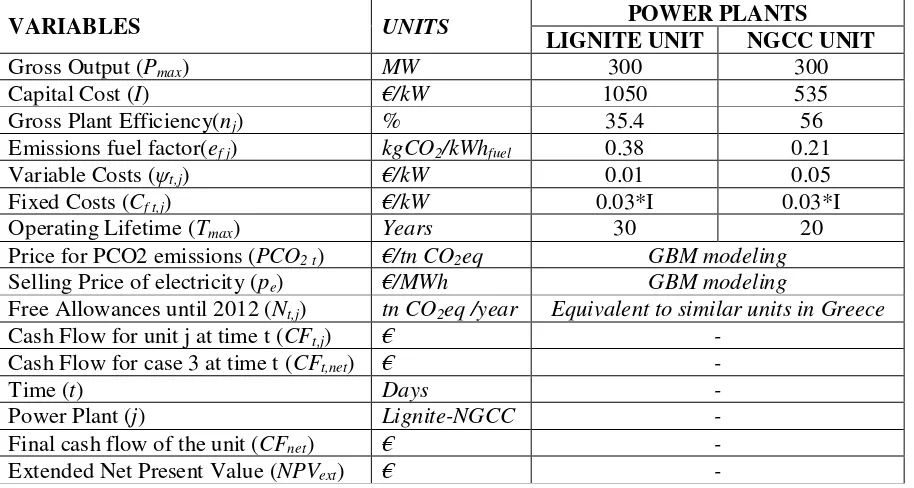
[image:2.612.80.537.456.700.2]The input data used in the model are correlated with the electricity market conditions in Greece. They are displayed in the following table 1. Moreover, it is assumed that the electricity and fuel prices are stochastically modeled using a Geometric Brownian Motion (GBM) algorithm.
Table 1. Features for the units under investigation
VARIABLES UNITS POWER PLANTS
LIGNITE UNIT NGCC UNIT
Gross Output (Pmax) MW 300 300
Capital Cost (I) €/kW 1050 535
Gross Plant Efficiency(nj) % 35.4 56
Emissions fuel factor(efj) kgCO2/kWhfuel 0.38 0.21
Variable Costs (ψt,j) €/kW 0.01 0.05
Fixed Costs (Cf t,j) €/kW 0.03*I 0.03*I
Operating Lifetime (Tmax) Years 30 20
Price for PCO2 emissions (PCO2 t) €/tn CO2eq GBM modeling
Selling Price of electricity (pe) €/MWh GBM modeling
Free Allowances until 2012 (Nt,j) tn CO2eq /year Equivalent to similar units in Greece
Cash Flow for unit j at time t (CFt,j) € -
Cash Flow for case 3 at time t (CFt,net) € -
Time (t) Days -
Power Plant (j) Lignite-NGCC -
Final cash flow of the unit (CFnet) € -
Extended Net Present Value (NPVext) € -
The symbols of the following equations are denoted and described in table 1. The daily cash flow for each unit is calculated by:
,
2 2 ,
, max , ,
1
( t j j ) (1)
t t t t j
t
f f
t j e co t j t j co f
j j
t
p e
CF P p p dt N p C
n n ψ
−
=
∫
− − − + −
The daily cash flow for case study 3 is calculated by:
, max( , , , , 0) (2)
t net t Lignite t NGCC
CF = CF CF
The cash flow for the whole lifetime of the investments is:
max
, 1
(3)
T
net t j
t
CF CF
=
=
∑
The final decision making will be drawn by the calculation of:
(4)
ext net
NPV
=
CF
−
O
, where O = 0 for the 1st case, O = Capital Cost of the NGCC Power plant in the 2nd case and O =
the extra costs for the transformation of the subunits that will work evenly and the extra costs for the construction of additional peripheral subunits in the 3rd case.
3. RESULTS AND DISCUSSION
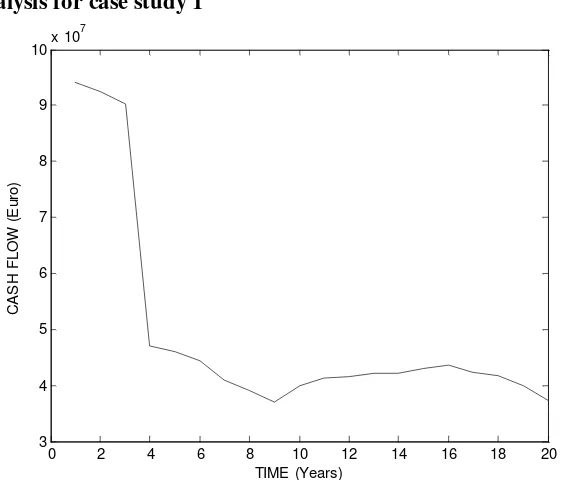
[image:3.612.164.445.440.680.2]3.1Economic analysis for case study 1
Figure 1. Annual cash flow in present values for case study 1.
The operation with lignite without any changes on the power plant is profitable. Every year the power plant presents only positive economic balance. Nevertheless, it is obvious that the profits are
0 2 4 6 8 10 12 14 16 18 20
3 4 5 6 7 8 9 10x 10
7
TIME (Years)
C
A
S
H
F
L
O
W
(
E
u
ro
remarkably reduced after 2012 (year 3 in figure 1). This is a result of the emissions penalties foreseen by the ETS Scheme.
[image:4.612.166.433.102.331.2]3.2Economic analysis for case study 2
Figure 2. Annual cash flow in present values for case study 2.
The operation of the NGCC power plant is profitable over its lifetime (case study 2). The annual profits are higher than in case study 1 (except from the first years). Moreover, the emissions penalties do not affect the profits of the NGCC unit as much as the Lignite power plant. This results from the low emission factor of natural gas. Furthermore, strong and continuous fluctuations in the profits are noticed, resulting by steep variations of natural gas selling prices.
3.3Economic analysis for case study 3
Figure 3. Annual cash flow in present values for case study 3.
The combined fuel power plant (case study 3) presents well balanced profits, except from the third year of its operation. In this year the extra costs for the construction of the additional peripheral
0 2 4 6 8 10 12 14 16 18 20 4.5
5 5.5 6 6.5 7 7.5x 10
7
TIME (Years)
C
A
S
H
F
L
O
W
(
E
u
ro
)
0 2 4 6 8 10 12 14 16 18 20 -4
-2 0 2 4 6 8 10x 10
7
TIME (Years)
C
A
S
H
F
L
O
W
(
E
u
ro
[image:4.612.168.441.455.680.2]subunits of the NGCC unit are invested. Therefore, the annual cash flow for this year is negative. Overall, the profits seem to be higher in this case study than in case studies 1 and 2.
Figure 4. Cash flow with current daily values for case study 3. It is noted that the switching cost is not depicted for readability.
The power plant operates using lignite during the first three years. In this period the profits from the operation of the lignite unit are -in daily basis- higher than those of the NGCC. In the end of the third year the operation with natural gas turns out to be more profitable. Though, the extra costs are invested in order to alter the operating fuel. From this point forward, the power plant is operational using either lignite or natural gas. Nevertheless, until the end of its lifetime, it is more profitable to operate with natural gas. The precipitous lines noticed in figure 4 represent the periods for maintenance activities, when the operation stops.
3.4Comparative evaluation – Final NPVext values
Figure 5. Comparison between the profits of case study 1, 2 and 3, by their final NPVext values. 0 1000 2000 3000 4000 5000 6000 7000 8000
-2 0 2 4 6 8 10x 10
5
TIME (Days)
C
A
S
H
F
L
O
W
(
E
u
ro
)
Lignite Unit Old NGCC
Power Plant Cash Flow
0 200000000 400000000 600000000 800000000 1E+09 1,2E+09 1,4E+09 1,6E+09 1,8E+09
E
U
R
O
S
(
€
)
NPV
ext
[image:5.612.152.474.527.710.2]All of the three case studies present profitable balances in the 20 year period. The replacement of the existing lignite unit with an NGCC unit is by almost 1.7x10^8€ more profitable. Nevertheless, the most profitable option is case study 3. It is by almost 7x10^8 € more profitable than sole lignite fired operation (case study 1) and by almost 5x10^8 € than NGCC operation (case study 2) in present values. The reason of this difference is the high amounts of emissions penalties and the fluctuation of natural gas selling price, respectively. Even if lignite is cheaper, its use is very expensive due to its pollutant emissions and the consequent emissions penalties. The alternative fuel operation proposed in case study 3 is able to bypass these unprofitable fluctuations. Therefore, it overcomes these disadvantages by using the most profitable fuel in each period.
4. CONCLUSION
The optimal investment decision concerning an existing lignite power plant is to convert it and expand it so it will be operational using also natural gas as an alternative fuel (case study 3).The anticipated profits are comparatively higher, in the period 2010-2030. This method takes into advantage the most profitable fuel, eliminating as far as possible fluctuations on fuel and emissions trade prices. Moreover, the power plant is enhanced with security. This security concerns both power production and economic viability of the power plant. Strategic flexibility to alter the operating fuel gives the ability to react to unpredictable changes of the power market conditions.
References
1. Trigeorgis L., 1996. Real Options: Managerial Flexibility and Strategy in Resource Allocation.
The MIT Press, Boston.
2. Smit H.T.J. and Trigeorgis L., 2004. Strategic Investment: Real options and Games, Princeton University Press, New Jersey.
3. Dixit A.K. and Pindyck R.S., 1994. Investment under Uncertainty. Princeton University Press, New Jersey.
4. Laurikka H. and Koljonen T., 2006. Emissions trading and investment decisions in the power sector-a case study in Finland. Energy Policy, Volume 34, Issue (, June 2006, Pages 1963-1074.
5. Rubin E., Chen C. and Rao A, 2007. Cost and performance of fossil fuel power plants with CO2 capture and storage. Energy Policy, Volume 35, Issue 9, Pages 4444-4454.
6. EDUCOGEN, 2001. The European educational tool on cogeneration, Second Edition.