City, University of London Institutional Repository
Citation
:
Doan, H., Slabaugh, G. G., Unal, G. B. and Fang, T. (2006). Semi-Automatic
3-D Segmentation of Anatomical Structures of Brain MRI Volumes using Graph Cuts. In: 2006
IEEE International Conference on Image Processing. (pp. 1913-1916). IEEE. ISBN
1424404800
This is the accepted version of the paper.
This version of the publication may differ from the final published
version.
Permanent repository link:
http://openaccess.city.ac.uk/6145/
Link to published version
:
http://dx.doi.org/10.1109/ICIP.2006.313142
Copyright and reuse:
City Research Online aims to make research
outputs of City, University of London available to a wider audience.
Copyright and Moral Rights remain with the author(s) and/or copyright
holders. URLs from City Research Online may be freely distributed and
linked to.
City Research Online:
http://openaccess.city.ac.uk/
[email protected]
SEMI-AUTOMATIC 3-D SEGMENTATION OF ANATOMICAL STRUCTURES OF BRAIN
MRI VOLUMES USING GRAPH CUTS
Huy-Nam Doan
School of Electrical and Computer Engineering
Georgia Institute of Technology
Atlanta, GA 30332
Greg Slabaugh, Gozde Unal, Tong Fang
Intelligent Vision and Reasoning Department
Siemens Corporate Research
Princeton, NJ 08540
ABSTRACT
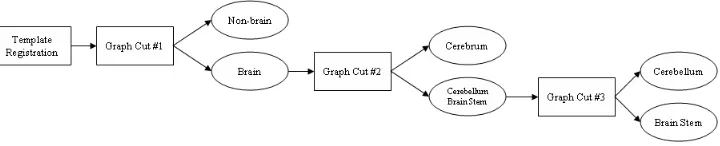
We present a semi-automatic segmentation technique of the anatomical structures of the brain: cerebrum, cerebellum, and brain stem. The method uses graph cuts segmentation with an anatomic template for initialization. First, a skull stripping procedure is applied to remove non-brain tissues. Then, the segmentation is done hierarchically by first, extracting first the cerebrum from the brain, and then from the remaining volume the cerebellum and the brain stem are separated. This method is fast and can separate different anatomical structures of the brain in spite of weak boundaries. We describe our approach and present experimental results demonstrating its usefulness.
Index Terms— Biomedical image processing, Image seg-mentation, Magnetic resonance
1. INTRODUCTION
The quantitative analysis of anatomical structures in MRI brain volumes is becoming a cornerstone in the study and detection of cerebral disease. In particular, volumetric quantification of cerebral and cerebellar tissues is essential in image-based assessment of neuroanatomical disorders such as autism and Asperger’s syndrome. The major difficulties of such stud-ies are to overcome lack of boundarstud-ies, poor contrast, and noise, due primarily to the acquisition system and the par-tial volume effect. Therefore algorithms such as active con-tours [5, 4, 9] or region growing are subject to “leakage”, i.e., propagation beyond the true anatomical borders. Since a manual delineation of the anatomical structures would be too time consuming, several segmentation techniques have been developed to increase robustness: Active contours with shape model prior knowledge [7], atlas registration [8], and interac-tive graph cuts segmentation [1].
In the first case, a prior shape is incorporated into the ac-tive contour evolution in order to further constrain the seg-mentation. Shape priors can be modeled by a known class of shapes or through statistical training. So the choice of the models for the training determines the accuracy of the seg-mentation. The second method uses a combination of rigid
and non-rigid transformation of an atlas to detect the internal structures in MR images of the brain. Although quite success-ful, this method requires high computational cost and a good atlas.
Finally, interactive graph cuts represents the volume as a discrete graph, composed of vertices representing the image voxels, as well as edges connecting the vertices, typically us-ing a6or26neighborhood. The user marks certain voxels as object or background, defining the terminals of the graph, and the optimal segmentation is found using a max-flow / min-cut algorithm. The quality of the object extraction depends on the number of seeds used in the initialization. Indeed, in [1], the segmentation is refined by additional seeds, which the user adds. In this paper, we extend this method to fit into our spe-cific problem, i.e., the segmentation of brain structures.
1.1. Our contribution
Despite their advantages, graph cuts segmentations can lead to erroneous results. In order to obtain a satisfactory segmen-tation, many seeds must be used to give a strong spatial con-straint. In this paper, we propose a solution to avoid this time-consuming step. We use a template that gives, after a simple registration, a rough localization of the different structures (i.e. cerebrum, cerebellum, and brain stem). The registra-tion steps only consist of a centroid alignment and a scaling of the template. The 3D template is shown in Figure 2(b), and once aligned, gives hard spatial constraints on the seg-mentation. One other way to give a good initialization is to start from an atlas. A similar approach would be to register a highly accurate and detailed atlas to the current volume, and then apply a strong erosion to ensure the seeds will be entirely inside each respective brain structures. Instead, we choose to use a simpler template to demonstrate the robustness of our method. Indeed, the initialization does not need to be very accurate to give a precise segmentation.
2. SEGMENTATION APPROACH
We begin by briefly reviewing the graph theory that is used to minimize our energy function. We then describe how we build this function using the image data. We then list each step of our algorithm.
2.1. Graph cut theory
Following [2], consider an undirected graphG=hV, Eithat is composed of verticesV and undirected edgesE that con-nect the vertices. Each edgee∈Eis assigned a non-negative cost. There are two special vertices (also called terminals) in the graph that are identified as the sourcesand the sink t. With the exception of the terminals, the vertices are com-prised of voxelsPin the image. An example, displayed in 2D for simplicity, is shown in Figure 1. A cutCon the graph is a partition ofV into two disjoint setsSandT =V −Ssuch thats∈ Sandt ∈ T, as shown in Figure 1(b). The cost of the cut is the sum of the costs of all edges that are severed by the cut. The minimum cut problem is to find the cut with the smallest cost energy:
Cost(C) = X
ei,j∈C
wi,j i, j∈V (1)
whereei,j represents the edge connecting the verticesiand
jandwi,j denotes the weight associated with the respective
edge. There are numerous algorithms that solve this problem in polynomial time, see [2] for more details.
(a) (b)
Fig. 1. A simple 2D graph for a 3x3 image (a) and its minimal cut (b). Figure based on [1].
2.2. Graph Cuts Image Segmentation
In the case of volume segmentation, the vertices will be the voxelsPand two other nodes denoting the “object”O termi-nals and the “background”B terminals. Our goal then is to take a set of voxelsPand compute a labeling that minimizes the cost of the cut. The idea behind the graph cut segmen-tation is to minimize an energy function defined on a graph, according to the cut of minimum weight. As presented in [1], the energy function can be written as:
E=X
p∈P
Dp(fp) +
X
q∈N(p)
Vp,q(fp, fq)
, (2)
whereE is the energy,pandqare voxels, N is the neigh-borhood formed from the vertex connectivity. Dp measures
the cost of assigning the voxelpto the setfp, whileVp,q
mea-sures the cost of assigning the adjacent voxelsp, qto the same set. As proved in [1], the segmentation defined by the min-imum cost cut in Equation 1 also minimizes Equation 2. In our implementation,
Dp(fp) =
M AX p∈O,fp=S
M AX p∈B,fp=T
0 otherwise
whereM AXis a large positive constant, and
Vp,q=
(
exp−(Ip−Iq)2
2σ2
/dist(p, q) p, q∈N
0 otherwise
wheredist(p, q)is the Euclidean distance between voxelsp andq. The parameterσis a constant that denotes the vari-ance of the voxel value inside the object. In our experiments, we empirically find a fixedσfor each of the three different graph cuts (skull-stripping, cerebrum extraction, cerebellum and brain stem segmentation), and apply the sameσs for all data sets.
2.3. Implementation
First, we register the template to the current volume by align-ing its centroid to the centroid of the volume we want to seg-ment. We also scale the template by determining the size of the brain bounding box of the current volume. After the seed-ing steps, we start a three-phase segmentation process. In the first phase, we apply a skull stripping procedure, which iso-lates the brain from extracranial tissues to facilitate the sub-sequent segmentation. To achieve this, the user first brushes non-brain tissue as shown in Figure 2(a) as sink seeds, and source seeds are specified for all voxels in the template, shown in (b). Then we compute the graph over the volume data and its optimal cut.
(a) (b)
[image:3.612.102.252.430.522.2] [image:3.612.338.523.548.654.2]Fig. 3. Different steps of the MRI brain segmentation.
In the second step, we extract the cerebrum from the brain by using the cerebrum seeds as the source of the graph cuts and the cerebellum and brain stem seeds as the sink. Once the cerebrum removed from the previous graph, we apply another graph cuts with only the brain stem terminals as the source and the cerebellum terminals as the sink to segment those two structures. The process is described in the Figure 3.
The complete algorithm then consists of the following steps:
1. Register the template to the MRI brain volume.
2. Brush non-brain tissue seeds, background included.
3. Apply a first graph cuts segmentation for the skull strip-ping, with all the template seeds as the source and the non-brain tissue seeds as the sink.
4. From the brain, run another graph cuts to extract the cerebrum. The cerebellum and brain stem seeds of the template are the sink of the graph cuts.
5. After extracting the cerebrum from the brain, apply an-other binary graph cuts to separate the cerebellum from the brain stem.
3. EXPERIMENTAL RESULTS
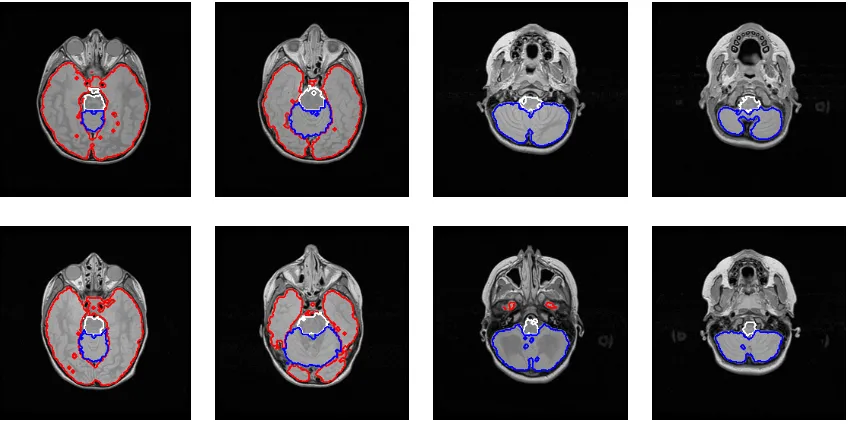
We apply our algorithm on T2 MRI axial volumes of brain with 256 * 256 slices. Two volumes are displayed in Figure 4. The whole segmentation (skull stripping included) completes in less than 50 sec on a Pentium 4 2.66 GHz processor. The seeds given by the template give a good prior information on the segmentation. In particular, it prevents any leaking even if the boundaries between the structures are not clear, as shown in Figure 5. In this slice, due to partial volume effect, the bor-der between the cerebellum and the cerebrum is unclear, as shown in (a). Many active contour techniques will not pro-duce accurate results at the region denoted with the white ar-rows.
This algorithm has been tested on six brain T2 datasets. All datasets have been successfully segmented. With the pro-posed initialization, the graph cut segmentation is able to re-trieve the contour of the cerebellum, even when the bound-ary is unclear, as shown in Figure 5(b). We plan to per-form more extensive testing on more data when it becomes
available to fully validate the algorithm. However, our ini-tial results demonstrate that the proposed method shows much promise.
4. CONCLUSION
This paper presented a method based on graph cuts to seg-ment the cerebrum, the cerebellum, and the brain stem in a brain volume. We described our approach and experimentally demonstrated its usefulness.
In our experiments, we consider only a Gaussian function as a neighboring weight, with a unique constant parameter σfor all the testing volume data. Any further work would include a computation of a specific sigma for each volume, depending on the voxels’ intensity distribution in order to im-prove the segmentation.
5. ACKNOWLEDGEMENTS
We thank Marie-Pierre Jolly for her helpful discussion re-garding graph cuts algorithm and Dennis Carmody of Robert Wood Johnson Hospital for the MRI brain datasets. We also thank Vladimir Kolmogorov for graph cuts software.
6. REFERENCES
[1] Boykov, Y. and Jolly, M.P., “Interactive Graph Cuts for Optimal Boundary and Region Segmentation of Objects in N-D Images,” Proc. Intl. Conf. on Comp. Vision, Vol. I, pp. 105-112, 2001.
[2] Boykov, Y. and Kolmogorov, V., “An Experimental Com-parison of Min-Cut/Max-Flow Algorithms for Energy Minimization in Vision,” in IEEE Trans. on Patt. Anal. and Machine Intel. (PAMI), vol. 26, no. 9, pp. 1124-1137, Sept. 2004.
[3] Cootes, T., Beeston, C., Edwards, G., and Taylor, C., “Unified Framework for Atlas Matching Using Active Appearance Models,” in the Intl. Conf. on Information Processing in Medical Imaging, pp. 322-333, 1999.
[image:4.612.129.489.72.145.2]Fig. 4. Segmentation of two MRI brain volumes in different slices. The red, blue and green contour represent respectively the cerebrum, the cerebellum and the brain stem.
(a) (b)
Fig. 5. MRI Brain segmentation. The contour of the cerebellum is not clearly defined (a) but our algorithm is able to retrieve it (b).
[5] Kass, M. Witkin, A. and Terzopoulos, D. , “Snakes: Ac-tive Contour Models,” Int. J. Computer Vision, Vol. 1, No. 4, pp. 321–331, 1987. l. and Machine Intel. (PAMI), 21(5), pp. 476-480, May 1999.
[6] Leventon, M., Grimson, E., Faugeras, O., “Statistical Shape Influence in Geodesic Active Contours, in Proc. CVPR, Vol. 1, pp. 316-323, 2000.
[7] Tsai, A., Yezzi, A., Wells, W., Tempany, C., Tucker, D., Fan, A., Grimson, E., Willsky, A., “A Shape-Based Ap-proach to Curve Evolution for Segmentation of Medical Imagery,” IEEE Trans. on Med. Img. Vol. 22, No. 2, 137– 154, February 2003.
[8] B. M. Dawant, S.L. Hartmann, J.-P. Thirion, F. Maes, D. Vandermeulen, and P. Demaerel, “Automatic 3D Seg-mentation of internal structures of the head in MR images
using a combination of similarity and free form transfor-mations: Part I, methodology and validation on normal subjects, ” IEEE Trans. on Med. Imag. Vol. 18, No. 10, 909–916, October 1999.
[9] E. D. Angelini, T. Song, B. D. Mensh, and A. Laine, “Segmentation and quantitative evaluation of brain MRI data with a multi-phase three-dimensional implicit de-formable mode,” SPIE International Symposium, Medi-cal Imaging 2004, San Diego, CA USA, 2004.
[image:5.612.96.522.71.285.2] [image:5.612.203.414.336.450.2]![Fig. 1. A simple 2D graph for a 3x3 image (a) and its minimalcut (b). Figure based on [1].](https://thumb-us.123doks.com/thumbv2/123dok_us/1645028.118002/3.612.338.523.548.654/fig-simple-d-graph-image-minimalcut-figure-based.webp)