Study on the mixing performance of static mixers in SCR application
Xinna Tian1,2, Youhong Xiao1, Peilin Zhou2, Wenping Zhang1 ,Zhenhao Chu1, Wei Zheng1
1. College of Power and Energy Engineering, Harbin Engineering University, Heilongjiang, China 2. Department of Naval Architecture, Ocean and Marine Engineering, University of Strathclyde, Scotland, UK
Corresponding author: Youhong Xiao Tel: +86 0451 82519199 Email: [email protected]
SYNOPSIS
Selective catalytic reduction (SCR) system is a promising technique for reducing nitrogen oxides (NOx) emissions from diesel engines. Static mixers are widely used in SCR systems before reactors to promote the mixing between ammonia and exhaust streams. This work aims to investigate the effects of the location of static mixers and the volume ratio of two species on mixing quality by CFD method. Simulation results show that more homogenous ammonia distribution can be achieved at the exit of the pipe if static mixers are placed close to the ammonia injection point or more ammonia is injected. Another phenomenon found in the study is that the mixing performance of an identical static mixer may behave discrepantly under different flow conditions if using
B
andC
as the evaluating indexes for mixing homogenisation.AUTHORS’ BIOGRAPHIES
Xinna Tian gained a BEng degree in Thermal Energy and Power Engineering from Harbin Engineering University in 2009. Now she is a PhD student in Marine Engineering at Harbin Engineering University. Her research interests are focused on removing NOx emissions from diesel engines by SCR technique, including SCR system design, control and optimisation. She is also pursuing a PhD degree at University of Strathclyde.
Youhong Xiao is a vice professor and master supervisor at Harbin Engineering University. He graduated from the department of Naval Architecture, Ocean and Marine Engineering of University of Strathclyde with a PhD degree. His research interests include control of vibration and noise of power equipment, noise source identification and NOx emission control of marine diesel engine.
Wenping Zhang graduated from Harbin Shipbuilding Engineering Institute with a BEng in the Department of Power Engineering in 1984, followed by an MSc and a PhD in 1984 and 1990 respectively. He has more than 25 years’ experience in the control of noise, vibrations and exhaust gas emissions of power equipment.
and Marine Engineering at University of Strathclyde. He obtained his BEng, MSc at Dalian Maritime University and a PhD at Newcastle University. His research interests include diesel engine combustion and efficiency enhancement, exhaust gas emissions control, alternative fuels and ship ballast water treatment.
INTRODUCTION
Selective catalytic reduction (SCR) is an effective technology to reduce nitrogen oxides (NOx) emissions from diesel engine.1 The principle of this technology is the reduction of NOx in engines’
exhaust by ammonia (NH3) with the presence of catalysts above a temperature of 250 ˚C.
Theoretically the reduction leads to innocuous nitrogen (N2) and water (H2O). However, the
unreacted ammonia (ammonia slip) emitted to the atmosphere is also a noticeable problem as referred to in Björn’s paper.2 The volume ratio of ammonia to exhaust gas is usually much less
than 1/100 in SCR application. It is difficult to mix these two species homogenously in such a small ratio under a limitation of mixing distance. The coefficient of variation (CoV) of ammonia before catalysts has a significant influence on SCR conversion efficiency and ammonia slip. By improving the homogenisation of ammonia distribution, SCR conversion efficiency can be advanced and ammonia slip can be reduced. Therefore, static mixers are commonly used before SCR reactors to enhance the mixing between ammonia and exhaust streams.
SCR manufacturers such as Haldor Topsøe, Tenneco, Bosch, MAN B&W, Wärtsilä, Mitsui, Hitachi, Daewoo and MTU have equipped static mixers on their SCR systems. These static mixers are either designed by SCR manufacturers themselves or introduced directly from the manufacturers of static mixers, such as Sulzer, Koch-Glitsch, Cheminner, Toray, FBE, Balcke Durr and ENVIRGY. The studies of static mixers are mainly concentrated on revealing mixing mechanisms, optimising the structures of static mixers and evaluating the performance of static mixers. Numerical simulations supported by experiments are effective ways to investigate the characteristics of static mixers. The characteristics concerned of static mixers may vary with the occasion of application. However the characteristics mostly considered are the heat transfer ability, pressure loss, flow uniformity and mixing homogenisation.
The mixing performance of an identical static mixer may behave dissimilarly under different flow conditions. This study introduces the indexes used for evaluating the mixing ability of static mixers and the factors which may affect the performance of static mixers. A commonly used GK static mixer unit is simulated by CFD software ANSYS Fluent in current research to investigate the effect of the location of static mixers and the volume ratio of two species on mixing quality.
SIMULATION MODELING
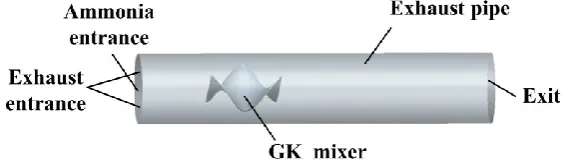
placed at various locations along the pipe. The length of GK static mixer unit is designed equal to the diameter of the pipe for the purpose of easy calculation. Under full load of the engine, the mass flow rate of the exhaust is 3.43kg/s with the exhaust temperature of 623K. Ammonia is introduced to the exhaust pipe from the centre of the inlet of the pipe. The boundary conditions for the inlet and outlet of the exhaust pipe are set for mass flow inlet and pressure outlet respectively. The turbulent flow is described by a k-ε model. A GK static mixer unit is placed at locations between 0.4m to 1.5m away from the ammonia injection point. The volume ratio of ammonia to exhaust varies at c=0.1, c=0.01 and c=0.001, respectively. Fig 1 is an illustration of the simulation model.
Fig 1: simulation model including exhaust pipe and a GK static mixer unit
EVALUATION OF MIXING QUALITY
A standard deviation is commonly used to evaluate the mixing degree of ammonia with exhaust gas at a section. Here, the standard deviation is called coefficient of variation (CoV) which is defined in equation (1). CoV also can be used to evaluate velocity and temperature distributions of a flow. A large value of CoV means an uneven distribution of ammonia.3 The mixing process
can be assumed to be homogenous when the value of CoV is less than 5%.4
n
2 j j=1
( )
1
CoV
n
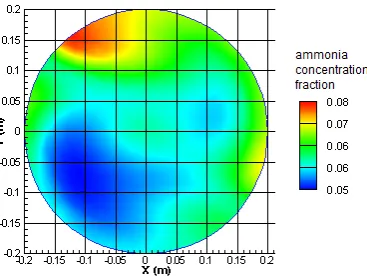
(1)Fig 2: Distributions of ammonia concentration fraction and sampling points at a cross-section of the exhaust pipe
The CoV after static mixers is usually associated with that before static mixers, which is expressed in equation (2). 5
_ _
exp(
)
mixer mixer out mixer in
L
CoV
CoV
B
D
(2)
Where,
L
mixer is the length of static mixers andD
is the diameter of exhaust pipe.B
denotes the decreasing extent of CoV due to static mixers. In this case,
L
mixer1
D
, thusB
iscalculated as shown in equation (3):
_ _
ln
mixer inmixer out
CoV
B
CoV
(3)
B
is a coefficient which relates to the structure of static mixers and represents the mixing capacity of static mixers. It can be used as an index to evaluate the mixing capability of different static mixers.Similarly,
C
also can be used as an index to evaluate the remaining mixing capability of the flow in the area after static mixers. This is because that mixing process may not only happen inside static mixers but also continue after static mixers. In that case, a length of one diameter of thepipe is used to calculate the remaining mixing capability of the flow after static mixers.
C
is calculated based on the following equation:_ _ 1
ln
mixer out mixer out DCoV
C
CoV
(4)
Fig 3: Illustration of CoV at each position
[image:5.595.167.413.520.717.2]RESULTS AND DISCUSSION
Fig 4 and Fig 5 show the tendencies of the CoV of ammonia concentration at the exit of the pipe and at the entrance of the mixer changing with the location of GK mixer unit and the volume ratio of ammonia to exhaust respectively. The results suggest that both the values of the CoV of ammonia concentration at the exit of the pipe and at the entrance of the mixer change noticeably with the positions of GK mixer unit and the amount of ammonia injected. Fig 4 presents that small values of CoV are obtained at the exit of the pipe when GK mixer unit is placed close to the ammonia injection point. This suggests that static mixers placed upstream of an uneven flow can benefit the mixing since it can make full use of mixers. The value of the CoV at the entrance of the mixer indicates the mixing extent of ammonia and exhaust streams under a natural flow condition. It can be seen in Fig 5 that small values of CoV are obtained at the entrance of the mixer if there is a long distance for natural mixing. Both Fig 4 and Fig 5 show that the values of CoV decrease with the increase of volume ratio of ammonia to exhaust, implying that the mixing of ammonia and exhaust streams becomes easier if more ammonia is injected.
Fig 5: CoV of ammonia concentration at the entrance of the mixer changing with the location of GK mixer unit and the volume ratio of ammonia to exhaust
Accordingly, Fig 6 and Fig 7 suggest that the calculated
B
andC
for an identical GK mixer unit also change with these two factors. BothB
andC
decrease with the increases of volume ratio of ammonia to exhaust and the distance between ammonia injection point and GK mixer unit. The explanation of the result may be that bothB
andC
change with the value of CoV at the entrance of the mixer. In other words, the mixing performance of an identical static mixer may behave discrepantly under different flow conditions if usingB
andC
as the evaluating indexes for mixing homogenisation. [image:6.595.167.412.489.693.2]Fig 7:
C
changing with the location of GK mixer unit and the volume ratio of ammonia to exhaustIt can be inferred from Fig 5 to 7 that large values of
B
andC
can be obtained if a large value of CoV exists at the entrance of static mixers. That is to say, static mixers may exhibit much better mixing performance under an extremely uneven flow if adoptingB
andC
as the indexes to evaluate the mixing capacity of static mixers. This is reasonable that static mixers are useless if they are equipped under an extremely homogenous flow. The values ofB
andC
calculated of static mixers thus equal zero since there is no advance of mixing homogenisation of the flow after static mixers.CONCLUSIONS
This paper presents the indexes for evaluating the mixing capacity of static mixers. The effects of the location of static mixers and the volume ratio of two species on mixing quality have been investigated. The results show that more homogenisation of ammonia distribution can be achieved at the exit of the pipe if static mixers are placed close to the ammonia injection point or more ammonia is injected. Both
B
andC
change with the value of the CoV of ammonia concentration at the entrance of static mixers. This implies that the mixing performance of an identical static mixer may behave discrepantly under different flow conditions if usingB
andACKNOWLEDGEMENTS
This study was supported by Postdoctoral Scientific Research Developmental Fund of Heilongjiang Province (grant no. LBH-Q14038) and National Natural Science Foundation of China (grant no. 51109049)
NOMENCLATURE
c volume concentration fraction of ammonia
j
ammonia concentration at each sampling point
average value of ammonia concentration n number of sampling points
CoV coefficient of variation
mixer
L
length of static mixersD
diameter of exhaust pipeB
index for evaluating the mixing capacity of static mixersC
index for evaluating the mixing capacity of static mixersREFERENCES
1. Koebel M, Elsener M, Kleemann M. 2000. Urea-SCR: a promising technique to reduce NOx emissions from automotive diesel engines. Catalysis Today. 59(3-4):335-345
2. Björn T, Wouter O, Albert VDB. 2005. Ammonia sensors and their applications—a review. Sensors and Actuators B: Chemical. 107(2): 666–677
3. Grosz-Röll F. 1980. Assessing homogeneity in motionless mixers. Int. Chem. Eng. 20(4): 542-549
4. Kukukova A, Aubin, J, Kresta, SM, 2009. A new definition of mixing and segregation: Three dimensions of a key process variable. Chemical Engineering Research and Design. 87(4): 633-647
5. Thakur RK, Vial Ch, Nigam KDP, Nauman EB, Djelveh G. 2003. Static mixers in the process industries----a review.