RESEARCH
Uptake of a fluorescently tagged
chloroquine analogue is reduced in CQ-resistant
compared to CQ-sensitive
Plasmodium
falciparum
parasites
Sarah J. Reiling and Petra Rohrbach
*Abstract
Background: Chloroquine (CQ) was the drug of choice for decades in the treatment of falciparum malaria until resistance emerged. CQ is suggested to accumulate in the parasite’s digestive vacuole (DV), where it unfolds its anti-malarial properties. Discrepancies of CQ accumulation in CQ-sensitive (CQS) and CQ-resistant (CQR) strains are thought to play a significant role in drug susceptibility. Analysis of CQ transport and intracellular localization using a fluorescently tagged CQ analogue could provide much needed information to distinguish susceptible from resistant parasite strains. The fluorescently tagged CQ analogue LynxTag-CQ™GREEN (CQGREEN) is commercially available and was assessed for its suitability.
Methods: IC50 values were determined for both CQ and CQGREEN in two CQS and two CQR Plasmodium falciparum
strains. Buffer solutions with varying pH were used to determine pH-dependent localization of CQGREEN in infected red blood cells. Before CQS or CQR parasites were exposed to different pH buffers, they were pre-loaded with varying concentrations of CQGREEN for up to 7 h. Intracellular accumulation was analysed using live cell confocal microscopy. CQGREEN uptake rates were determined for the cytosol and DV in the presence and absence of verapamil.
Results: In CQS strains, twofold higher IC50 values were determined for the CQGREEN analogue compared to CQ. No significant differences in IC50 values were observed in CQR strains. Addition of verapamil reversed drug resistance of CQR strains to both CQ and CQGREEN. Live cell imaging revealed that CQGREEN fluorescence was mainly seen in the cytosol of most parasites, independent of the concentration used. Incubation periods of up to 7 h did not influence intracellular localization of CQGREEN. Nevertheless, CQGREEN uptake rates in CQR strains were reduced by 50% compared to CQS strains.
Conclusion: Although fluorescence of CQGREEN was mainly seen in the cytosol of parasites, IC50 assays showed com-parable efficacy of CQGREEN and CQ in parasite killing of CQS and CQR strains. Reduced uptake rates of CQGREEN in CQR strains compared to CQS strains indicate parasite-specific responses to CQGREEN exposure. The data contains valuable information when CQGREEN is used as an analogue for CQ.
Keywords: LynxTag-CQGREEN, Live cell imaging, Malaria, Antimalarial drugs, Chloroquine resistant, Chloroquine sensitive
© The Author(s) 2019. This article is distributed under the terms of the Creative Commons Attribution 4.0 International License (http://creat iveco mmons .org/licen ses/by/4.0/), which permits unrestricted use, distribution, and reproduction in any medium, provided you give appropriate credit to the original author(s) and the source, provide a link to the Creative Commons license, and indicate if changes were made. The Creative Commons Public Domain Dedication waiver (http://creativecommons.org/ publicdomain/zero/1.0/) applies to the data made available in this article, unless otherwise stated.
Open Access
*Correspondence: petra.rohrbach@mcgill.ca
Background
Plasmodium falciparum is the main causative agent of malaria, killing hundreds of thousands of people annu-ally [1]. Resistance to anti-malarial drugs is widespread, and promising anti-malarial drugs that are effective and affordable for people with low income are slow in devel-opment. For decades, chloroquine (CQ) was the saf-est, most affordable and effective drug against malaria, saving the lives of millions of people until resistance emerged [2]. To date, its mode of action is still not fully understood. Some researchers suggest that CQ could have more than one intracellular target, making it more difficult for parasites to develop resistance [3–5].
To effectively use CQ as an anti-malarial treatment in areas where CQ resistance has been reported, it is imperative to gain more insight into its mechanism of action. The small size and uncharged form of CQ at neutral pH makes it difficult to use for molecular bio-logical experiments to determine its accumulation in intracellular compartments or its affinity to other molecules.
Chloroquine transport studies have mainly been performed using radiolabelled CQ [6–8]. The great advantage of this method is that the intrinsic proper-ties of CQ remain unaltered. However, it is not possi-ble to study intracellular distribution and trafficking of radiolabelled CQ in intact parasites. Therefore, fluo-rescently labelled CQ analogues provide a new means to evaluate intracellular activity of this drug. To date, there are two fluorescently labelled chloroquine ana-logues commercially available: LynxTag-CQ™
BLUE and LynxTag-CQ™
GREEN (BioLynx Technologies, Singapore, Singapore). While the literature cites that CQBLUE was mainly found to be fluorescent in the parasite cyto-sol [9–11], only one study has been published with CQGREEN. This study showed CQGREEN accumulation in the DV of CQ-sensitive (CQS) P. falciparum parasites and yeast-derived microsomes expressing the P. falcipa-rum chloroquine resistance transporter (PfCRT) [12].
For this study, CQGREEN was compared to unmodi-fied CQ and investigated whether the fluorescently tagged CQ analogue can be used to obtain insight into intracellular CQ trafficking and localization. A bet-ter knowledge of the differences in CQ accumulation, distribution, uptake and efflux between CQS and CQ-resistant (CQR) strains is imperative to understand drug resistance. The findings show that, although CQ and CQGREEN show comparable IC50 values in CQS and CQR parasites, discrepancies were seen between CQGREEN and unmodified CQ in their expected intra-cellular localization. A strong CQGREEN fluorescence was mainly seen in the cytosol of both CQS and CQR strains.
Methods
Parasite strains and culture conditions
Two CQS (3D7, HB3) and two CQR (FCB, Dd2) strains were used for all experiments. Parasites were cultured continuously, as described by Trager and Jensen [13], with modifications. Briefly, parasites at 5% haematocrit were propagated in culture medium containing RPMI 1640 (Life Technologies, Burlington, ON, Canada) sup-plemented with 25 mM HEPES, 2 mM l-glutamine, gentamicin (20 µg/ml) (Life Technologies, Burlington, ON, Canada), 100 µM hypoxanthine (Sigma-Aldrich, Oakville, ON, Canada), and 0.5% AlbuMAX I (Life Tech-nologies, Burlington, ON, Canada). Parasites were main-tained at 37 °C with an atmosphere of 5% CO2, 3% O2 and 92% N2. A+ red blood cells were obtained from the Inter-state Blood Bank (Memphis, TN, USA). Giemsa-stained blood smears were prepared daily to monitor parasite growth. For synchronization, parasites were treated with 5% d-sorbitol (BioShop Canada, Burlington, ON, Can-ada) for 10 min at 37 °C; sorbitol was removed and para-sites were washed once before returning them back into culture.
Cytotoxicity assays
Cytotoxicity assays were performed as described previ-ously [14–17], with modifications. Cultures of 0.5% par-asitaemia and 2% haematocrit were incubated in 100 µl culture medium per well in a 96-well plate assay. A drug dilution series of 1:3 was prepared, starting with 1 µM as highest substrate concentration. Plates were incubated at 37 °C, 5% CO2 and 3% O2 for 72 h, then frozen and stored at − 80 °C.
Readouts of the assay were performed using the SYBR Green I detection method. For this, plates were thawed at room temperature and 100 µl 2× lysis buffer (20 mM
Tris pH 7.5, 5 mM EDTA, 0.008% saponin, 0.08% Triton X-100, and 0.2 µl SYBR Green I/ml) was added to each well. Plates were incubated in the dark for at least 1 h. Fluorescence intensity was determined using a Synergy H4 plate reader (Fisher Scientific, Nepean, ON, Canada) with 485 nm excitation and 520 nm emission wave-lengths. IC50 values were determined by fitting concen-tration response curves with a custom-made procedure for IGOR Pro 6.2 based on a R script kindly provided by Le Nagard [18, 19].
Fluorescence of CQGREEN at varying pH
contained 10 mM MES for pH 5.0–6.5 or 10 mM HEPES for pH 7.0–8.0. In a 96-well plate, 100 µl buffer solutions of varying pH containing 1 µM CQGREEN were prepared in triplicate. Fluorescence intensity was measured at 37 °C using the Synergy H4 fluorimeter (Bio-Tek, Win-ooski, VT, USA). Excitation spectra ranging from 400 to 520 nm were measured with fixed emission at 540 nm, and emission spectra ranging from 500 to 630 nm were measured with fixed excitation at 488 nm. Quantification was done using Microsoft Excel 2013.
Live cell imaging
Intracellular CQGREEN accumulation at different con-centration and pH was analysed in intact parasitized red blood cells. For this, 3D7 trophozoite stage parasites were incubated for 30 min at 37 °C with 25, 50, 500 nM or 2.5 µM CQGREEN in Ringer’s solution with pH 7.4 or buffer solutions with pH 7.2 or 5.2. Images were taken using a 488 nm argon laser (12.5 mW, 0.8%) on a Zeiss LSM 710 confocal microscope (Carl Zeiss, Oberkochen, Germany) equipped with a water-corrected objective (C-apochromat 63×/1.20 W Korr M27). Emission range
was set to 500–600 nm. Localization of CQGREEN within the parasite under various pH conditions was determined using the ZEN 2010 software (Carl Zeiss MicroImaging, Oberkochen, Germany).
For long-term incubation with CQGREEN, early tropho-zoite stage 3D7 parasites were incubated with 100 nM, 300 nM and 500 nM CQGREEN for 7 h in culture medium at 37 °C, 3% O2, 5% CO2. Parasites were then trans-ferred onto a microscope chamber and imaged using a Zeiss LSM 710 confocal microscope (Carl Zeiss, Oberkochen, Germany), a 63× water corrected objective
(C-apochromat 63×/1.20 W Korr M27) and a 488 nm
laser (12.5 mW, 0.8%). Emission range was set to 500– 600 nm. A constant temperature of 37 °C was maintained during the measurements using a stage-top incubator (Tokai Hit, Shizuoka-ken, Japan). Images were analysed with the ZEN 2010 software (Carl Zeiss MicroImaging, Oberkochen, Germany).
To analyse CQGREEN uptake of CQS and CQR strains, synchronized trophozoite stage parasites were washed in Ringer’s solution and transferred onto a microscope chamber. Parasites were allowed to settle for 5 min, then the solution was aspirated and replaced with new Ringer’s solution containing 500 nM CQGREEN. If vera-pamil was added, parasites were preincubated with 1 µM VP for 15 min at 37 °C, then transferred onto a microscope chamber. For the time lapse measurement, 500 nM CQGREEN were added to the Ringer’s solution with or without 1 µM VP. Images were taken every 3 s for a time span of 500 s using a Zeiss LSM 710 confo-cal microscope (Carl Zeiss, Oberkochen, Germany)
and a 63× water corrected objective (C-apochromat 63×/1.20 W Korr M27). Excitation was done using a 488 nm laser (12.5 mW, 0.8%), and an emission range from 500 to 600 nm. Regions of interest (ROI) were set for the parasite cytosol, DV, infected RBC cytosol and uninfected RBC. Fluorescence of ROIs was determined for each time point using ImageJ 1.47q (National Insti-tutes of Health, USA). Uptake rates were calculated for the cytosol and DV during the saturation phase and analysed using IGOR Pro 6.2 by fitting influx to ƒ = y0+ a(1 − e−bx) and initial rates (v0) to y = mx + b, as described previously [20]. Graphs were created using IGOR Pro 6.2.
Results
IC50 determination of CQ and CQGREEN in CQS and CQR
parasite strains
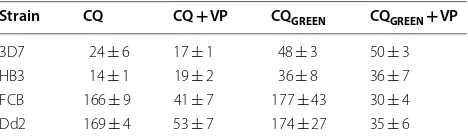
To evaluate the efficacy of the fluorescently tagged chlo-roquine analogue CQGREEN, the half maximal inhibi-tory concentrations (IC50) were determined using the SYBR Green I detection assay and a standardized cal-culation method for data analysis in two CQS and two CQR P. falciparum strains (Table 1) [19]. The two CQS strains 3D7 and HB3 had a CQ IC50 of 24 ± 6 nM and 14 ± 1 nM, respectively. Compared to exposure to
CQ, IC50 values doubled in both CQGREEN treated 3D7 (48 ± 3 nM, p = 0.02) and in HB3 parasites (36 ± 8 nM,
p = 0.06). Treatment of the CQR strains FCB and Dd2
showed similar IC50 values for all tested drugs. IC50 val-ues of 166 ± 9 nM for CQ and 177 ± 43 nM for CQGREEN were determined in FCB (p = 0.81). For Dd2, IC50 values of 169 ± 4 nM were obtained for CQ and 174 ± 27 nM
for CQGREEN (p = 0.85). Resistance in CQR strains could be reversed with the addition of 1 µM VP. For FCB, IC50 values were 41 ± 7 for CQ + VP and 30 ± 4 for CQGREEN+ VP. For Dd2, IC50 values were 53 ± 7 for CQ + VP and 35 ± 6 for CQGREEN+ VP. No significant changes were observed in CQS strains for treatment with CQ or CQGREEN in combination with verapamil.
Table 1 IC50 values of CQ and CQGREEN for P. falciparum
strains used in this study
All values are given in nM ± SEM and represent three independent experiments with or without 1 µM VP
VP verapamil
Strain CQ CQ + VP CQGREEN CQGREEN+ VP
[image:3.595.305.539.624.694.2]Fluorescence intensity of CQGREEN is dependent on pH pH is known to affect the fluorescence intensity and excitability of a molecule [21]. While some fluoro-phores have stable emission at different pH, oth-ers are more pH sensitive [22, 23]. This must be considered when comparing fluorescence intensity of a fluorochrome in intracellular compartments with significantly different pH, as is the case for the para-site’s cytosol (at approx. pH 7.1) and DV (at approx. pH 5.2) [24]. CQGREEN consists of a chloroquine ana-logue tagged with a Bodipy fluorophore, which is relatively insensitive to solvent polarity and pH [25]. To determine if this fluorescently tagged CQ is pH dependent, CQGREEN fluorescence was tested using buffer solutions containing HEPES or MES to obtain pH values ranging from 5.0 to 8.0. These buffer solu-tions were used to evaluate possible changes in fluo-rescence intensity seen in the parasite cytosol, having a physiological pH of 7.2, and the digestive vacuole, maintaining a pH of 5.2 [24]. Excitation spectra for CQGREEN showed constant fluorescence intensity at a fixed emission of 540 nm (Fig. 1a). The CQGREEN exci-tation peak was determined at 508 nm. Since live cell imaging will be performed using a 488 nm laser for excitation, CQGREEN emission spectra were measured at different pH with a fixed excitation wavelength of 488 nm. CQGREEN emission intensity peaked at 522 nm and increased 1.6-fold from 13,698 RFU at pH 7.5 to 22,419 RFU at pH 5.5 (Fig. 1b). Therefore, somewhat higher CQGREEN fluorescence is emitted in acidic com-partments compared to neutral comcom-partments at equal intracellular CQGREEN concentrations.
CQGREEN accumulates in the parasite cytosol
The weak base properties of chloroquine and its dipro-tonation at low pH result in its high accumulation in the parasite’s digestive vacuole [26]. Addition of a fluorescent group (here Bodipy) to chloroquine could alter the intra-cellular distribution of this molecule. In this study, the CQS strain 3D7 was treated with 25 nM, 50 nM, 500 nM and 2.5 µM CQGREEN in Ringer’s solution, or buffer solu-tions with pH 7.2 and pH 5.2, respectively. CQGREEN uptake and intracellular distribution was monitored in 5 min intervals for a total of 30 min at 37 °C. Increasing CQGREEN concentrations resulted in stronger fluores-cence signals, independent of the buffer solution used (Fig. 2). The fluorescence signal was always stronger in the cytosol compared to the DV. Faint accumulation of CQGREEN in the digestive vacuole was observed with all buffer solutions and CQGREEN concentrations.
Although CQ is expected to accumulate in the para-site’s DV within minutes, addition of CQGREEN was extended for up to 7 h in 3D7 parasites at 37 °C, 3% O2, 5% CO2, 92% N2. It was previously reported that incuba-tion of the chloroquine analogue CQBLUE at a 3 µM con-centration for 8 h resulted in nonspecific localization throughout the parasite’s cytosol, while accumulation of CQBLUE in the DV was detected using a concentration of 300 nM [9]. Therefore, for this study, CQGREEN concen-trations ranging from 100 to 500 nM were used. Fluores-cence signals obtained after 7 h incubation were low for all tested CQGREEN concentrations (Fig. 3). Accumula-tion of CQGREEN in the DV could be detected in very few parasites (approx. 5%) (Fig. 3b + d). Furthermore, accu-mulation of CQGREEN in the DV was only seen in one par-asite of a double-infected red blood cell (RBC) (Fig. 3b),
[image:4.595.62.539.515.688.2]suggesting that CQGREEN accumulation in the DV is not equally achieved in individual parasites. Moreover, the CQGREEN fluorescence in the DV of the parasite in Fig. 3b is only 2.8-fold higher compared to the cytosol, which is much lower than expected.
Stability of CQGREEN compound
Next, it was investigated if the Bodipy moiety of CQGREEN is cleaved and remains in the cytosol while CQ reaches the DV, where it can unfold its anti-malarial properties. It was previously demonstrated that cleavage of fluorescent molecules through proteases changes the environment of the reactive center loop, resulting in a spectral shift of the fluorescence peak [27, 28]. To evaluate if a spectral shift of the fluorescence peak occurs in CQGREEN after expo-sure to parasite proteases, uninfected or 3D7-infected cultures with a parasitaemia of 2.5%, 5% or 10% were loaded with 500 nM CQGREEN for 1 h. Parasites were then washed to remove excess CQGREEN in the supernatant
and were lysed before measuring fluorescence. Since live cells were loaded with the dye, any detected signal should be derived from CQGREEN molecules taken up by the par-asites. As a control, parasites were with free acid Bodipy-FL were analysed using the same conditions.
[image:5.595.59.541.87.424.2]Fig. 3 Long term incubation of CQGREEN treated parasites. Early trophozoite stage 3D7 parasites were incubated with 100 nM, 300 nM or 500 nM
CQGREEN for 7 h in culture medium at 37 °C, 3% O2, 5% CO2, and then transferred onto a microscope chamber. Faint fluorescence accumulation of
CQGREEN in the DV could be detected in few parasites (approx. 5%). Experiments were done in triplicate. a–c Images of parasites exposed to 100 nM
CQGREEN for 7 h. d–f Images of parasites exposed to 300 nM CQGREEN for 7 h. g–i Images of parasites exposed to 500 nM CQGREEN for 7 h. Scale bar,
5 µm
Fig. 4 CQGREEN and Bodipy-FL fluorescence. CQGREEN and free acid Bodipy-FL were measured in solution or after incubation with, and lysis of,
uninfected red blood cells and red blood cells infected with 3D7 trophozoite stage parasites (uRBCs and iRBCs, respectively). No shift of CQGREEN
[image:6.595.58.548.89.352.2] [image:6.595.56.539.409.689.2]at 518–520 nm for all CQGREEN treated uRBC and iRBC samples. Thus, either no cleavage of the Bodipy tag in CQGREEN occurred or the cleaved Bodipy moiety was not retained within the RBCs and a fluorescent signal was only obtained from uncleaved CQGREEN.
CQGREEN uptake differs in CQS and CQR strains
Most researchers focus on CQ accumulation in the DV, suggesting that enhanced CQ efflux from the DV through PfCRT confers drug resistance [29, 30]. CQ uptake in intact iRBCs has mainly been described as passive diffu-sion and subsequent accumulation in the DV due to the drug’s weak base properties [31, 32]. Molecular mecha-nisms that influence CQ uptake and, therefore, reduce the drug influx in CQR strains compared to CQS strains may have gone unrecognized. CQGREEN offers the possi-bility to measure uptake in live cells. Although CQGREEN mainly accumulates and fluoresces in the parasite’s cyto-sol, with weak fluorescence in the DV, it was still possible to measure its uptake rate in both compartments.
The rate of CQGREEN uptake was analysed in two CQS strains (3D7 and HB3) and compared with two CQR strains (Dd2 and FCB). Fluorescence was measured from the parasite cytosol, DV, iRBC cytoplasm and uRBC. No increase in CQGREEN fluorescence beyond background levels was observed in the cytoplasm of infected or uninfected RBCs (Fig. 5a). There was a rapid increase in fluorescence in the parasite cytosol and DV in the ini-tial 150 s, followed by a slower, almost linear CQGREEN uptake. This is in agreement with previous studies where they showed that CQ uptake can be separated into a short period of very rapid uptake (< 30 s) followed by a long, slower phase [33], and addition of verapamil did not influence CQ uptake during the initial phase [34].
CQGREEN uptake rate for the parasite cytosol was approx. twofold higher in CQS strains compared to CQR strains (Fig. 5b). For the DV, CQGREEN uptake rates were approx. 2.5-fold higher in CQS strains compared to CQR strains. CQGREEN uptake rates between CQS and CQR strains were statistically highly significant for both the cytosol (p < 0.0001) and DV (p < 0.0001). Increased CQGREEN uptake rates for the DV of CQS strains sug-gest that active transport of CQ into the DV occurred in addition to diffusion, which is absent in CQR strains. As expected, addition of verapamil did not influence CQGREEN uptake in the parasite cytosol or DV in all CQR strains tested.
Discussion
The exact mechanisms responsible for chloroquine resistance have eluded researchers for decades. It has long been described that CQR strains accumulate two to sevenfold less CQ than CQS strains [35]. Nevertheless,
CQR strains are still able to tolerate higher intracellular CQ concentrations than CQS strains before irreversible cell damage occurs [3, 7, 33, 36]. Researchers have advo-cated that inhibition of haemozoin formation by CQ is not sufficient to explain its effect on parasite killing [37]. Furthermore, a possible role of CQ in the parasite’s cyto-sol has also been proposed [5]. A fluorescently labelled CQ analogue could provide insight into the intracellu-lar distribution of CQ that is not attributed to diffusion alone. This study set out to examine CQ uptake in live parasites using CQGREEN.
IC50 values were compared in CQS and CQR strains after exposure to CQ or CQGREEN. A decrease in the effi-cacy for CQGREEN may suggest that the CQ analogue does not reach its site of action as efficiently as its native form or binds to its target less efficiently. Calculated IC50 val-ues in CQS strains showed that CQ was twice as effective as CQGREEN in parasite growth inhibition. In comparison, similar IC50 values for CQ and CQGREEN were determined in CQR strains. In a previous study by Loh and colleagues [12], IC50 values in 3D7 were approx. fivefold higher for CQGREEN compared to CQ, and nearly doubled in the CQR strain K1. Thus, the parasites used for this study seemed to be more sensitive to CQGREEN exposure than reported in earlier publications. In both studies, drug resistance could be reversed by chemosensitizers such as verapamil, suggesting that CQGREEN’s mode of action is similar to CQ.
Although CQGREEN seemed slightly less effective than CQ in the IC50 assays for CQS strains, its Bodipy fluores-cent tag makes it suitable for live cell imaging. This was confirmed by fluorometric readings, where a strong fluo-rescence emission signal for CQGREEN was measured at a 488 nm excitation wavelength. Spectral scans showed a strong fluorescence signal at the measured pH spectrum ranging from pH 5–8 with a moderate increase in fluo-rescence at acidic pH.
Accumulation of CQGREEN fluorescence was found in only 5% of the parasite’s DV compared to the cytosol dur-ing live cell imagdur-ing at any of the tested CQGREEN con-centrations, ranging from 25 nM to 2.5 µM. Considering that the CQGREEN IC50 was determined at 24 nM, any of the tested concentrations for live cell imaging would have been sufficient to kill the parasites. If CQ and CQGREEN had its primary target in the parasite’s DV, as suggested by several studies [38–42], then we would have expected a higher CQGREEN fluorescence in the DV.
used microsomes to resemble events occurring in the DV and reported accumulation of CQGREEN fluorescence in these microsomes [12]. They did not use intact parasites in their experiments and the data does not support their assumption that CQGREEN accumulates equally well in the DV of live parasites as it does in microsomes [12].
Fluorometric measurements were performed to verify CQGREEN fluorescence at low pH. Slightly higher fluo-rescence was observed for CQGREEN at acidic pH (5.0) compared to neutral pH (7.0). Therefore, if CQGREEN accumulated in the DV, a fluorescent signal would be expected. The absence of fluorescence in the DV suggests that CQGREEN does not reach the DV. Two reasons for
this are possible. First, cleavage of the fluorescent Bodipy moiety from CQ may already occur in the parasite cyto-sol. This would allow CQ to accumulate in the DV, while the Bodipy moiety remains in the cytosol. In this case, the fluorescence signal does not specify the subcellular localization of CQ but rather only the fluorochrome. Sec-ond, the Bodipy moiety alters the intrinsic properties of the substrate and, therefore, prevents its accumulation in the DV. A simple way to elucidate whether the Bodipy moiety gets cleaved is determining fluorescence proper-ties of conjugated versus free acid Bodipy-FL. Since there is a fluorescence shift between free acid Bodipy-FL alone (peak at 512 nm) and the Bodipy-tagged CQGREEN (peak
[image:8.595.58.540.83.482.2]at 520 nm), cleavage of the Bodipy moiety from CQGREEN during the cellular uptake would result in a fluorescence shift to 512 nm when parasites are treated with CQGREEN. For this study, intact P. falciparum-infected RBCs were treated with CQGREEN to analyse the potential cleavage of the Bodipy moiety. Although a proportional increase in fluorescence with higher parasitaemia was measured, no shift in the fluorescence peak was observed. Thus, CQGREEN remained intact and functional in live parasites prior to parasite lysis for fluorescence measurements.
Despite the unexpected localization of CQGREEN fluo-rescence mainly in the parasite cytosol and to a lesser extent in the DV, uptake rates were analysed in two CQS and two CQR strains. Although the fluorescent signal obtained from the DV was weak compared to the cyto-sol, it was sufficient to calculate the uptake rate for this compartment. CQS strains had approx. twofold higher CQGREEN uptake rates for the cytosol and 2.5-fold higher rates for the DV compared to CQR strains. Addition of verapamil to the CQR strains did not alter CQGREEN uptake rates, suggesting that PfCRT does not play a role in its uptake. This is consistent with the hypothesis that PfCRT is involved in CQ efflux from the DV and is not involved in its uptake [20]. Decreased CQ uptake rates in CQR strains compared to CQS strains may be explained through reduced availability or affinity to an intracellular target, such as free haem [4]. Thus, accumulation of CQ in the DV may contribute to parasite killing, but addi-tional drug targets in the parasite cytosol could also play a role.
Conclusion
Live cell imaging using fluorescently tagged anti-malarial drugs provides a great tool to elucidate their intracellular localization and give insights into their uptake or efflux rates. The challenge using fluorescently labelled CQ ana-logues is their sensitivity to pH and altered intracellular localization, compared to native CQ. Finding fluorescent groups that are more stable at different pH and do not influence the diffusion properties of the protein would provide a powerful tool in studying the activity of anti-malarial drugs. Alterations between drug-sensitive and -resistance strains can be closely monitored to enhance our understanding of resistance mechanisms. Moreover, affinity of CQ, or its analogues, to cytosolic proteins may direct research on new anti-malarial drug design away from the DV and increase the focus on cellular pathways in the parasite cytosol.
Abbreviations
CQ: chloroquine; CQGREEN: chloroquine analogue LynxTag-CQ™GREEN; CQR: chloroquine resistant; CQS: chloroquine sensitive; DV: digestive vacuole; IC50: half maximal inhibitory concentration; PfCRT : Plasmodium falciparum
chloroquine resistance transporter; RBC: red blood cell; iRBC: Plasmodium
falciparum infected red blood cell; uRBC: uninfected red blood cell.
Acknowledgements
We would like to acknowledge members of the Rohrbach lab for helpful discussions.
Authors’ contributions
SJR and PR designed the study; SJR performed experiments and quantified the data; SJR and PR wrote and edited the manuscript. Both authors read and approved the final manuscript.
Funding
This study was supported in part by fellowships from the German Academic Exchange Service (DAAD) (SJR), the Robert P. Harpur fellowship (SJR), and Grants from the Natural Sciences and Engineering Research Council (NSERC) Discovery Grant (PR) and the Canada Foundation for Innovation (CFI) Leaders Opportunity Fund (PR).
Availability of data
The data are available on request from the authors.
Ethics approval and consent to participate
Not applicable.
Consent for publication
Not applicable.
Competing interests
The authors declare that they have no competing interests.
Received: 14 June 2019 Accepted: 28 September 2019
References
1. WHO. World malaria report 2018. Geneva: World Health Organization; 2018.
2. Sibley CH. Understanding drug resistance in malaria parasites: basic sci-ence for public health. Mol Biochem Parasitol. 2014;195:107–14. 3. Cabrera M, Paguio MF, Xie C, Roepe PD. Reduced digestive vacuolar
accumulation of chloroquine is not linked to resistance to chloroquine toxicity. Biochemistry. 2009;48:11152–4.
4. Bray PG, Janneh O, Raynes KJ, Mungthin M, Ginsburg H, Ward SA. Cellular uptake of chloroquine is dependent on binding to ferriprotoporphyrin IX and is independent of NHE activity in Plasmodium falciparum. J Cell Biol. 1999;145:363–76.
5. Ginsburg H, Krugliak M. Chloroquine—some open questions on its anti-malarial mode of action and resistance. Drug Resist Updat. 1999;2:180–7. 6. Fivelman QL, Adagu IS, Warhurst DC. Effects of piperaquine, chloroquine,
and amodiaquine on drug uptake and of these in combination with dihydroartemisinin against drug-sensitive and -resistant Plasmodium
falci-parum strains. Antimicrob Agents Chemother. 2007;51:2265–7.
7. Lehane AM, van Schalkwyk DA, Valderramos SG, Fidock DA, Kirk K. Differ-ential drug efflux or accumulation does not explain variation in the chlo-roquine response of Plasmodium falciparum strains expressing the same isoform of mutant PfCRT. Antimicrob Agents Chemother. 2011;55:2310–8. 8. Papakrivos J, Sa JM, Wellems TE. Functional characterization of the
Plasmodium falciparum chloroquine-resistance transporter (PfCRT) in
transformed Dictyostelium discoideum vesicles. PLoS ONE. 2012;7:e39569. 9. Ch’ng JH, Kotturi SR, Chong AG, Lear MJ, Tan KS. A programmed cell
death pathway in the malaria parasite Plasmodium falciparum has general features of mammalian apoptosis but is mediated by clan CA cysteine proteases. Cell Death Dis. 2010;1:e26.
10. Ch’ng JH, Liew K, Goh AS, Sidhartha E, Tan KS. Drug-induced permeabili-zation of parasite’s digestive vacuole is a key trigger of programmed cell death in Plasmodium falciparum. Cell Death Dis. 2011;2:e216.
•fast, convenient online submission •
thorough peer review by experienced researchers in your field • rapid publication on acceptance
• support for research data, including large and complex data types •
gold Open Access which fosters wider collaboration and increased citations maximum visibility for your research: over 100M website views per year •
At BMC, research is always in progress.
Learn more biomedcentral.com/submissions
Ready to submit your research? Choose BMC and benefit from:
12. Loh CC, Suwanarusk R, Lee YQ, Chan KW, Choy KY, Renia L, Russell B, Lear MJ, Nosten FH, Tan KS, Chow LM. Characterization of the commercially-available fluorescent chloroquine-BODIPY conjugate, LynxTag-CQGREEN, as a marker for chloroquine resistance and uptake in a 96-well plate assay. PLoS ONE. 2014;9:e110800.
13. Trager W, Jensen JB. Human malaria parasites in continuous culture. Sci-ence. 1976;193:673–5.
14. Bacon DJ, Latour C, Lucas C, Colina O, Ringwald P, Picot S. Comparison of a SYBR green I-based assay with a histidine-rich protein II enzyme-linked immunosorbent assay for in vitro antimalarial drug efficacy testing and application to clinical isolates. Antimicrob Agents Chemother. 2007;51:1172–8.
15. Smilkstein M, Sriwilaijaroen N, Kelly JX, Wilairat P, Riscoe M. Simple and inexpensive fluorescence-based technique for high-throughput antima-larial drug screening. Antimicrob Agents Chemother. 2004;48:1803–6. 16. van Schalkwyk DA, Nash MN, Shafik SH, Summers RL, Lehane AM, Smith
PJ, Martin RE. Verapamil-sensitive transport of quinacrine and methylene blue via the Plasmodium falciparum chloroquine resistance transporter reduces the parasite’s susceptibility to these tricyclic drugs. J Infect Dis. 2015;213:800–10.
17. Reiling SJ, Rohrbach P. Monitoring PfMDR1 transport in Plasmodium
falciparum. Malar J. 2015;14:270.
18. Kaddouri H, Nakache S, Houze S, Mentre F, Le Bras J. Assessment of the drug susceptibility of Plasmodium falciparum clinical isolates from Africa by using a Plasmodium lactate dehydrogenase immunodetection assay and an inhibitory maximum effect model for precise measurement of the 50-percent inhibitory concentration. Antimicrob Agents Chemother. 2006;50:3343–9.
19. Le Nagard H, Vincent C, Mentre F, Le Bras J. Online analysis of in vitro resistance to antimalarial drugs through nonlinear regression. Comput Methods Programs Biomed. 2011;104:10–8.
20. Cabrera M, Natarajan J, Paguio MF, Wolf C, Urbach JS, Roepe PD. Chloro-quine transport in Plasmodium falciparum. 1. Influx and efflux kinetics for live trophozoite parasites using a novel fluorescent chloroquine probe. Biochemistry. 2009;48:9471–81.
21. Martin MM, Lindqvist L. The pH dependence of fluorescein fluorescence. J Lumin. 1975;10:381–90.
22. Shaner NC, Steinbach PA, Tsien RY. A guide to choosing fluorescent proteins. Nat Methods. 2005;2:905–9.
23. Urano Y, Asanuma D, Hama Y, Koyama Y, Barrett T, Kamiya M, et al. Selective molecular imaging of viable cancer cells with pH-activatable fluorescence probes. Nat Med. 2009;15:104–9.
24. Wunderlich J, Rohrbach P, Dalton JP. The malaria digestive vacuole. Front Biosci. 2012;4:1424–48.
25. Karolin J, Johansson LBA, Strandberg L, Ny T. Fluorescence and absorp-tion spectroscopic properties of dipyrrometheneboron difluoride (BODIPY) derivatives in liquids, lipid membranes, and proteins. J Am Chem Soc. 1994;116:7801–6.
26. Saliba KJ, Folb PI, Smith PJ. Role for the Plasmodium falciparum digestive vacuole in chloroquine resistance. Biochem Pharmacol. 1998;56:313–20. 27. Shore JD, Day DE, Francis-Chmura AM, Verhamme I, Kvassman J,
Law-rence DA, Ginsburg D. A fluorescent probe study of plasminogen activa-tor inhibiactiva-tor-1. Evidence for reactive center loop insertion and its role in the inhibitory mechanism. J Biol Chem. 1995;270:5395–8.
28. Lakowicz JR. Principles of fluorescence spectroscopy. 3rd ed. Berlin: Springer; 2006.
29. Sanchez H, Alonso JC. Bacillus subtilis RecN binds and protects 3′ -single-stranded DNA extensions in the presence of ATP. Nucleic Acids Res. 2005;33:2343–50.
30. Sanchez CP, Stein WD, Lanzer M. Is PfCRT a channel or a carrier? Two competing models explaining chloroquine resistance in Plasmodium
falciparum. Trends Parasitol. 2007;23:332–9.
31. Yayon A, Cabantchik ZI, Ginsburg H. Susceptibility of human malaria parasites to chloroquine is pH dependent. Proc Natl Acad Sci USA. 1985;82:2784–8.
32. Krogstad DJ, Schlesinger PH. The basis of antimalarial action: non-weak base effects of chloroquine on acid vesicle pH. Am J Trop Med Hyg. 1987;36:213–20.
33. Geary TG, Jensen JB, Ginsburg H. Uptake of [3H]chloroquine by drug-sensitive and -resistant strains of the human malaria parasite Plasmodium
falciparum. Biochem Pharmacol. 1986;35:3805–12.
34. Martiney JA, Cerami A, Slater AFG. Verapamil reversal of chloroquine resistance in the malaria parasite Plasmodium falciparum is specific for resistant parasites and independent of the weak base effect. J Biol Chem. 1995;270:22393–8.
35. Verdier F, Le Bras J, Clavier F, Hatin I, Blayo MC. Chloroquine uptake by
Plasmodium falciparum-infected human erythrocytes during in vitro
culture and its relationship to chloroquine resistance. Antimicrob Agents Chemother. 1985;27:561–4.
36. Reiling SJ, Krohne G, Friedrich O, Geary TG, Rohrbach P. Chloroquine exposure triggers distinct cellular responses in sensitive versus resistant
Plasmodium falciparum parasites. Sci Rep. 2018;8:11137.
37. Ginsburg H, Ward SA, Bray PG. An integrated model of chloroquine action. Parasitol Today. 1999;15:357–60.
38. Bray PG, Martin RE, Tilley L, Ward SA, Kirk K, Fidock DA. Defining the role of PfCRT in Plasmodium falciparum chloroquine resistance. Mol Microbiol. 2005;56:323–33.
39. Bray PG, Mungthin M, Ridley RG, Ward SA. Access to hematin: the basis of chloroquine resistance. Mol Pharmacol. 1998;54:170–9.
40. de Dios AC, Tycko R, Ursos LMB, Roepe PD. NMR studies of chloroquine– ferriprotoporphyrin IX complex. J Phys Chem. 2003;107:5821–5. 41. Fidock DA, Nomura T, Talley AK, Cooper RA, Dzekunov SM, Ferdig MT,
et al. Mutations in the P. falciparum digestive vacuole transmembrane protein PfCRT and evidence for their role in chloroquine resistance. Mol Cell. 2000;6:861–71.
42. Lakshmanan V, Bray PG, Verdier-Pinard D, Johnson DJ, Horrocks P, Muhle RA, et al. A critical role for PfCRT K76T in Plasmodium falciparum verapamil-reversible chloroquine resistance. EMBO J. 2005;24:2294–305. 43. Chinappi M, Via A, Marcatili P, Tramontano A. On the mechanism of
chlo-roquine resistance in Plasmodium falciparum. PLoS ONE. 2010;5:e14064. 44. Sanchez CP, Rohrbach P, McLean JE, Fidock DA, Stein WD, Lanzer M.
Differ-ences in trans-stimulated chloroquine efflux kinetics are linked to PfCRT
in Plasmodium falciparum. Mol Microbiol. 2007;64:407–20.
Publisher’s Note