RESEARCH
Low expression of
ACLY
associates
with favorable prognosis in acute myeloid
leukemia
Jinghan Wang
1,2,3†, Wenle Ye
2,3†, Xiao Yan
3,4, Qi Guo
5, Qiuling Ma
6, Fang Lin
1, Jiansong Huang
2,3and Jie Jin
1,2,3*Abstract
Background: Aberrant metabolism is a hallmark of cancer cells. Recently, ATP citrate-lyase (ACLY) expression was demonstrated as an independent predictor of clinical outcome in solid tumors. However, no systematic study was conducted to explore the prognostic impact of ACLY on acute myeloid leukemia (AML).
Methods: To assess the prognostic value of ACLY transcript, we conducted a study with a discovery and validation design. We measured ACLY transcript by real-time quantitative PCR in 274 AML patients, and validated the prognostic value in the two independent cohorts using published data. Meta-analysis of gene-expression profile and inhibi-tion ACLY expression in leukemia cell lines were conducted to help us understand the biological insight of low ACLY expression.
Results: Low ACLY expression is less common amongst AMLs with DNMT3A mutations, but coexisted in double allele CEBPA mutations. Moreover, low ACLY expression is associated with favorable overall survival in AML patients and is involved in multiple pathways. These results are also validated in two independent cohorts of AML patients. Moreover, ACLY silencing induces proliferation arrest in THP-1 and MOLM-13 leukemia cell lines.
Conclusion: We found low ACLY expression is associated with favorable overall survival in AML patients.
Keywords: ATP citrate-lyase, Acute myeloid leukemia, Prognosis
© The Author(s) 2019. This article is distributed under the terms of the Creative Commons Attribution 4.0 International License (http://creat iveco mmons .org/licen ses/by/4.0/), which permits unrestricted use, distribution, and reproduction in any medium, provided you give appropriate credit to the original author(s) and the source, provide a link to the Creative Commons license, and indicate if changes were made. The Creative Commons Public Domain Dedication waiver (http://creat iveco mmons .org/ publi cdoma in/zero/1.0/) applies to the data made available in this article, unless otherwise stated.
Background
Acute myeloid leukemia (AML) represents a group of heterogeneous hematopoietic malignant diseases. To date, substantial progress has been made in the under-standing of AML pathogenesis with respect to genomic or proteomic abnormalities, but our knowledge about the metabolic behavior of leukemia is far from satisfactory. Recently, we conducted a series of studies on the link between serum metabolites or cytogenetic abnormali-ties and treatment response in order to investigate novel
biomarkers in AML patients [1–4]. Notably, we found that increased levels of fatty acids and TCA intermediates are associated with higher risk of cytogenetic subtypes, which implied a worse clinical outcome [1, 3]. This result reflects the metabolic behavior of leukemia cells that up-regulated fatty acid synthesis, which might fuel mem-brane biogenesis and thereby affect therapy response [5, 6]. In addition, we observed that enhanced IDH1 expression is also associated with poor prognoses [4]. In humans, increased activity of the IDH1 enzyme facili-tates lipid synthesis [6, 7]. It is worth noting that ATP citrate-lyase (ACLY) is a lipogenesis enzyme, convert-ing citrate to cytosolic acetyl-CoA [7]. Acetyl-CoA is not only involved in fatty acid synthesis, but also in regulat-ing multiple pathways [8, 9]. Moreover, a growing num-ber of studies demonstrated that high ACLY expression is an independent predictor for inferior clinical outcome
Open Access
in several types of cancers, including lung, liver, and gas-tric adenocarcinoma [6, 10–14]. However, to the best of our knowledge, there is not yet a study to exclusively evaluate the clinical significance and biological insights of ACLY expression in AML. To address this unresolved issue, we evaluated the prognostic value of ACLY expres-sion in our AML patients and validated the result against two published cohorts of AML patients. At the same time, we provide several critical pathways associated with low ACLY expression, and demonstrate that inhibition of ACLY led to proliferation arrest in THP-1 and MOLM-13 leukemia cell lines. Thus, ACLY expression in AML may act as a prognostic predictor and potential therapy target in the near future.
Materials and methods
Patients
Clinical data were collected from the medical records of AML patients at the Zhejiang Institute of Hematol-ogy (ZIH) in Zhejiang Province, China. Between March 2010 and June 2017, 274 patients with detailed diagnoses and treatment information were enrolled. We excluded patients with acute promyelocytic leukemia in this study. WHO classification, cytogenetic risk classification and treatment protocols were reported previously [2, 4, 15]. Cellular materials were stored at the department of hematology in our hospital. The details can also be seen in Additional file 1. In addition, 165 patients with survival information from published data on Gene Expression Omnibus using the Affymetrix Human Genome U133A Array platform (accession number: GSE1159) and 197 patients from TCGA (https ://tcga-data.nci.nih.gov/tcga/) were set as the independent validation cohorts [16].
Quantitative real‑time PCR
Total RNA was isolated according to the manufacturer’s instructions using RNAiso plus (Takara, Japan). Reverse-transcription polymerase chain reaction (qRT-PCR) was carried out using Invitrogen RT kit according to the manufacturer’s instructions (Invitrogen, USA). ACLY mRNA expression was conducted by qRT-PCR with co-amplification of the reference gene ABL1. The relative expression levels of ACLY were measured by 2−ΔΔCt [4].
The primers sequences of ACLY and ABL1 are described in Additional file 1: Table S1.
Cytogenetic and gene mutation analysis
We isolated patients’ bone marrow (BM) samples at pri-mary diagnosis through Ficoll gradient centrifugation. FLT3-ITD, NPM1 and CEBPA gene mutations were ana-lyzed as previously described [1]. Detailed methods are available in Additional file 1.
Cell culture and knockdown of ACLY
The AML cell line THP-1, Kasumi-1, NB4 and HL-60 were purchased from the Shanghai Cell Culture Insti-tute (Shanghai, China). MV4-11, MOLM-13, OCI-AML3 cell lines were provided generously by Professor Ravi Bhatia (City of Hope National Medical Center, Duarte, CA). Human ACLY shRNA lentivirus plasmid was obtained from Genecopoeia (USA). The target-ing sequences of each shRNA are shown in Additional file 1: Table S2. The Colorimetric CellTiter 96 Aque-ous One Solution Cell Proliferation Assay (MTS assay, Promega, Madison, WI, USA) was used to measure cell proliferation. The methods for cell cultures, ACLY knockdown and detection of cell viability are detailed in Additional file 1.
Definition of clinical endpoints and statistical analysis
Results
Patient characteristics
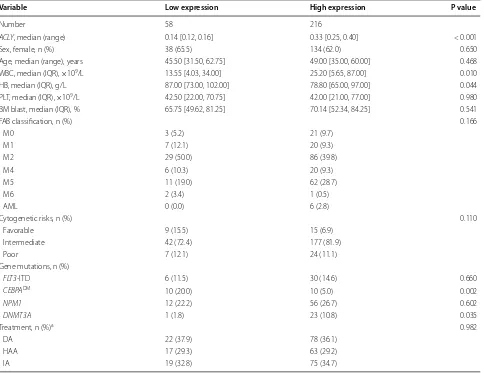
In this study, ACLY expressions were analyzed in bone marrow samples from 274 adult patients with newly diag-nosed AML. The relative transcript expression levels of ACLY/ABL1 ranged from 0.012 to 1.303, with a non-nor-mal distribution in this cohort (Additional file 1: Figure S1A, B). 172 of 274 (63%) AML patients were male. At diagnosis, patients with low ALCY expression had signifi-cantly lower WBC counts, but high levels of hemoglobin (Table 1). Interestingly, low ACLY expression were almost always accompanied by CEBPA double allele muta-tions, but mutually exclusive with DNMT3A mutations (P = 0.005). There was no significant correlation between
ACLY expression and other clinical parameters including
age, sex, platelet counts, blast percentage, cytogenetic risks, genes of NPM1, FLT3-ITD mutations and treat-ment protocols.
Prognostic significance of ACLY expression in Chinese AML patients
In the entire cohort of AML, the 3-years OS rate of our patients was 40%. Here, we have taken ACLY expression as both a continuous variable and multiple categorical variables (Additional file 1: Figure S2), and found they were statistically associated with poor OS [as a continu-ous variable, HR (95% CI), 3.54 (1.67, 7.52); P = 0.001]. Using a cutoff value of ALCY expression determined using Cutoff Finder, we organized the patients into high and low ALCY expressers. Low ACLY expressers (n = 58,
Table 1 Clinical characteristics of patients with low ACLY expression
WBC white blood cell, HB hemoglobin, PLT platelet counts, BM bone marrow, FAB French–American–British classification systems, DM double-allele, IQR interquantile a The protocols used for induction therapy in different groups including HAA, homoharringtonine-based treatment (homoharringtonine 2 mg/m2/day for 3 days, cytarabine 75 mg/m2 twice daily for 7 days, aclarubicin 12 mg/m2 daily for 7 days) regiment; DA, daunorubicin 45 mg/m2 daily for 3 days and cytarabine 100 mg/m2 daily for 7 days; IA, idarubicin 6–8 mg/m2 daily for 7 days and aclarubicin 20 mg/m2 daily for 5 days
Variable Low expression High expression P value
Number 58 216
ACLY, median (range) 0.14 [0.12, 0.16] 0.33 [0.25, 0.40] < 0.001
Sex, female, n (%) 38 (65.5) 134 (62.0) 0.650
Age, median (range), years 45.50 [31.50, 62.75] 49.00 [35.00, 60.00] 0.468 WBC, median (IQR), ×109/L 13.55 [4.03, 34.00] 25.20 [5.65, 87.00] 0.010 HB, median (IQR), g/L 87.00 [73.00, 102.00] 78.80 [65.00, 97.00] 0.044 PLT, median (IQR), ×109/L 42.50 [22.00, 70.75] 42.00 [21.00, 77.00] 0.980 BM blast, median (IQR), % 65.75 [49.62, 81.25] 70.14 [52.34, 84.25] 0.541
FAB classification, n (%) 0.166
M0 3 (5.2) 21 (9.7)
M1 7 (12.1) 20 (9.3)
M2 29 (50.0) 86 (39.8)
M4 6 (10.3) 20 (9.3)
M5 11 (19.0) 62 (28.7)
M6 2 (3.4) 1 (0.5)
AML 0 (0.0) 6 (2.8)
Cytogenetic risks, n (%) 0.110
Favorable 9 (15.5) 15 (6.9)
Intermediate 42 (72.4) 177 (81.9)
Poor 7 (12.1) 24 (11.1)
Gene mutations, n (%)
FLT3-ITD 6 (11.5) 30 (14.6) 0.660
CEBPADM 10 (20.0) 10 (5.0) 0.002
NPM1 12 (22.2) 56 (26.7) 0.602
DNMT3A 1 (1.8) 23 (10.8) 0.035
Treatment, n (%)a 0.982
DA 22 (37.9) 78 (36.1)
HAA 17 (29.3) 63 (29.2)
[image:3.595.58.542.315.688.2]21%) had a more favorable OS compared to high express-ers (n = 216) (Fig. 1a). Importantly, in the subgroup analyses we found low ACLY expressions were associ-ated with favorable OS in patients in both the cytogenetic intermediate risk group and the cytogenetically normal AML group (Fig. 1b, c). In addition, our univariate analy-sis demonstrated statistically significant, adverse survival effects resulting from older age, increased WBC counts, cytogenetically high risk and FLT3-ITD and DNMT3A gene mutations. Factors that imparted favorable survival impacts were double allele CEBPA mutations and MPN1 mutations (Table 2). Even if these and induction chemo-therapy protocols are taken into account as confounding factors, ACLY expression was still effective as an inde-pendent prognostic factor in the multivariate analysis [HR (95% CI), 1.805 (1.062, 3.068); P = 0.029; Table 2]. Of note, we found that patients treated with HAA regimens
had higher overall survival than those received with IA or DA by high and low ACLY expressions (Fig. 1d).
Low expression of ACLY was associated with favorable overall survival in two published datasets
To further evaluate the prognostic impact of ACLY expression, we analyzed the GSE1159 dataset and TCGA dataset. The median relative transcript expres-sion levels of ACLY/ABL1 were 1.53 and 3.75 in the GSE1159 and TCGA datasets, respectively. We then subdivided patients into high and low subgroups using the same statistical analysis methods used in our cohort. As a result, 43 of 165 (26%) patients in GSE1159 dataset and 49 of 197 (25%) in the TCGA cohort were identified as low ACLY expressing. In these two cohorts, patients with low ACLY expression had a favorable OS compared to those with high expression levels (Fig. 2).
02
0
40
60
80
100
Probability of Overall Survival(%)
AML
Low High
P<0.001
0 15 30 45 60
Time (Months) No. At Risk
Low 58 29 20 11 6
High 216 77 47 27 7
a
02
04
06
08
0
100
Probability of Overall Survival(%)
Cytogenetically intermediate AML
Low High
P=0.007
0 15 30 45 60
Time (Months) No. At Risk
Low 42 20 14 6 3
High 177 64 39 22 6
b
02
04
06
08
01
00
Probability of Overall Survival(%)
Cytogenetically Normal AML
Low High
P=0.005
0 15 30 45 60
Time (Months) No. At Risk
Low 37 19 13 6 3
High 147 55 32 17 5
c
02
04
06
08
01
00
Probability of Overall Survival(%)
AML
High&DAorIA High&HAA Low&DAorIA Low&HAA P<0.001
0 15 30 45 60
Time (Months) No. At Risk
High&DAorIA 153 52 29 17 4
High&HAA 63 25 18 10 3
Low&DAorIA 41 19 12 7 4
Low&HAA 17 10 8 4 2
d
[image:4.595.58.542.309.686.2]Additionally, low ACLY expression in the TCGA data-set was also shown to be negatively associated with WBC count (Additional file 1: Table S3). Finally, the prognostic factor of ACLY expression remained sig-nificant in the multivariable analysis after adjusting for the most well-established predictors of OS, such as age, WBC count, cytogenetic risks and FLT3-ITD, NPM1
and DNMT3A gene mutations in the TCGA cohort (Additional file 1: Table S4).
Meta‑analysis of gene‑expression profile in AML patients with low ACLY expression
We applied a meta-analysis of mRNA expression to our 22 CN-AML patients with previously published gene Table 2 Univariate and multivariate analysis of AML patients for overall survival
Age and WBC are taken as continuous variables
WBC white blood cell, DM double-allele, CI confidence intervals, HR hazard ratio a The treatment protocols are available from Table 1
Variables Univariate analysis Multivariate analysis
P value HR (95% CI) P value HR (95% CI)
ACLY expression (high vs. low) 0.001 2.19 (1.38, 3.475) 0.029 1.805 (1.062, 3.068)
Age < 0.001 1.007 (1.004, 1.011) 0.009 1.006 (1.001, 1.01)
WBC < 0.001 1.005 (1.003, 1.007) < 0.001 1.004 (1.002, 1.006) Cytogenetic risks
Intermediate vs. favorable 0.003 3.811 (1.556, 9.337) 0.027 3.748 (1.164, 12.069) Poor vs. favorable < 0.001 8.539 (3.247, 22.454) 0.001 7.978 (2.34, 27.197) Gene mutations (mutation vs. wild-type)
FLT3-ITD 0.022 1.66(1.076, 2.56) 0.007 1.969(1.208,3.21)
NPM1 0.051 1.434(0.998,2.061) 0.812 1.05(0.702,1.571)
CEBPADM 0.022 0.385(0.169,0.874) 0.040 0.409(0.175,0.960)
DNMT3A 0.001 2.474(1.483,4.125) 0.022 1.98(1.105,3.546)
Treatmenta
HAA vs. DA 0.001 0.503 (0.335, 0.756) 0.007 0.536 (0.341, 0.842)
IA vs. DA 0.003 0.567 (0.391, 0.824) 0.002 0.48 (0.304, 0.756)
02
04
06
08
0
100
Probability of Ov
erall Su
rv
iv
al(%)
GSE1159
Low High
P=0.04
0 12 24 36 48 60
Time (Months) No. At Risk
Low 43 32 24 22 20 18
High122 71 47 41 40 40
a
02
0
40
60
80
100
Probability of Ov
erall Su
rv
iv
al(%)
TCGA
Low High
P=0.01
0 12 24 36 48 60
Time (Months) No. At Risk
Low 49 38 30 24 18 12
High 148 73 53 29 17 11
b
[image:5.595.56.538.100.309.2] [image:5.595.61.540.363.596.2]expression dataset [15], 165 patients from the GSE1159 dataset and 197 patients from the TCGA dataset profiles to explore the biological insights of low ACLY expres-sion. We found 390 genes were down-regulated and 111 genes were upregulated in the low ACLY group using the false discovery rate (FDR < 0.05; Additional file 1: Table S5, Figure S3). In the KEGG pathways enrichment analysis, we found low ACLY expressers involved in 27 downregulated pathways, including pathways linked to oxidative phosphorylation, proteasomes, Hunting-ton’s disease and the citric acid cycle (Additional file 1: Table S6). In contrast, although none of the upregulated genes were enriched in the KEGG pathways, we found 12 genes (SPRY2, DNAH3, TRAF5, SFSWAP, ARID5A, ME3, BAZ2A, ARHGEF7, CD99, CSNK1E, GNA15 and POFUT2) in patients with pediatric acute myeloid leu-kemia bearing an inv(16) translocation [19] were upregu-lated in low ALCY expressers.
Inhibition ACLY expression induces growth arrest in AML cell lines
The implication of ACLY expression levels as an inde-pendent prognostic factor and its involvement in mul-tiple pathways suggest that ALCY may be functionally important for maintaining the continuous proliferation of leukemia cells. To evaluate this possibility, firstly, we ana-lyzed the expression levels of ACLY across hematopoi-etic cell types including acute myeloid leukemia (AML), chronic myeloid leukemia (CML), acute lymphoid leuke-mia (ALL) and myelodysplastic syndrome (MDS) in the BloodSpot web-based interface (http://www.blood spot. eu, Additional file 1: Figure S4). As a result, we found that patients with t(11q23)/MLL abnormalities had the highest levels of ACLY expression among all kinds of hematopoietic cells (Additional file 1: Figure S4). In the subgroup analyses, ACLY expression was also higher in AML patients with t(11q23)/MLL abnormalities than in others such as healthy controls, AML patients with nor-mal karyotype, t(8;21), t(15;17) and complex karyotypes, respectively. These results indicated that ACLY expres-sion was predominant in AML blasts with t(11q23)/MLL abnormalities. However, the individual’s distribution of ACLY expression was very wide in patients with t(11q23)/ MLL abnormalities, implying these patients obtained a diverse range of ACLY expressions. In order to test this result, secondly, we detected ACLY expression in a serial of leukemia cell lines with different genetic characteris-tics including Kasumi-1 with t(8;21), NB4 with t(15;17), MOLM-13 and THP-1 with t(11q23)/MLL, and other cell lines such as MV4-11, HL-60, OCI-AML3. As a result, THP-1 and MOLM-13 cell lines had the distinct expres-sion levels of ACLY, although they had the same genetic background of t(11q23)/MLL abnormalities (Additional
file 1: Figure S5). Of note, ACLY expression was the highest in THP-1 cell lines while the relatively low in MOLM13 cell lines. This expression pattern in proteins and mRNAs (Additional file 1: Figure S5) was in line with those exhibiting a diverse range of ACLY expression in patients with t(11q23)/MLL abnormalities. Of inter-est, there was a morsel of the inhibition effect of ACLY expression using ACLY inhibitor SB-204990 in KG-1 with TP53 mutation, while no difference was seen in IC50 val-ues of the other cell lines (Additional file 1: Figure S5). At last, we measured the proliferation of MOLM-13 and THP-1 cells, using short hairpin RNA (shRNA) and small molecular inhibitors to silence ACLY expression. Knock-down expression of ACLY was confirmed by Western blot analysis after 48 h of shRNA treatment (Additional file 1: Figure S6). The knockdown of ACLY in the two leukemia cell lines resulted in growth arrest (Fig. 3a, b). In parallel, silencing ACLY expression with the inhibitor SB-204990 significantly reduced the proliferation of MOLM-13 and THP-1 leukemia cell lines (Fig. 3c, d). These results sug-gest that ACLY might have potential as a therapeutic target.
Discussion
Metabolic reprogramming is generally regarded as a hall-mark of cancer cells [20]. Since enhanced glycolysis was first reported in cancer cells by Otto Warburg, several studies have demonstrated that cancer cells also undergo aberrant TCA cycles and lipogenesis [21–26]. Recently, we also found that some fatty acids and TCA intermedi-ates were associated with drug resistance [1, 3]. Impor-tantly, enhanced glycolysis of glucose to lactate allows proliferating tumor cells to shunt various glycolytic inter-mediates into the fatty acid synthesis pathway [27]. Nota-bly, ACLY as a lipogenesis enzyme links between TCA cycle and fatty acid synthesis pathway. Acetyl-CoA is the product of ACLY, serving as a vital building block for the endogenous biosynthesis of fatty acids, alongside other involvement in regulating nuclear and histone acetyla-tion [9]. More importantly, it is now thought that ACLY expression may play an important role in both tumor metabolism and tumorigenesis [9, 28, 29]. Several studies have demonstrated that ACLY overexpression can serve as a prognostic factor in various solid tumors [10, 14, 28]. One possible reason is that the upregulated fatty acid synthesis caused by ACLY activity in tumor cells saturates membrane lipids, thereby leading to drug resistance and affecting therapy response [6].
These findings imply that ACLY expression might have prognostic significance for AML. Therefore, we further adopted a retrospective training-validation scheme to test the relationship between ACLY expression and OS in AML patients. In our training cohort, we found ACLY expressions were strongly associated with over-all survival (Fig. 1). Because ACLY expression is also strongly associated with traditional clinical param-eters with prognostic values, the correlation between ACLY expression and overall survival may be artificial. In order to exclude cytogenetic confounding variables, we further limited patients to the specific cytogenetic subgroups. Resultingly, we found ACLY expression was strongly associated with overall survival in AML, CI-AML and CN-CI-AML patients, respectively (Fig. 1). This result supported the fact that the prognostic value of ACLY expressions may not be confounded by cytoge-netic risk groups. Moreover, we repeated similar mul-tivariate analyses, assuming other clinical parameters as confounding factors, such as age, WBC, cytogenetic risks and FLT3-ITD, NPM1 and CEBPA gene mutations (Table 1). Even adjusting for these factors, low ACLY expression remained a significant prognostic predict-ing factor in the multivariate models (Table 2). Finally, the favorable survival of low ACLY expressing patients noted in our patient cohort was also validated in two independent cohorts of AML patients, following a simi-lar methodology. Thus, we can confirm aberrant ACLY expression can serve as a predictor for survival in AML patients.
To further explore why low ACLY expression correlates with favorable survival in AML patients, we derived a gene expression signature using our three previously used datasets. Interestingly, downregulation of multiple path-ways, alongside upregulation of 12 genes co-expressed in pediatric AML patients bearing inv(16) translocation, were seen in low ACLY expression patients (Additional file 1: Tables S4, S5). These results indicated that aberrant ACLY expression may play a critical role of the progres-sion of AML. Therefore, we suppressed ACLY expres-sion using shRNA and an inhibition. We found silencing ACLY expression does reduce the proliferation of leuke-mia blasts in vitro. This similar result was reported by Georgia Hatzivassiliou in tumor cells recently [30]. Thus, our results demonstrated that ACLY may promote leuke-mia growth with prognostic significance and can poten-tially be used as a novel drug target in the future.
Conclusion
[image:7.595.59.538.87.318.2]showed growth arrest of AML cell lines, highlighting ACLY’s role as both important in the proliferation of AML and as a potential target for future drug therapies.
Additional file
Additional file 1. Supplementary methods and data. Authors’ contributions
JHW and JJ designed the study, analyzed the data and write this article, JHW, WLY, XY, QG, QLM, FL and JSH performed the experiments. All authors have reviewed the manuscript. All authors read and approved the final manuscript.
Author details
1 Department of Hematology, The First Affiliated Hospital, Zhejiang University College of Medicine, No. 79 Qingchun Road, Hangzhou 310003, Zhejiang, People’s Republic of China. 2 Institute of Hematology, Zhejiang University, Hangzhou, People’s Republic of China. 3 Key Laboratory of Hematologic Malig-nancies, Diagnosis and Treatment, Hangzhou, Zhejiang, People’s Republic of China. 4 Department of Hematology, Qingdao Municipal Hospital, Qingdao, Shandong, China. 5 Department of Nephrology, The First Affiliated Hospital, Zhejiang University, Hangzhou, China. 6 Department of Hematology, The Second Affiliated Hospital of Henan University of Traditional Chinese Medicine, Zhengzhou, China.
Acknowledgements
We are very thankful to Mark Zhu (mark.zhu@yale.edu) for carefully reading and polishing the manuscript.
Competing interests
The authors declare that they have no competing interests.
Availability of data and materials
In this study, 165 patients with survival information from published data on Gene Expression Omnibus using the Affymetrix Human Genome U133A Array platform (Accession Number: GSE1159) and 197 patients from TCGA (https :// tcga-data.nci.nih.gov/tcga/) were set as the independent validation cohorts.
Consent for publication
None of the individual person’s data is in this text for publication.
Ethics approval and consent to participate
The study was approved by the Institutional Review Boards of the First Affili-ated Hospital of Zhejiang University, and performed in accordance with the Declaration of Helsinki.
Funding
This work is supported by Zhejiang Provincial Natural Science Foundation of China (LY19H080009), National Natural Science Foundation of China grants (81470305-H0812, U1404806), University Science and Technology Innovation Talent Support Program of Henan Province (17HASTIT046).
Publisher’s Note
Springer Nature remains neutral with regard to jurisdictional claims in pub-lished maps and institutional affiliations.
Received: 28 February 2019 Accepted: 15 April 2019
References
1. Chen WL, Wang JH, Zhao AH, Xu X, Wang YH, Chen TL, Li JM, Mi JQ, Zhu YM, Liu YF, et al. A distinct glucose metabolism signature of acute myeloid leukemia with prognostic value. Blood. 2014;124:1645–54.
2. Wang JH, Chen WL, Li JM, Wu SF, Chen TL, Zhu YM, Zhang WN, Li Y, Qiu YP, Zhao AH, et al. Prognostic significance of 2-hydroxyglutarate levels in acute myeloid leukemia in China. Proc Natl Acad Sci USA. 2013;110:17017–22.
3. Wang Y, Zhang L, Chen WL, Wang JH, Li N, Li JM, Mi JQ, Zhang WN, Li Y, Wu SF, et al. Rapid diagnosis and prognosis of de novo acute myeloid leukemia by serum metabonomic analysis. J Proteome Res. 2013;12:4393–401.
4. Ma QL, Wang JH, Wang YG, Hu C, Mu QT, Yu MX, Wang L, Wang DM, Yang M, Yin XF, et al. High IDH1 expression is associated with a poor prognosis in cytogenetically normal acute myeloid leukemia. Int J Cancer. 2015;137:1058–65.
5. Menendez JA, Lupu R. Fatty acid synthase and the lipogenic phenotype in cancer pathogenesis. Nat Rev Cancer. 2007;7:763–77.
6. Chypre M, Zaidi N, Smans K. ATP-citrate lyase: a mini-review. Biochem Biophys Res Commun. 2012;422:1–4.
7. Metallo CM, Gameiro PA, Bell EL, Mattaini KR, Yang J, Hiller K, Jewell CM, Johnson ZR, Irvine DJ, Guarente L, et al. Reductive glutamine metabolism by IDH1 mediates lipogenesis under hypoxia. Nature. 2012;481:380–4. 8. Zaidi N, Royaux I, Swinnen JV, Smans K. ATP citrate lyase knockdown
induces growth arrest and apoptosis through different cell- and environ-ment-dependent mechanisms. Mol Cancer Ther. 2012;11:1925–35. 9. Granchi C. ATP citrate lyase (ACLY) inhibitors: an anti-cancer strategy
at the crossroads of glucose and lipid metabolism. Eur J Med Chem. 2018;157:1276–91.
10. Qian X, Hu J, Zhao J, Chen H. ATP citrate lyase expression is associated with advanced stage and prognosis in gastric adenocarcinoma. Int J Clin Exp Med. 2015;8:7855–60.
11. Zhou Y, Bollu LR, Tozzi F, Ye X, Bhattacharya R, Gao G, Dupre E, Xia L, Lu J, Fan F, et al. ATP citrate lyase mediates resistance of colorectal cancer cells to SN38. Mol Cancer Ther. 2013;12:2782–91.
12. Teicher BA, Linehan WM, Helman LJ. Targeting cancer metabolism. Clin Cancer Res. 2012;18:5537–45.
13. Teng CF, Wu HC, Hsieh WC, Tsai HW, Su IJ. Activation of ATP citrate lyase by mTOR signal induces disturbed lipid metabolism in hepatitis B virus pre-S2 mutant tumorigenesis. J Virol. 2015;89:605–14.
14. Csanadi A, Kayser C, Donauer M, Gumpp V, Aumann K, Rawluk J, Prasse A, zur Hausen A, Wiesemann S, Werner M, Kayser G. Prognostic value of malic enzyme and ATP-citrate lyase in non-small cell lung cancer of the young and the elderly. PLoS ONE. 2015;10:e0126357.
15. Wang J, Li F, Ma Z, Yu M, Guo Q, Huang J, Yu W, Wang Y, Jin J. High expression of TET1 predicts poor survival in cytogenetically normal acute myeloid leukemia from two cohorts. EBioMedicine. 2018;28:90–6. 16. Tomasson MH, Xiang Z, Walgren R, Zhao Y, Kasai Y, Miner T, Ries RE,
Lub-man O, Fremont DH, McLellan MD, et al. Somatic mutations and germline sequence variants in the expressed tyrosine kinase genes of patients with de novo acute myeloid leukemia. Blood. 2008;111:4797–808.
17. Budczies J, Klauschen F, Sinn BV, Gyorffy B, Schmitt WD, Darb-Esfahani S, Denkert C. Cutoff Finder: a comprehensive and straightforward web application enabling rapid biomarker cutoff optimization. PLoS ONE. 2012;7:e51862.
18. Wang X, Kang DD, Shen K, Song C, Lu S, Chang LC, Liao SG, Huo Z, Tang S, Ding Y, et al. An R package suite for microarray meta-analysis in quality control, differentially expressed gene analysis and pathway enrichment detection. Bioinformatics. 2012;28:2534–6.
19. Yagi T, Morimoto A, Eguchi M, Hibi S, Sako M, Ishii E, Mizutani S, Imashuku S, Ohki M, Ichikawa H. Identification of a gene expression signature associated with pediatric AML prognosis. Blood. 2003;102:1849–56. 20. Vander Heiden MG. Targeting cell metabolism in cancer patients. Sci
Transl Med. 2010;2:31ed1.
21. Hopperton KE, Duncan RE, Bazinet RP, Archer MC. Fatty acid synthase plays a role in cancer metabolism beyond providing fatty acids for phos-pholipid synthesis or sustaining elevations in glycolytic activity. Exp Cell Res. 2014;320:302–10.
22. Zaidi N, Lupien L, Kuemmerle NB, Kinlaw WB, Swinnen JV, Smans K. Lipogenesis and lipolysis: the pathways exploited by the cancer cells to acquire fatty acids. Prog Lipid Res. 2013;52:585–9.
•fast, convenient online submission
•
thorough peer review by experienced researchers in your field
• rapid publication on acceptance
• support for research data, including large and complex data types
•
gold Open Access which fosters wider collaboration and increased citations maximum visibility for your research: over 100M website views per year
•
At BMC, research is always in progress.
Learn more biomedcentral.com/submissions
Ready to submit your research? Choose BMC and benefit from: 24. Notarnicola M, Tutino V, Caruso MG. Tumor-induced alterations in lipid
metabolism. Curr Med Chem. 2014;21:2729–33.
25. Furuta E, Okuda H, Kobayashi A, Watabe K. Metabolic genes in cancer: their roles in tumor progression and clinical implications. Biochim Bio-phys Acta. 2010;1805:141–52.
26. Zaytseva YY, Harris JW, Mitov MI, Kim JT, Butterfield DA, Lee EY, Weiss HL, Gao T, Evers BM. Increased expression of fatty acid synthase provides a survival advantage to colorectal cancer cells via upregulation of cellular respiration. Oncotarget. 2015;6:18891–904.
27. Corbet C, Feron O. Metabolic and mind shifts: from glucose to glutamine and acetate addictions in cancer. Curr Opin Clin Nutr Metab Care. 2015;18:346–53.
28. Migita T, Okabe S, Ikeda K, Igarashi S, Sugawara S, Tomida A, Soga T, Taguchi R, Seimiya H. Inhibition of ATP citrate lyase induces triglyceride accumulation with altered fatty acid composition in cancer cells. Int J Cancer. 2014;135:37–47.
29. Londono Gentile T, Lu C, Lodato PM, Tse S, Olejniczak SH, Witze ES, Thompson CB, Wellen KE. DNMT1 is regulated by ATP-citrate lyase and maintains methylation patterns during adipocyte differentiation. Mol Cell Biol. 2013;33:3864–78.