Theses
Thesis/Dissertation Collections
1-1-1994
Comparison study of proofing systems
Ravi Raj Adukambarai
Follow this and additional works at:
http://scholarworks.rit.edu/theses
This Thesis is brought to you for free and open access by the Thesis/Dissertation Collections at RIT Scholar Works. It has been accepted for inclusion
in Theses by an authorized administrator of RIT Scholar Works. For more information, please contact
Recommended Citation
Comparison study
ofproofing
systemsby
Ravi
Raj
Adukambarai
A
thesis
submittedin
partialfulfillment
ofthe
requirementsfor
the
degree
ofMaster
ofScience
in
the
School
ofPrinting
Management
andSciences
in
the
College
of
Graphic
Arts
andPhotography
ofthe
Rochester Institute
ofTechnology
January
1994
Thesis Advisor:
Professor Frank Cost
Rochester, New York
Certificate of Approval
Master's Thesis
This is to certify that the Master's Thesis of
Ravi Raj Adukambarai
with a major in Printing technology
has been approved by the Thesis Committee as satisfactory
for the thesis requirement for the Master of Science degree
at the convocation of January 1994.
Thesis committee:
Frank Cost
Thesis Advisor
Joseph L. Noga
Graduate Program Coordinator
proofing
I,
Ravi
Raj
Adukambarai,
hereby
grant permissionto the
Wallace
Memorial
Library
ofRIT,
to
reproducemy
thesis
in
whole orin
part.Any
reproduction will notbe
for
commercial use or profit.
I
wouldlike
to thank
my
graduate programcoordinator, Professor Joseph
Noga,
for
allhis
supportduring
my
period ofstudy
atRIT. Thanks
to
Professor Frank
Cost
for his
patience and constant encouragement and alsoto
Dr
Charles
Layne
for his
help
in
the
statisticaldesign
ofthe thesis.
I
wishto
mentionProfessor
Barbara
Birkett,
who advised and guided me atdifficult
times
during
my
period ofstudy.
I
wouldlike
to
expressmy
appreciation and gratitudeto
all..Thank
youvery
much.Ravi
Raj
Adukambarai.
Table
Contents
List
oftables
vList
offigures
viAbstract
viiChapter
1
.Introduction
1
Chapter 2.
Review
ofthe
Literature
8
Chapter 3.
The Hypothesis
16
Chapter
4.
Methodology
18
Chapter
5.
Results
andConclusions
20
Bibliography
27A
Appendices
27B
Appendix A.
A1-A10,
the
L* a*b*,
AE
values ofcyan, magenta,
yellow,
flesh
and red patches of samples27C
Appendix B.
B1-B2,
AE
values oftoner
andfilm based
systems37
Appendix
C.
Figure
1-20,
L* a*b*,
AE
-Line
graphsfor
toner
based
method40
Appendix
D.
Figure
21-40,
L* a*b*,
AE
-Line
graphsfor film based
method61
A1.
Data
sheetfor
cyan patch -TonerSystem
27
A2.
Data
sheetfor
magenta patch -Toner
System
28
A3.
Data
sheetfor
yellow patch -Toner
System
29
A4.
Data
sheetfor
flesh
patch -Toner
System
30
A5.
Data
sheetfor
red patch-Toner
System
31
A6.
Data
sheetfor
cyan patch -Film based
System
32
A7.
Data
sheetfor
magenta patch -Film
based
System
33
A8.
Data
sheetfor
yellowpatch-Film based
system34
A9.
Data
sheetfor flesh
patch -Film
based
System
35
A10.
Data
sheetfor
red patch-Film based
System
36
B1.
AE
Values
oftoner
based
system38
List
Figures
Figure
1
.Cyan
patch-
line
graph -L*
-toner
based
system41
Figure
2.
Cyan
patch -line
graph-a*
-
toner
based
system
42
Figure
3.
Cyan
patch-line
graph -b*
-
toner
based
system
43
Figure
4.
Cyan
patch-line
graph-AE
-toner
based
system44
Figure
5.
Magenta
patch-line
graph -L*-
toner
based
system45
Figure
6.
Magenta
patch-line
graph -a*-
toner
based
system46
Figure
7.
Magenta
patch-line
graph -b*-
toner
based
system47
Figure
8.
Magenta
patch -line
graph-AE
-toner
based
system48
Figure
9.
Yellow
patch-line
graph -L*-
toner
based
system
49
Figure
10.
Yellow
patch -line
graph -a*toner
based
system50
Figure
11
.Yellow
patch-
line
graph -b*
-toner
based
system51
Figure
1 2.
Yellow
patch -line
graph
-AE
-toner
based
system52
Figure
1
3.
Flesh
patch-line
graph -L*- toner
based
system53
Figure
1 4.
Flesh
patch-line
graph -a*- toner
based
system
54
Figure
15.
Flesh
patch -line
graph -b*
-toner
based
system55
Figure
1 6.
Flesh
patch-line
graph-AE
-toner
based
system56
Figure
1
7.
Red
patch-line
graph -L*-
toner
based
system57
Figure
1
8.
Red
patch -line
graph -a*
-toner
based
system58
Figure
1 9.
Red Patch
-line
graph -b*-
toner
based
system
59
Figure 20.
Red
Patch
-line
graph -AE
-toner
based
system60
Figure 21
.Cyan
patch-
line
graph -L*-film
based
system62
Figure
22.
Cyan
patch-line
graph -a*
-
film
based
system63
Figure
23.
Cyan
patch -line
graph-b*
-
film
based
system
64
Figure
24.
Cyan
patch -line
graph-AE
-film
based
system
65
Figure
25.
Magenta
patch -line
graph -L*
-
film based
system
66
Figure 26.
Magenta
patch-line
graph -a"
-film
based
system67
Figure
27.
Magenta
patch-line
graph -b*
-film
based
system68
Figure 28.
Magenta
patch -line
graph-AE
-film
based
system69
Figure
29.
Yellow
patch -line
graph-L*
-
film based
system
70
Figure
30.
Yellow
patch -line
graph -a*
-film based
system71
[image:8.547.74.479.95.681.2]Figure
33.
Flesh
patch-line
graph -L*
-film based
system74
Figure 34.
Flesh
patch-line
graph -a*
-film based
system75
Figure
35.
Flesh
patch-line
graph -b*
-film
based
system76
Figure
36.
Flesh
patch-line
graph-AE
-film
based
system77
Figure 37.
Red
patch-line
graph -L*
-film
based
system78
Figure
38.
Red
patch -line
graph -a*
-
film based
system
79
Figure
39.
Red
Patch
-line
graph -b*-
film
based
system80
Figure
40.
Red Patch
-line
graph-AE
-film based
system81
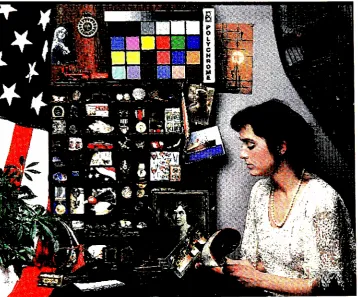
Figure
41
.Test
target
usedfor
data
collection82
[image:9.547.71.486.48.261.2]The
following
study
was an attemptto
comparetwo
methods ofproofing,
namely,
atoner
based
method and afilm
based
method,
in
terms
of colorimetricvariation.
The study
waslimited
to AE
readingstaken
from five
colorpatches off a standardtest
target,
the
colorsbeing
Cyan, Magenta,
Yellow,
Flesh-Tone,
andRed.
AE
is
a measure ofthe
colordifference
of a samplefrom
aknown
standard.
Thirty
proofs were madeby
each methodusing
the
same set of separationfilms
and colorimetric readingstaken
from
each prooffor
each ofthe
colorsmentioned above.
A
statistical comparison wasdone
to test
if
there
wasany
difference
in
terms
of color variationbetween
the two
systemsfor
each ofthe
colors mentioned.
It
wasfound
that the two
systems were consistent with each otherin
case ofthe
Magenta,
Yellow
andRed
colors,
but
were not consistentin
case ofthe
Cyan
and
Flesh
patches.In
terms
of overall performancefor
this experiment,
it
wasfound
that
the
film based
system performedbetter in
terms
ofconsistency
ascompared
to the toner
based
system.However,
it
shouldbe kept in
mindthat
only five
color patches weretested
andin
orderto
cometo
a more concreteconclusion,
various othertests
using
a wider spectrum of colors wouldhave
to
be
conducted.Introduction
Proofing
is
vitalto
practically
all printing.It
showsthe
printer and customer whatthe
job
willlook like
after printing.Changes
canbe
made,
if
necessary,
before
the
job
goesto
press where expensive presstime,
paper,
andink
canbe
wastedif
everything is
not right.Color proofing is
avery
important
and criticalstep
in
the
process of color reproduction as color proofs are made at
different
stages andfor
many diverse
usesin
the
process.There
are proofsfor
customerapproval,
proofs
for
quality
control,
and proofsfor internal
communication within a printshop.
The
colorproof,
whichis usually
madebefore
the
production runfor
customerapproval,
is
expectedto
be
a reasonable representation ofthe
printedjob
sothe
customer can
determine
whatmodifications,
if
any,
are neededbefore
printing.When
approved,
it becomes
the
guidefor
pressmento
useduring
makeready
to
derive
the
OK
sheetthat
is
usedfor
checking
the
printing
during
the
run.If
the
proof
does
not reproducethe
printing
characteristics ofthe process, there
is
the
risk of
difficulty
in
getting
the
printedjob
to
matchthe proof,
which can resultin
long,
tedious,
expensive corrections onthe press,
plateremakes,
andpossibly
job
rejection.1Color proofing
has become
animportant
aspect ofthe
printing
industry
withthe
increase in
the
amount of process color workbeing
demanded
by
printbuyers.
When choosing
aproofing
system(or
just recalibrating
your oldsystem) it is
important
to
realizethe
purpose ofthe
proof.The
proofis
a communicationtool
that
is
usedby
the
separator, printbuyer,
pressman,
andin
some casesthe
Proofs
internal,
As
aninternal
tool
it is
usedto
communicate with variousdepartments
to
evaluate
the results,
as well as a guide and correctivetool.
For
example,
it is
difficult
to
visualizethe
subtle changesin
the
reproductionfrom
the
adjustmentsmade
in
the
scannerfor
colorcorrection,
gradation etc.Once
the
proofis
made,
the
scanner operator can evaluatethe
separationsfor
further
corrective adjustmentsin
the
scanner.The
proofs provide an objectiveway
to
evaluatethe
resultsin
a scannerfor
subsequent corrections.In
the
sameway, the
stripper orthe
printer can usethe
proof as a guideto crop, size,
and runthe
set of separationsin
a press.The
otherfunction
ofthe
proofis
more criticalin
terms
of resemblanceto the
final
printing,
whenit
is
shownto the
customerto
explainhow
the
job is
going
to
look
whenit
willbe
printed.In
this
situationthe
press proof couldhave
servedthe
purposebest.
However,
the
costinvolved in
the stripping,
making
plates,
andthen
running
allfour
colorsin
a pressfor
making
a proofis
prohibitive,
especially if
changes are required atthis
stage.Press
proofshave
their
disadvantages too.
Since
the
proof willbe done
by
a slow pressrun,
it
may
notlook
the
same asthe
finished
product.However,
a prepress proofis
aninexpensive
alternativefor
a press proofto
predictfor
the
customer whatthe
final job
willlook like.
This
is
the
first
time
the
customer seesthe
resultfrom
the
original presented and on
the
basis
ofthis
he
approvesthe
separations produced, perhaps with corrections.As
such, a more cautious approach shouldbe
undertaken whenthese
prepress proofs are presentedto
the
customerfor
approval.3
Consistency
from
proofto
proofis
ofthe
utmostimportance.
Lack
ofconsistency,
andtherefore,
lack
ofaccuracy
ofthe proof,
is
the
most common complaintheard from
both
printers and customers.The
color proofer should nevertry
to
All
prepressproofing
methods requirequality
control procedures.The
operator must striveto
standardizethe
proofing
technique.
The only
assurancethe
customerhas
that the
proof will print"like
it
looks"is
to
have had
past experiences andto trust the
color proofer's work.The
personmaking
the
proofs must use controldevices
that
willinsure
that
each proofis
madeto the
exact specifications.The
proofthat
is
made should assurethat the
separations are correct.The
prooferhas
animportant
responsibility.At
the
press,
it
is
too
late
andtoo
expensiveto
find
that the
separations wereincorrectly
made andthat the
final
reproduction will not matchthe
proof.The
variables of eachproofing
system mustbe
understood and controlled.Regardless
of whetherit is
a press proof or an off-pressproof, the exposures,
ink
densities,
anddot
gain willhave
to
be
measured and controlled.Exposure
controldevices
and press control strips shouldbe
usedduring
the
proofing
process,
Then,
the
finished
proof canbe
evaluatedto
determine if it
was made correctly.4When
it
comesto
choosing
aproofing
systemthe
company'sneeds,
budget,
and customer need must
be
met.It does
no goodto
have
acheap proofing
systemthat
produces proofsthat
yourcustomer would never approve.Accuracy,
consistency,
quality,
cost,
and speed arethe
important
characteristics ofproofing
systems.5This
to
the
consistency
two
proofing
currently
being
usedwidely
in
the
industry,
namely, toner
based
methods andfilm based
methods.Colorimetry
is
better
suitedfor measuring
press sheets and proofsbecause
it
measuresthe
colorants asthe
eye seesthem,
whichis
more effectivethan
Review
ofthe
Literature
The
hierarchy
of colorproofing involves
along
and arduous series of steps.The
color
proofing
series starts as a part ofthe
color separation process.Color
proofs are made
from
the
color separationfilms
to
determine
(1)
how
closely
they
reproducethe original,
(2)
whether plates madefrom
the
films
will produce an acceptable print onthe press,
and(3)
if
either orboth
conditions are notmet,
whether corrections canbe
madein
the
films
to
help
them
satisfy
the
requirements,
or whether new separations shouldbe
made.After
the
separations are corrected or
remade,
a new proofis
made,
whichif it
satisfiesthe requirements,
is
shownto the
customerfor
approval.The
Fuji
Color
Art
And MatchPrint
systemsfall
underthe
category
ofintegral
(single sheet) proofing
systems.There
aretwo
majortypes
ofintegral
proofing
systems.
The
first
type
is
afilm
based
system andthe
otheris
atoner
based
system.
These
arethe
most popular offpressproofing
systemsbecause
oftheir
low
cost and good color reproduction.Matchprint
andColor Art fall
underthe
category
offilm based
systems andDupont's Cromalin is
atoner
based
system.Match
Print II
:At Print
85,
3M
introduced
Matchprint II
which produces printsthat
look
the
same whetherthey
are madefrom
negatives or positives ofthe
same separations.
Matchprint II differs from Matchprint in
the
base
sheetsused,
and
the
way
the
imaging
films
aretransferred
to the
base
sheets.Matchprint
uses pressure sensitive coatings
to
adherethe
colorfilm
to the
yellow sheet andthe
composite ofthe
four
colorfilms
to the
printing
substrate.In
Matchprint
II
the
yellow color
film
is
laminated
withheat
and pressuredirectly
to
a specialbase
sheet,
exposedto the
appropriate separationfilm
and processed.The
sequenceFuii Color Art
Proofing
System:
This is
transfer type
single sheet colorproofing
processdeveloped
by
Fuji Photo
Film
Co. Ltd
andintroduced
atJP-85
Printing
Equipment
Exhibition in Japan in
March
1985.
It
consists ofindividual
pigmented photosensitive
films
which are exposed and processed and canbe
viewed
like
anoverlay
proof.The
single sheet proofis
producedby laminating
the
images from
each separatefilm in
succession onto areceiving
sheet andfrom
it
to the
actualprinting
paper.The
final
proofis
a sandwich ofthe
pigmented
images in
the
light-hardened
photosensitivelayers
onthe
actualprinting
base. A
matte surface canbe
simulatedby
casting
a matte pattern with aspecial matte cover
film
overthe
proof.The
whole processtakes
aboutten
minutes
for
aB2
size proof.Procedure
for
making
Fuji Color Art Proofs:
There
arefive
stepsfor
making
Fuji
Color Art
proofs.These
are(1)
exposure;
(2)
processing;
(3)
transfer
ofthe
colorimages from
the
individual
films
to
the
receiverbase;
(4)
transfer
ofthe
compositeimage from
the
receiverbase
to the
printing
paper;
and(5)
overallexposure of
the
laminated
sandwich of receiver sheet andprinting
substrate.There
is
a sixth optionalstep in
case a matte surfaceis desired
onthe
proof.Exposure:
Color
separation negatives are exposedin
roomlight
emulsionto
emulsion on
the
Color Art films
withthe
protectivefilms
in
place.Dot
gain canbe
controlledby
exposure.Processing:
After
exposurethe
protectivefilm
is
removed andthe
pigmentedphotosensitive
coating
is
processedin
an alkalinedeveloper
in
the
Color
Art
Processor.
The processing
removesthe
unexposedcoating
leaving
the
light
hardened
pigmentedimage
andthe
stripping
layer
onthe
polysterbase.
Total
processing
time
(dry
to
dry) including
developing,
masking,
anddrying
is
one minute.Transfers
The
protectivefilm is
removedfrom
the
receiverbase.
The base is
base
in
a similar manner.Transfer II:
After
allthe
images
aretransferred to the
receiverbase
it
is
registered with
the
printing
substrate andfed into
the
laminator
wherethe
composite
four images
aretransferred to the
printing
substrate.Post
Exposure: After
transfer
an overall exposureis
givento the
sandwich ofthe
receiver
base
andthe
printing
substrate.This
exposurehardens
the
photoadhesive
layer in
the
receiverbase
whichfacilitates
removal ofthe
film
supportof
the
receiverbase from
the
proof.Matte
Surface:
The
surface ofthe
proofis
glossy
afterthe
base
is
removed.It
can
be
convertedto
a mattefinish
by
casting
a matte pattern with a special mattefilm
to the
surface ofthe
proofusing
the
laminator.
The
total time to
carry
out allthese
stepsto
produce aColor
Art
proofis
ten
minutes.3
Cromalin
proofing
systems:jw0 Cromalin
colorsystems,
positive andnegative,
are produced
by
Dupont.
The
processes arerelatively
simple,
consisting
ofCromalin
film,
dry
pigmentedtoners,
alaminator,
andtoning
equipment.A
colorproof
is
preparedby laminating
Cromalin film
(positive
ornegative)
to
a selectedsubstrate,
exposing it in
contact with a positive or negative(depending
onthe
type
ofCromalin film
used),removing
the
cover sheet andtoning
the
tacky
image
withtbe
approriate colortoner
corresponding
to
aprinting
ink.
Repeating
the
procedurefor
each process color separation produces a4-color
Cromalin
proof.
The
materials and equipment usedin
this
process are:Cromalin Film: Positive Cromalin film
consists of atacky
or adhesivea mylar polyster
film base.
When
the
photopolymerlayer is
exposedthrough
afilm
positive, the
exposed areas which representthe
nonimage
areasharden
and
lose
their tackiness
sothey
do
not accepttoner
during
the
toning
step.The
unexposed
areas,
onthe
otherhand,
which representthe
image
areas remaintacky
and acceptthe toner.
Negative Cromalin film has
a construction similarto the
positiveCromalin
film
except
the
photopolymer usedhas
a reverse reaction.It
is hard
andnon-tacky
until exposure when
the
exposed areas soften andbecome
tacky
andthe
unexposed areas remain
hard
and non-tacky.When
a negativeis
exposedto
the
negativeCromalin film layer
the
image
areas are exposedrendering
these
areas on
the
photopolymerlayer
tacky
sothey
receivetoner
andthe
non-imageareas are not exposed
leaving
them
hard
andnon-tacky
and non-receptiveto
the toner.
Toners:
The
toners
aredry
colorants(dyes
orpigments)
which aredesigned
to
adhere
to
the
adhesive(tacky)
photopolymer.In
positiveCromalin
this
is
the
unexposed
area;
in
negativeCromalin it is
the
exposed area.Process
colortoners
are availableto
match most color processinks. In
addition,
specialprocess colors are available
that
addressindustry
specifications such asSWOP,
and
Euroscale inks. Other
toners
are available which canbe blended
to
simulate most
ink hue
and strength requirements.When hand
toning,
the
same processtoners
canbe
usedfor both
positive and negativeworking
Cromalin.
Metallic
andfluorescent
toners
arefor
positivefilm
only.For
machinetoning,
special
toners
have been developed
to
optimize mechanicaltoning
characteristics.^
It
may be
notedfrom
the
aboveliterature
that
film
based
proofing
systemsdiffer
from
toner
based
systemsprimarily in
terms
ofthe
materials usedto
transfer the
image
to the
base
stockand alsothe
processitself.
Film
based
systems useA
few
comparison studieshave
been
done
in
the
pastin
the
area of proofing.A
thesis
conductedby
Sandra
L
Fuhs,
in
1988,
atRIT
involved
astudy
ofthe
subjective
difference between
softcopy
andhard copy proofing
where an electronictest
pattern wasdisplayed
on a color monitor whilethe
sametest
patternin
hard copy form
wasdisplayed
underindustry
standard5000 degree
kelvin lighting.
Fifty
printing
industry
users ofthese
proofing
methods evaluatedthe two
proofsusing
visual assesment and completed a written questionaireindicating
their
acceptability
ofcolor,
detail
andsharpness,
design
andlayout,
size andportability
in
each ofthe
cases.In
general, the
fifty industry
decision
makers
found
the
soft-copy
proofto
be
acceptablefor
allthe
variableslisted
above when used as a
design
comp,
initial
color and/orintermediate
proofbut
rejected
it
in
all cases when used asthe
final
proof.Soft-copy
as atotal
replacementfor
hard-copy
proofing
wasfound
to
be
unacceptablebecause
the
majority
ofthose
polled statedthat
afinal
hard-copy
proof wasnecessary
in
allproduction stages.
The
savingsin
cost andtime
were not enoughto
offsettraditional
expectations ofquality, legal
proofing
responsibility,
predictability
andaccuracy
of size and color.(Wallace
Memorial
Library,
RIT).
Another
thesis
relevantto
proofing
was conductedby
William F
Breakstone
in
1990
atRIT
where a comparisonstudy
wasdone between
the
GCA/GATF
offpress proof comparator and
the
GATF
standard offset controlbar
for
identifying
when aCromalin
off press proofis
preparedto
specifications.This
thesis
wasconcerned with
the
accuracy
ofboth
proofing bars using
the
Dupont Cromalin
system
to
determine
whether one controlbar
wasbetter
for
judging
whether a proof was madecorrectly
to
SWOP
standards.The
experiment consisted of atotal
sample population offorty
expertsfrom four
different fields
in
the
graphicarts
industry. Each
participant was askedto
look
at samples of each colorbar
and choose which sample was made
to
SWOP
standards.The
results wereapplied
to
statistical methods of evaluationto
give afinal
result.The final
resultsOff-Press
Proof
Comparator
was notonly
moreaccurate,
but
also more versatilefor
all members ofthe
graphic arts community.(Wallace
Memorial
Library,
RIT).
Measurement
of color:Just
asthere
areinstruments
to
measure and unitsin
which
to
express physical propertieslike
length,
area, volume,
ormass,
so mustcolor
be
measured and expressedin
unitsthat
permit accuratedescription
andduplication
andthe
ability
to
record and communicateit
properly.A
densitometer is
a convenientinstrument for measuring
some attributes of colorbut
colorhas
a number of unique characteristics which cannotbe
adequately
specified or measured with a
densitometer.
Densitometers
are usefulmainly
for
comparing
colors withidentical
spectral characteristics.The
propermeasurement of color requires other
instruments. The
process ofmeasuring
color and
specifying
color matchesis
calledcolorimetry,
whichlike
color,
is
acomplicated science
involving
physics,
psychophysics and psychology.1^Communicating
color:One's
perception andinterpretation
of coloris
highly
subjective
and,
quiteoften,
very different from
someone else's.Eye
fatigue,
age,
and other physiological
factors
caninfluence
one's color perception.To
expressthe
color of anobject,
one person's response willvary from
another's.
Each
observer willinterpret
the
colorbased
on personal references.They'll
alsoverbally define
the
object's colordifferently.
As
a result,it's
difficult
to
objectively
communicate a particular colorto
someonewithout some
type
of standard ormutually
agreed uponway
ofexpressing
it.
Once
this
standardis
determined,
there
mustbe
away
to
compare one colorto
the
next with accuracy.The
solutionis
ameasuring instrument
that
explicitly identifies
a color.That
is,
it
Ways
to
measure color:Today,
the
mostcommonly
usedinsruments
for
measuring
color arespectrophotometers,
colorimeters,
anddensitometers.
While
allthree types
ofinstruments
measure reflected ortransmitted
light,
aspectrophotometer measures
light
atmany
points onthe
visual spectrum whichresults
in
a curve.A
colorimeter(tristimulus),
onthe
otherhand,
measureslight
muchlike
the
human
eyeusing
red, green,
andblue
receptors.A densitometer is
similarto
a colorimeter exceptthat
its
responses aredesigned
for
measuring
specific materials such asprinting
inks
and photographicdyes.
Attributes
of color:Each
colorhas it's
owndistinct
appearance,
based
onthree
elements:
Hue.
Value.
Chroma.
By describing
a colorusing
these
three
attributes,
you canaccurately
identify
a particular color anddistinguish it from
any
other.Hue:
When
askedto
identify
the
color of anobject,
you'll mostlikely
speakfirst
of
it's hue.
Quite
simply,
HUE is how
we perceive an object's color.Value:
The
second characteristic of colordescribes
it's luminous
intensity-that
is,
it's degree
of"lightness".
Colors
canbe
classified aslight
ordark
colors whencomparing
the
VALUE.
For
example,
whenplacing
atomato
and radishside-by-side
the
red ofthe tomato
appearsto
be
muchlighter. In
contrast, the
radishhas
a
darker
red valueChroma:
The
vividness ordullness
of a colordescribes its
CHROMA.
Again
comparing
the tomato
andradish, the
red ofthe tomato
is
much morevivid; the
radish appears
duller.
In
other words, chromaindicates
how
closethe
coloris
"saturation".
Expressing
colors numerically:CIELAB
andCIELUV
To
overcomethe
limitations
ofchromaciticity diagrams
like
x, y,
andu', v', the
CIE
recommendedtwo alternative,
uniform scales:CIE
1976
(L* a*b*)
orCIELAB
andthe
CIE
1976
(L* u*v*)
orCIELUV (pronounced
L-star,
a-star,
b-star
and
L-star,
u-star, v-star,
respectively).These
color scales arebased
onthe
opponent-colorstheory
of color visionthat
states: a color cannot
be
both
green and red atthe
sametime,
norblue
andyellow at
the
sametime.
As
aresult,
single values canbe
usedto
describe
the
red/green and
the
yellow/blue attributes.When
a coloris
expressedin
CIELAB,
L*
defines
lightness,
a*denotes
the
red/green value and b*
the
yellow/blue value.Similarly
in
CIELUV,
L*is
lightness,
u*is
red/green and v*is
yellow/blue.In
the
colorplotting
diagrams for
L* a*
b*,
the
a*axis runs
from left
to
right.A
color measurement movement
in
the
-adirection
depicts
a shifttoward green;
a+a movement
depicts
a shifttowards
red.Along
the
b*axis,
-b movementrepresents a shift
towards
blue;
+b shows a shifttowards
yellow.The
center L*axis shows
L=100 (white
ortotal
reflection)
atthe
top
andL=0 (black
ortotal
absorption)
atthe bottom.
At
the
center ofthis
planeis
neutral,
or gray.Delta CIELAB
andCIELUV:
Assesment
of coloris
morethan
a numericexpression.
Usually,
it's
an assesment ofthe
color match or colordifference
from
a
known
standard.CIELAB
andCIELUV
areintended
to
be
usedfor comparing
the
colors oftwo
objects.The
expressionfor
these
colordifferences
are AL* Aa*Ab*
andAL* Au*
Av*
(A
symbolizes"delta",
whichindicates difference).
Given
AL*Aa*be
stated as a singlevalue,
known
as AE*.11AE*
ab =
[(AL*2)
+(Aa*2)
+(Ab*2)]1/2
AE*UV
=[(AL*2)
+(Au*2)
+ (Av*2)]1/2The
question,
"How
much colordifference
is perceptually
acceptablein
colorprinting?",
is
often raised.The
following
table
gives anindication
ofthis;
AE
PERCEPTION
INTERPRETATION
<1
No difference
Excellent Match
1-2
Just
noticeableGood
Match
4-6
Noticeable
Fair Match
Chapter
3
The
Hypothesis
Introduction
The literature
reviewhas indicated
two
different
methods ofproofing,
namely
the
toner
based
method andthe
film based
method.As
mentionedearlier,
proofsmade
by
these two
methodsdiffer
mainly
in
terms
ofthe
materials usedto
transfer the
image
to
the
base
stock andthe
processitself. In
the toner
based
system a color proof
is
preparedby
exposing
alaminated
substratethrough the
separation
films,
andin
a subsequentstep,
applying
toners to the
image
areas,
either
manually,
orby
using
an automatictoning
machine.The film based
systems on
the
otherhand
use pre-manufacturedfilms
to transfer the
image
areas onto
the
base
stock.Research
Question
Do
proofs maderepeatedly
by
the two
methodsdiffer in
terms
of colorimetricconsistency?
Does
the
method ofapplying
toners to
make a proof makeany
difference
in
terms
of color variation as opposedto
using
standardmanufactured
film
emulsionsto
makethe
same proofsusing
the
same set offour
color separations?
These
questionslead
to the
following
nullhypothesis.
Hypothesis
There is
no significantdifference
between
atoner
based
proofing
method and afilm based proofing
methodin
terms
of color variation,(alpha
=0.05).
Limitations
assumed
to
be
controlled.2.
Materials
usedfor making
the
proofs are assumedto
be
consistentin
quality.These
include
transfer
films,
recieverbases,
base
stocks,
toners,
etc.Delimitations
1.
Only
oneset of separationfilms
is
being
usedfor
the
study.2.
Only
five
color patches arebeing
usedfor
colorimetric analysis ofthe
proofs.The
study
is limited
to these
colorsonly
anddoes
nottake
into
accountany
other colors which also couldbe
used.3.
The
scope ofthis
study is
limited
only
to the two
proofing
methodsin
question.This does
not extendto
various otherproofing
methodscurrently
available.
4.
Positive
films
willbe
usedfor
making
the
proofs.The
study
does
notinclude
Chapter
4
Methodology
1.
Materials:
1.1.
Test
target
withdifferent
color patches.1
.2.Four
positive separationfilms
ofthe test target.
1
.3.Developer
for film
based
system.1
.4.Toners
for
toner
based
system.1
.5.Transfer
films for film
based
system.1.6.
Base
stockfor
making
proofs(Commercial
stock was used).2.
Equipment:
2.1.
DS
608
Scanner
for
making
the
set of separationfilms.
2.2.
Exposure frames
for
exposing
purposes whilemaking
proofs.2.3.
Laminators
for both
methods.2.4.
Film
processorfor
developing
exposedfilms
in
film based
method.2.5.
Toning
Machine for
application oftoners
in
toner
based
method.2.6.
An
X-Rite
spectrodensitometer(938)
to
obtainL*,
a*,
b* readings.2.7.
X-Rite
Spectrostart
software program and printerfor
obtaining
hard
copy
ofdata
readfrom
the
spectrodensitometer.2.8.
Macintosh II CX
computer andExcel
software(Ver
3.0)
for
statisticalgraphs.
2.9. Minitab
software(Macintosh Accelerated Version
8.2)
for
obtaining
statistical
data.
3.
Experimental
Procedures:
3.1.
A
set ofC,M,Y,K
separations were generated onthe
DS
608
Scanner from
the
originaltest target.
3.2.
Thirty
proofs were made over severaldays
by
each ofthe
methodsin
least five hours
between
making
proofs.A
total
ofsixty
proofs weregenerated.
The
color sequence used wasMYCK,
bottom
to top.
The
same set of separationfilms
was usedfor making
proofsby
both
methods.
Temperature
andhumidity
readings weretaken
eachtime
the
proofswere made.There
was not much variationin
these
readings.
3.3.
L*,
a*,
b* andAE
readings weretaken
from five different
colorpatches on each proof.
The
colors chosen wereCyan,
Magenta
Yellow,
Red
andFlesh Tone. A
random samplefrom
withinthe
thirty
proofs of each set was used as a reference
for
calculating
AE
for
each color.
(Appendix
A).
Data
analysis methods used:In
practice, the
personconducting
the
hypothesis
testing
specifiesthe
maximumallowable
probability
ofmaking
aType
I
error,
calledthe
level
of significancefor
the test.
Common
choicesfor
the
level
of significance are .05 and .01.If
the
probability
ofmaking
atype
I
erroris
controlledby
selecting
alow
valuefor
the
level
ofsignificance,
wehave
ahigh degree
of confidencethat the
decision
to
reject
the
nullhypothesis is
correct.In
such cases wehave
statistical supportto
conclude
that the
nullhypothesis
is false
andthe
alternatehypothesis is
true.
Any
action suggestedby
the
alternatehypothesis is
appropriate.12Thet-test:
is
a statisticalinference
test
usedfor hypothesis
testing
in
the
case ofsmall sample sizes
(a
sample size greaterthan
thirty
orhigher
being
consideredlarger).
The
t-distributionis
actually
afamily
of similarprobability distributions.
Each
specific t-distributiondepends
upon a parameterknown
asits degrees
offreedom. There is
a unique t-distribution with onedegrees
offreedom;
a uniquet-distribution with
two
degrees
offreedom;
a uniquet-distribution
withthree
degrees
offreedom
and so on.The
criticalt-value,
for
a givenlevel
ofconfidence and particular
degrees
offreedom,
for
testing
ahypothesis is
Statististics
Concepts
andApplications,
p
323).
The
calculatedt-valuesior
testing
ahypothesis
canbe
obtaineddirectly
from
software programslike
Minitab Ver 8.2. A
comparisonis done
between
the
calculatedt-values
andthe
critical
t-values to
either accept or rejectthe
nullhypothesis.
For
the
purpose ofthis study, the
nullhypothesis may be
statedin
the
form,
0.
U-fj|m based system(color)=
M-toner
based system(color)where u.
indicates
the
mean ofthe AE
values ofthe
samples usedfor
a specifiedcolor and method of proofing.
The
nullhypothesis
stated above reflects asituation where
the
meanAE
value of proofs madeby
the
film based
method willequal
the
meanAE
value of proofs madeby
the toner
based
method,
in
whichcase
the two
systems wouldbe
consideredthe
samein
terms
ofconsistency
ofAE
values.If
the
nullhypothesis
is
rejected, then
we assumethat there
is
nocorrelation
between the two means,
in
other wordsthere
is
a significantdifference in consistency
between the two
methodsin
terms
ofAE.
The
key
to
establishing
adecision
ruleis
to
specify
the
allowableprobability
ofmaking
atype
I
error.That
is,
underthe
assumptionthat the
nullhypothesis
is
true,
the designer
ofthe
hypothesis
test
mustspecify
an allowableprobability
ofmaking
an error ofincorrectly
rejecting
the
nullhypothesis.
This
probability
oftype
I
error,
denoted
by
alpha,
is
referredto
asthe level
of significancefor
the
test.
In
a two-tailedt-test
(which
was usedfor
this study),
a0.05
alphalevel
indicates
that
95%
ofthe
t-values correspondto
an"accept
H0
"decision
in
the
distribution.
Thus
the test
is
being
designed
with a0.05
probability
ofmaking
atype
1
error,
andthe desired level
of significance of alpha =0.05
is
being
satisfied.
Whenever
ahypothesis test
has
rejection regionsin both
tails
of adistribution,
the hypothesis test
is
referredto
as atwo
tailed t-test.
Regardless
oft-test
has
a rejectionregion,
orprobability
of alpha/2.13
3.4.
AE
readings of each color patchfor
both
methods were usedto
obtain
the
calculatedt-values
using Minitab
software,
version8.2.
(Appendix B).
3.5.
Line
graphs were generated(visual analysis) for
L*,
a*,
b* andAE
readings of each color set
for
the toner
system(Appendix
C)
andthe
film
based
system(Appendix D).
3.6.
A
two-sample t-test
was usedto
test the
hypothesis for
the
five
different
colorsby
comparing
the
calculatedt-values
withthe
criticalt-value,
the
latter
of which was obtainedfrom
the t-distribution tables.
3.7.
An
additionalhypothesis
test
wasdone using
the
F distribution
Chapter
5
Results
andConclusions
The
originalhypothesis
was stated as"There is
no significantdifference
between
atoner
based
proofing
method and afilm based
proofing
methodin
terms
of color variation,(alpha
=0.05).
This
wastested
for
each ofthe
five
colorsunder
study,
namely,
Cyan, Magenta, Yellow, Flesh-Tone,
andRed.
A
two-sample
t-test
was carried outby
using
the AE
valuesfor
each ofthe colors,
and acomparison made
between
the two
methods.A
generaldescription
of at-test
analysis
is
givenin
chapter4
ofthis
thesis.
The
total
sample size was29
for
this
study.The
referencefor
calculating
the AE
values
for
each ofthe
colors was pickedfrom
withinthe
thirty
samplestaken
in
each group.
A
total
offive hypotheses
weretested
because
there
werefive
color patchesunder study.
Mean
AE
(Ton)
Mean
AE
(Film)
Calculated
"t"value
cyan
1.643
2.248
_3.23magenta
1.441
1.333
0.74
yellow
2.06
0.84
1.65
flesh
1.228
0.601
5.62
red
1.21
1.286
These
calculatedt-values
are comparedto the
criticalt-value to test
each ofthe
t-distribution table
availablein
most statisticsbooks
(Anderson, Sweeney,
andWilliams,
Statistics
Concepts
andApplications.
p323).The
givenlevels
ofconfidence and
degrees
offreedom have
to
be
taken
into
consideration whileobtaining
this
valuefrom
the t-distribution table.
With 28
degrees
offreedom (total
sample size =29),
from
the
t-distributiontables,
the
criticalt-value
for
this test
wasfound
to
be 2.005. In
symbolicterms
1
05
=2.005
The
subscript0.05 indicates
the
level
of confidence chosen.For
the
Cyan
patchthe
calculatedt-value
wasfound
to
be
-3.23.The
nullhypothesis for
cyan patchmay
be indicated
asfollows:
"0"
M-film(cyan)
=M-toner(cyan)
However,
the
criticalt-value
as mentioned earlieris
2.005.
In
other wordsthe
null
hypothesis
wouldhave been
acceptedif
the
calculatedt-value
fell between
+/-2.005,
since a two-tailedt-test
is
being
usedfor
this
study.However,
the
calculated
t-value
does
notfall
withinthe
range.Hence
we can concludethat
the
nullhypothesis
shouldbe
rejected.Which
meansthere
is
a significantdifference in consistency in
terms
of meanAE
valuesbetween
the two
methodsof
proofing for
Cyan.
Applying
the
same analysisto the
othercolors, the
second nullhypothesis for
the
Magenta
patchmay
be
stated asHQ
:Uf
i)m
(magenta)
=honer
(magenta).The
calculatedt-value
for
the
magenta patch wasfound
to
be
0.74.
In
this
caseit
is found
that the
calculatedt-value
falls
withinthe
range ofthe
criticalt-values.
difference
in terms
of meanAE
valuesfor
the
magenta patchbetween
the two
methodsof proofing.
That
is,
both the
methods arecolorimetrically
behaving
the
same
in
case ofthe
Magenta
color with respectto
proofs madeby
the
respectivemethods.
Similarly,
for
the
Yellow
patchthe
nullhypothesis
H0
:u.film
(yenow)
=^oner
(yeiiow)
is
accepted asthe
calculatedt-value
1.65
falls
withinthe
range ofthe
criticalvalues +/-2.005.
Hence
this
implies
that there
is
nodifference
in
terms
of colorconsistency
between
the
film
based
method ofproofing
andthe toner
based
method of
proofing
in
terms
of meanAE
valuesfor
the
yellow patch.For
the
Flesh
patchhowever,
the
nullhypothesis H0:
msim(fiesh)
=^
toner(fiesh)
is
again rejected as
the
calculatedt-value
in
this
case wasfound
to
be
5.62
whichdoes
notfall
withinthe
range ofthe
criticalt-values.
This
meansthat there
is
asignificant
difference
in
terms
of colorconsistency
in
terms
of meanAE
valuesbetween
the two
methods whenconsidering
the
flesh
color.Finally,
for
the
red patchthe
nullhypothesis
H0:
miim(red)
=Mioner(red)
is
acceptedagain as
the
calculatedt-value
for
the
redpatch,
-0.17,falls
between
the
rangeof +/-
2.005
which arethe
critical t-values.There
is
no significantdifference in
terms
of meanAE
valuesfor
the
red patchbetween the two
methods of proofing.It may
be
summarizedfrom
the
above analysisthat
from
the
five
color patcheschosen
for
the study, the two
methods ofproofing
in
question werereproducing
proofs without much
difference in
variationin
terms
ofAE
in
case ofthe
magenta,
yellow, andthe
red patches.In
otherwords, the
colorimetricdifference
between
proofs made onthe
tonerbased
system was closeto the
colorimetricdifference
between
proofs made onthe
film
based
systemfor
these three
colors.There
washowever
a significant colorimetricdifference between
proofs madeon
the toner
system as comparedto
proofs made onthe
film based
systemfor
It may be
seenfrom
appendixB1
that the
yellow patch shows ahigh
meanAE
value of
2.06.
However,
this
is due
to
ahigh
AE
valuefor
sample16
which mightbe
an errorin
the
reading
taken
or couldhave
arisenfor
some other reason.However,
if
this
particular sampleis
ignored
andthe
average of allthe
remaining
28
samples aretaken,
a meanAE
value of1.39 is
obtainedfor
the
yellow
toner
patch whichis
a more accuratevalue.A
similar correction couldalso
be
madefor
the
red patch where aAE
value of12.48
is
seenfor
sample16
again.
If
this
sampleis ignored
again,
an averageAE
value of0.80
is
obtainedfor
the
redtoner
patch.A
consolidatedtable
ofthe
raw meanAE
valuesfor
the two
systems withthe
corrected values
is
shownbelow
:MEAN
AE
VALUES
TONER
FILM
Which
performedbetter
CYAN
1.64
2.25
Toner
MAGENTA
1.44
1.33
Film
YELLOW
1.39
0.84
Film
FLESH
1.23
0.60
Film
RED
0.80
1.29
Toner
From
the
abovetable, it may be
interpreted
that
for
the
purpose ofthis
experiment
the
film based
system performedbetter
than the toner
based
systemand proved
to
have less
colorimetric variation onthe
whole ascomparedto the
toner
based
system.However,
it
may be
reinforcedthat this
experiment waslimited
to
five
color patchesonly
andto
arrive at a more positiveconclusion,
carried out.
From the
graphsin
appendixC
and appendixD,
it may be
seenthat the
film
based
system exhibited ahigher
L* orlightness
valuein
case of allthe
colors.Visually,
the
proofs madeby
this
method were muchlighter in
color ascompared
to
proofs madeby
the toner
based
system.The
toners
usedfor
making
the
proofsmay be
having
a richer anddarker
hue
as comparedto the
films,
resulting
in
the
difference
in
lightness
value.This is
a relevant pointto
notewhen
evaluating
proofs madeby
these
two
methods.Considering
the
a*b*values
for
the
five
colorstested,
the
following
indications
can
be
observedfor
each ofthe colors;
Cyan:
a*graphs
indicate
a greater shifttowards
greenfor
the
film based
systemas compared
to
the toner
based
system whereasthe
b*values are quite closeto
each other.
The
AE
values are muchhigher in
amajority
ofthe
film based
samples as compared
to the toner
based
samples.Magenta:
In
this case, the
sample valuesin both
cases are quite closeto
eachother
in
the
case ofboth
the
a*values as well as
the
b* values.There is
notmuch
difference in
the trend
ofthe AE
values also.Yellow:
This
seemedto
be
the
most stable of allthe
colors asindicated
by
the
L*a*b*
graphs
for
both
the
systems.In
the AE
graphfor
the toner
based
systemone value of
20.71
is
found
out ofrange,
which mighthave been
causeddue
to
some experimental error.
However,
if
this
is ignored
the trend
in both
systemsfor
the
yellowpatch seemto
be very
stable and closeto
each other.Flesh:
As
the
graphsindicate,
this
has
the
greatest variationboth
within eachsystem and
between both
systemsin
terms
ofthe
L*a*b*
values as well as
the
Red: The
trends
in
the
red patch values also are quite stable across eachsystem,
exceptfor
the AE
values of12.48
and4.25
in
the toner
andfilm based
systems
respectively
whichmay
againbe due
to
experimental errors.An
additionalhypothesis
test
based
on an"F
distribution" was carried outto
compare
the
variances ofthe two
populations representedby
the
film
andtoner
based
systems.Whenever
independent
simple random samples of sizes n1 andn2 are selected
from normally distributed
populations with equalvariances, the
ratio F=si2/s22
has
anF distribution
with n1-1degrees
offreedom for
the
numerator and n2-1
degrees
offreedom for
the
denominator,
where si2is
the
sample variance
for
the
random sample of n1items from
population1
and S22is
the
sample variancefor
the
random sample of n2items from
population2.
Hypothesis
tests
aboutthe
variances ofthe two
populations arebased
onthe
calculated
F
value of si2/s22-The
rejection ruleis based
onthe
F
valuein
amanner similar
to
how
the t
valueshave been
usedin
the
previoushypothesis
testing
procedure.The
nullhypothesis
in
this
caseis
statedin
the
form
H0:O~
(toner)
= a~(film)
The
F
distribution
value with n1-1=28degrees
offreedom
and n2-1=28degrees
of
freedom
wasfound
to
be 2.10 from
the
F
025
distribution
table
(Anderson.
Sweeney,
andWilliams.
p672).This is
the
upperlimit. The
lower
limit is
obtained
from
the
inverse
relationship
ofF
025. whichis
0.476.
Thus
the
rejection rulefor
the hypothesis test
is,
rejectH0
if
F(calculated)
<0.476
orif
F(calculated)
>2.10
based
systemsrespectively
and alsothe
calculatedF
valuesfor
each ofthe
colors
tested.
s1(toner)
s2(film)
F
= s12/s22cyan
0.488
0.883
0.305
magenta
0.676
0.419
2.60
yellow
3.70
1.58
5.48
flesh
0.50
0.334
2.24
red
2.19
0.911
5.79
It may
be
observedthat the
calculatedF
valuesfor
allfive
color patches areeither
less
than
0.476
or greaterthan
2.10.
Hence,
the
hypothesis
H0
is
rejectedin
all cases.It
may be
inferred from
this that the two
systems ofproofing
differ
significantly
in
terms
ofAE
variancefor
allfive
colorstested.
This
however
should not notbe
confused withthe t-test
wherethe
meanAE
Bibliography
1. Michael
Bruno,
Principles
of colorproofing
(Salem:
GAMA
Communications,
1986),
p.1.2.
Ed
Rodier,
Color Proofing:
Will
the
press sheet matchthe
proof(RIT/TAGA
Technical
Journal,
1988-89),
p.29.3.
Dr R.K.
Molla. Electronic Color Separation (Montgomery:
R.K
Printing
andPublishing
Company,
1988),
p.246.4.
Miles
Southworth,
Color Separation Techniques,
third
edition(Livonia:
Graphic
Arts
Publishing, 1989),
pp
7-8,
7-9.
5.
Ed
Rodier,
Color
Proofin