Rochester Institute of Technology
RIT Scholar Works
Theses
Thesis/Dissertation Collections
1999
Performance study of the 1911 Wright Brothers
model B aircraft and propeller
Robert Egenolf
Follow this and additional works at:
http://scholarworks.rit.edu/theses
This Thesis is brought to you for free and open access by the Thesis/Dissertation Collections at RIT Scholar Works. It has been accepted for inclusion
Recommended Citation
PERFORMANCE STUDY OF THE 1911 WRIGHT BROTHERS
MODEL B AIRCRAFT AND PROPELLER
Robert Egenolf
Mechanical Engineering Department
Rochester Institute of Technology
Rochester, New York
A Thesis Submitted in
Partial Fulfillment of the
Requirements for the
Degree of
MASTER OF SCIENCE
In
Mechanical Engineering
Approved by: Professor
_
Kevin Kochesberger, Thesis Advisor
Professor
_
Dr Alan Nye, Professor
Professor
_
Dr. Ali Ogut, Professor
Professor
_
PERMISSION
TOREPRODUCEThesis Title.
PERFORMANCE
STUDYOF THE 1911 WRIGHT BROTHERSMODELBAIRCRAFTAND PROPELLER
I,
RobertEgenolf,
hereby
grant permissionto theWallace MemorialLibrary
oftheRochesterInstituteof
Technology
toreproducemythesisinwholeor part.Any
reproduction can notbe usedforcommercial use or profit.
FORWARD
Iwouldliketo take thisopportunityto thank thepeople whohave helpedme
throughout mycollege career andin reaching mygoal ofgraduation.
To my advisor,Kevin
Kochesberger,
Iwouldliketoextendmythanksinthe timeand efforthe putforward
helping
me conceivethisproject andbring
ittofruition. Iwould alsoliketo thankhim fortheplane ridesdownto thewindtunnelat
Langley,
Virginia.
To Ken
Blackburn,
Iwouldliketoextendmygratitude andthanksforall ofhishelp
withsortingouttheinputs forthe softwareprogramand all ofhisadviceregardingthis thesis.Withouthistremendous effort,Iwouldstillbe inthedarkonmanyofthese
issues.
To my
family, Joyce, Bruce,
andEric,
Iwouldliketoextendmygratitudefortheirconstantsupportthroughoutmyeducation,hereatRITand evenbeforehand. Icould
nothaveaccomplishedmygoals withouttheirencouragementand confidencein my
ABSTRACT
Aperformance evaluation ofthe 1911 WrightBrothers Model B aircraftand
propelleristobepresented.
Background,
contemporaryaviationhistory,
andtheWrightanalysis will precedetheevaluationinordertorecreatethesituation inwhichthe
Brotherswere operating.
Following
thisbriefhistory,
theories regardingpropellers willbeexaminedinordertounderstandbetteranefficiencyevaluation.
Finally, theoretically
generateddatawillbecomparedto theknownvaluesatthetimeoftheModel B's flight.
Theoretical datawillbegatheredfromtwosources;
(1)
a software programdedicatedto theefficiencypredictionofpropellers,and
(2)
adrag
studyconductedontheModel B aircraftitself. The inputs forthe software programwillbe discussedaswellas
theprocedurefor operatingthe software.Outputswillinclude graphs,specifically
efficiencyandavailablepoweratcertainspeeds.
Following
thischapterwillbeadrag
studyoftheModel B aircraft, which willincorporatethesoftware graphs and producethe
aircraft's cruise speedandclimbrate.Afinalchapter will discusstheseresults and
recommendfurtheravenues of study.
Finalresults ofthe performanceevaluation ofthe 1911 Wright Model B aircraft
haveshownrelativelyclosecorrelationtotheoriginal numbers measured and calculated
by
theWright Brothersthemselves. Cruisespeed and overallefficiencyas predictedby
TABLE OF
CONTENTS
PagesI. GreekLetters 7
II. Dimensionless Parameters 7
III. Variables 7-8
IV. ListofTables 9
V. ListofGraphs 9
VI. ListofFigures 9-10
Chapter 1- Introduction
1.1
Contemporary History
11-121.2 Background 12-13
1.3 Wright Brothers ExperimentsandAnalysisofthePropeller 14-18
1.4Objective 21-22
Chapter 2- Propeller
Theory
2.1 Simplified Momentum
Theory
23-282.2 Blade Element
Theory
28-34Chapter 3- PropellerSoftware Program InputsandResults
3.1 Propeller Software Background 35-39
3.2 Selected Inputs forthePropellerProgram 41-43 3.3 Output Results fromtheSoftware Program 44-49 Chapter4- Performance EvaluationoftheWright Model B Aircraft
4.1
Drag
Analysis ProcedureoftheWright Model B 50-55 4.2Drag Study
NumericalAnalysisandResults 56-65Chapter 5- DiscussionofResults
6.1 Climb SpeedandClimbRate 66
6.2 Performanceat
CL
Max 666.3 Cruise Speed 66
6.4 Propeller Performance 66-67
Chapter6- ConclusionsandRecommendations
6.1 Conclusions 68-70
6.2Recommendations 70-72
VII. References 73-74
I. Greek
Letters:
Q : angularvelocity
p:
density
r\ : efficiency
-: pi
u. : axialvelocity
a : angle ofincidence
O :blade angle
cj) :bladeangle
-angleofincidence
y:effect of profile
drag
ofthebladeII.Dimensionless Parameters:
J : advanced ratio of a propeller
III.Variables:
V: freestream velocity
v : incrementalvelocity
pA : initialpressure
p'
: incrementalpressure
HA
:initial head flowA: area
E :energy
T: torque
Ta
: torqueavailablePa
:power availabler : radius
a'
: rotational interference flow
Cd
: coefficient ofdrag
Cl
: coefficient ofliftM : resultantvelocity
c : chord oftheairfoil shape
s : solidityofblade
N :number ofblades
n :
frequency
L:thrust(Wright Brothers
Theory)
K: airpressurecoefficient
SWing
: totalwingareaS :reference area
A=AR : geometric aspect ratio
Ai :effective aspectratio
e : correctionfactor
b : wingspan
h : height betweenwingson abi-plane
W : weight
Q
: torqueCT
:coefficientofthrustIV. ListofTables: page
Table 1 :TableofSoftware Inputs 42
Table 2 :Flyer
Drag
Coefficients
60Table3 : B
Drag
Coefficients
61Table 4: B
Velocity/Drag
Force 63Table5 :B PowerRequired 64
V.ListofGraphs
Graph 1 :
Efficiency
vs. Speed 44Graph 2 : HPvs. Speed 45
Graph 3 :
Efficiency
vs. Advanced Ratio 46Graph 4: Thrustvs. Speed 47
Graph 5 :
Cp
vs. Advanced Ratio 48Graph 6 :Ct vs.Advanced Ratio 49
Graph 7 : Flyer CLvs.
Cd (induced)
59Graph 8 :B
CL
vs.Cd (induced)
59Graph 9 :Flyer
CL
vs.Cd (induced/total)
60Graph 10:B
CL
vs.Cd (induced/total)
62Graph 1 1 :Power Requiredvs. Power Available 65
VI. ListofFigures:
Figure 4 :Blade Element
Theory
Diagram 31Figure5 : Software Program Diagram 36
Chapter
1
:Introduction
1.1
Contemporary
History
Inordertounderstandthemagnitudeofthe accomplishmentthat theWright
Brothersset outto achieve,abrief descriptionofcontemporary
history
in aviation willbedivulgedtothe reader.Atthe timeofthe
Brothers,
no onehadyetdeterminedtheforcesin action on aerial propellers. Inmarinepropellers,mostknowledgewas empiricaland
needed experimentationtoreach perfection.
Transferring
marineknowledge intoaerialpropellerknowledgewouldbe impossibleand not reasonable.
Up
tothispointinaviation,propellers wereonlyabout40%efficient with someofthebetter designs andbettercraftworkreachingashighas55%. Thesenumbers might
seem
high,
buttheWright Brotherswishedto gohigherand surpasstheprevious designsand goals.
Settling
forwhat other peoplehadconstructed was unacceptableto theBrothers. Forexample, Santos-Dumont's Bird of
Prey,
required50 HPtobecomeairborne. This relatively highpower numberindicatedthat thepropellers musthave been
inefficientandtheplane wasprobablyoverweight.The goal oftheBrotherswastouse a
motorcapableofonly 8 HP Thistremendousdifference inrequirements exhibitsthe
ambition andengineeringskillpossessed
by
theBrothers.More horsepowerinstantly
meant alargerandbiggerengine.
This,
in turn,meantthat theplane wouldautomaticallygainin weightfromthemotor alone.Thepredicted weight oftheFlyer onlyallowedfora
smallmotor,light inweight.
Casting
processesoftheday
also preventedthelargermotorsfrom
losing
alotofweight.Propellershadtobe more efficientthanthosecentralhubwithout
taking
intoconsiderationthecurvatureoftheupper surface whichdictates theliftandinthe case of apropeller,the thrust.
Fortheirachievementinaviation,
including
theplane andthe propellers, theWrightBrothers were considered pioneers andinnovators intheirfield. Nowthat the
readerhas abetterunderstanding ofthetimeperiod,amorein depth lookattheWright
Brothers willbe
discussed,
asthey
arethe mainfocusofthisdocument.1.2Background
Intheearly 1900'sateamoftwobrotherswouldbethefirsttoachievethe
unreachable goal of sustainable poweredflight. OrvilleandWilbur Wrightwould
revolutionizethe
industry
with ahomemadeplane and onehistoric flightatKitty
Hawk.Butthis tremendousaccomplishment was not withoutits obstacles andtechnical
challengesthat
they
wouldencounteronmorethenoneoccasion,bothanticipated andunforeseen. The lastaspect oftheplanetobedesigned beforethe flightwasthe
propulsion system,
including
theengine/motoritselfandthemeansby
whichtheenginepower wouldbetransformedintothrustorforwardmovement. Bothofthesecomponents
would provetobethelargestobstaclesofthemall.
Ownersandoperators of abicycleshop,theWright Brothers had littletono
experienceintheengine
building
business.They
hadconstructed aone-cylinder enginetopowertheequipmentintheirshop butthatwastheextent oftheirexpertise. When
they
firstconsidered powerplantsfortheir plane,
they
contactedautomobile enginemanufacturersand gavethem their specifications,whichhadbeencalculated and checked
manufacturer atthe timecould meetthedemandsofthebrothersand;therefore, the
engine wouldhavetobeconstructedfromscratch andbepurpose-builtfromtheonset.
Luckily
one oftheir employees,CharlieTaylor,
hadabitmoreengine experienceandalmost single
handedly
builtthebrothersafourcylinder enginefortheir plane,andtotheirspecifications.
However,
oncethisproblem wasovercome,aseeminglypremature assumptionmade
by
thebrothers wouldturnintoarevolutionary ideaanddesigninthearea offlightpropulsion. Thepropellers requiredtotransformtheenergy atthe outputshaft ofthe
engineinto forwardmotionthrough theair wouldbereinvented,in everysense ofthe
word.Noonepriorto theWright Brothers hadunderstoodthedynamicsanddesignof
propellers.
"
Maxim/Langley
developed great motorsbutterribly
inefficientflat-bladedpropellers
"
Mostofthework completedinthisareaexistedonly inthearea of marinepropellersand
not airplane propellers.The brothers believed
they
couldjustsubstitute air pressureinplacewater pressureandachieve propeller performance predictions.Aquicklook into
thisassumption provedthis
theory
would notbeapplicableto theirsituation. Withallpreviouswork
being
entirelyempirical and nottheoretical,theWright Brotherswereforcedto
develop
theirown equations andcalculations inordertoconstructthecorrectpropellersonthefirstattempt(Notethat
they
didnothavethecapitaltorelyon the"cutand try"
methodemployed
by
othercontemporaryinventors.).With onlyone attempt attheir grasp, theircalculationshadtobecorrect andpredictingtheefficiencyofthe
1.3 WrightBrothers'
Experiments
andAnalysisofthe Propeller(Flyer)
Before completingtheirdesign fortheairfoilpropeller, theWrightBrothers
conducted various experiments to
help
themdetermineshapes, sizes,and speedsfortheirdesign.
Specifically
they
conductedfanscrew and propeller experimentsina scaled windtunnel
they
hadcustombuilt forthisspecific purpose.These,
alongwiththe analysis oftheireventual propeller willbeundertakeninthisportion ofthechapter.
Forthefirstoftheirexperiments,
they
employedfan bladesand a motor(themotor wasprobablytaken fromtheirbicycle shopwhere
they
usedittodrivesome oftheirpower equipment).
During
theseexperimentsthebrotherspaid close attentiontotheCenterof
Pressure,
which is defineddifferently
fromthemeaningassociated with ahorizontalwing. This
they
defined as ablade sectionlocated 5/6oftheradiusaway fromthehub. There
they
measuredor estimatedbladeangle,camber,rotationalvelocity, andangleofattack.
They
usedthesecrudebladestocreateearlymodels ofthepropellerbladesand
help
themvisualizehowthepropshouldfinally
appear. Thesewereonly earlyexperimentsand so
they
moved ontopropellersthateventually becamealotmoresophisticatedand alotcloserto theirultimategoal.
Thepropeller experimentsagain usedthesame motor asthefanscrew
experiments,mainly duetoafailureofthelargermotor.Thepropellers were similarin
lengthto thefanscrewbut differed in bladewidth andbladeangle.The Brothersaltered
these twovariablestogain thebestthrust/liftdesignthatwould suit theirneeds.
They
determinedthatasthelengthoftheblade
increased,
theblade sections nearthehubbecame.The Brothers developedanequationforthethrust/liftofthepropeller andit
appears as follows:
L
=KxVxSxCL
(D
whereLis thrust, A"
isan air pressurecoefficient, Vis thevelocity inmph,S isthetotal
blade area,andC/,is theliftcoefficient.
By
simply understanding thatliftforawingcorrespondstothrustforapropeller,theBrotherswere abletoapplythisequation
directly
to theirdesigns.Once
they
had finishedthese experiments,they
coulddeterminethecorrectpropellerfortheplane
they
werebuilding
basedon some assumptionsthey
hadmade attheonset oftheprojectregardingtheirFlyer.These included:
Planeweight=755lbs
Min velocity for flight=23 mph
Engine & propweight=200lbs
Total wingarea=500 ft2
They
above mentioneddesignrequirementsdictatedthepropeller'sdesignanditsperformanceaswell asthemotor and othernecessarycomponents. The Wright Brothers
keptnotebooksontheprogressionoftheirdesignandanalysisandthe
following
analysishas beenexcerpted from Wilbur'snotebook
H,
1902-1905.Efficiency,
asdefinedby
theWrights,
becamethefollowing
equation:___ . PowerOutput
(2)
Efficiency
=Knowing
this relationship,one candeterminethe inputby
multiplyingthe torqueandvelocityof rotationtoobtain:
40lb
xl2lft/
s=4,
S40ft
-lb/s
4,840
550=
S.13hp
This givesthefirstpart oftheefficiencyequation.Now
by
understandingthat thepoweroutputisproduct ofthethrustandforwardvelocity, the second portionbecomes:
90lbx24
mi/
'hr
=2,160/m-Ib/hr
2,160
375
=
5J6hp
where 375mi-lb/hris equaltoonehorsepower. Oncetwoout ofthreevariables have
been
determined,
the efficiencyequation cannowbeusedtodeterminetheperformanceofthepropeller asfollows:
__, . PowerOut 5.76
n ,,
Efficiency
= = x1 00=66% Powerln 8.73Thiswasthe theoretical number associated withthepropellers used onthe
Brothers'
Flyer.
According
tocalculationsthey
hadsurpassedtheachievements of pastaviatorsandbroughtthepropellerintoanewera.Theiranalysis would serve asthebasis
for
designing
propellers for decadestofollow. Neverbefore inaviationhadsuch anundertakingbeen acceptedandthenovercome. The Brothers hadthelastpiece fortheir
year. Someothercritical numbers associatedwiththepropellers oftheFlyer
andtheB
were asfollows:
Flyer Data
Speedof machine=23mph
Grossspeed(forward velocityofproprelative to theair)=44 ft/s
Thrust=90 lbs
Areaofblades=5.4 sq ft
RPM=330
SpeedofCenterofPressure (locatedat5/6ofthe totalradius)= 121 ft/s
Angleofincidence=7
deg
Normalpressure=25.3 lbs
Weight :755 lbs (withonepilot)
Wing
area:500ft21911 Model B Data
Speedof machine :40mph
Grossspeed: 58.6 ft/s
Weight: 1250 lbs (withtwopilots)
Wing
area : 472ft2RPM :428
where gross speedisthe freestream velocitywithouttheadded"suck"velocityand90lbs
ofthrustistheestimated
drag
oftheFlyer accordingtotheBrothers.Along
withthesenumberswere also quite afew tables, graphs,anddiagrams fromwhichtheBrothers
propeller
design,
inanengineeringsense ofthe word. The figures (1 and2)
onthe-L..A_i...L.,
\
i
./,LU.-._/
. I--1 a sy 1 i i f1 I1
, ^*i_ II "^Vi 1 >_______!$ l i i i \
n
r-#v\i j _/
1
^
--f-h. . -.-__
09
-. pa CO .
"
-8I
I
_. On
5
~z o
CN
U
00
1.4 Objective
Nowthatthebackground forthestudy has been
documented,
the main purpose ofthestudywillbediscussed. Theoverall objective ofthisstudywastoemploycurrent
techniques of propellerdesignandefficiencycalculationin ordertopredicttheefficiency
ofthepropeller used ontheWright Model Baswell asthecruise speed oftheplanein flight. Thisprediction wouldbecarried outinanumberof variousways,bothwith a
computertool andanalytically inordertocapture arangeof sources andtechniques.
The firstofthesemethods wastoemploya propeller performance software
packagein
determining
theoverallefficiency and poweroftheWright Brothers design.Having
propellerdrawings available wouldallowdatatobe inputteddirectly
intothesoftware. Oncethisis complete, thesoftware program wouldbeabletorunthroughits
calculations andsimulationsand output sixperformance graphs(canbe seeninthe
ResultsandConclusionssection)
Thesecondmethod ofanalyzingperformancewouldbetoconduct a
drag
studyofthe overallplane anduseavailable equationsto transform
drag
numbersintoanoveralldrag
force. Thedrag
forcewouldthenbe plottedintheformof power required againstpower available.Fromthe thrust numbers,powercanbe derivedandthiscanbeusedto
directly
determinetheperformanceand cruise speed ofthe aircraft,including
maxlevelThethirdsource ofdatawouldbetheWright Brothers themselves.
They
conducted an extensive analysis priortoconstructingtheFlyerandthepropeller
efficiencywas a critical part ofthis analysis.Theremethodofanalysisandresulting
numbers willbeused as a comparisontothe two aforementioned methods.
Following
datacollection, theefficiencyand powernumbers were compiledandcomparedtothenumber obtained
by
theWright Brothersatthetime theFlyer B wasChapter
2
:Propeller
Theory
In orderto better understand how the efficiency of a propeller is
determined,
a morein depthexplanation ofthe employed theories will nowbe given. The first two theories are used in
determining
the ideal efficiency of a propeller. This explanation is necessarytounderstandhowthesoftware program operatesinthenext chapter.
2.1 SimplifiedMomentum
Theory
(Rankine andFroude)
Asevidencedin thenamealone,this
theory
of airscrewsdependson a consideration ofthemomentum aswellasthekinetic energyofthe systembeing
studied. Before goingin depth intoadetailedanalysis ofthis
theory however,
it is necessarytostatetheassumptions attachedto the theory.
Assumptions:
1. the airscrewisconsideredtobe adisc
(spinning
inthe air) 2. thegeneratedthrustis distributed evenlyoverthedisc3. anyrotationoftheslipstreamdueto theaction ofthe torque isignored
Nowthat the assumptionshave been categorically
described,
thetheory
canthenbesetforth. Asthe fluidpassesthrough the
disc,
anincrementalpressureis added whichis equalto the thrustper unit area ofthedisc. Thiscanbeseenin Figure 3 onthe
following
page.Anothereffect ofthe disc istoformaslipstreamofincreasedaxialvelocitybehindthedisc. The fluid flow frompointAtopointB isregarded as
irrotational,
aspreviously statedinthe assumptionsassociatedwiththis theory.Oncetheseideas have beenestablished, it isnow properto apply Bernoulli's Equationtothe
fluid flow. Bernoulli's Equationappliedto thediagrammed fluid flowyields anequation
for dynamicpressure as follows:
nA=pA+y2pv2=p+y2p{v+v)2
(3)
where V isthefreestream velocityandvistheincremental velocityadded oncethe
stream passesthroughtheairscrew.p0istheinitialpressurebefore
being
effectedby
theairscrewandp isthepressurejustpriortopassingthrough thescrew.
Further,
afterpassingthroughthe prop,H
=P,+/2P(V+\f
=P+P+/2P(V+vf
(4)
where p'
istheincrementalpressureadded
by
theairscrew.And,
Ap-HB-HA_p(v+
^/vB)vB
(5)
By
consideringthisAp,
thethrust,T,
thenbecomesthefollowing
withA=area ofthedisc. This isalso anexpression fortherateof changeinaxial momentum:
T
=A/7(V
+Figure3
[image:25.538.30.509.139.460.2]Andthisindicatesthathalfofthe addedvelocityoccursbeforetheairscrew andhalfofit
afterthe airscrew.
Therefore
equation(6)
canberewrittentaking
thisintoconsideration,T
=2Ap(V
+ v)v(7)
HereVcanbeconsideredthefreestreamvelocityor grossvelocity and v canbe takenas
the"suck"velocityorthevelocityadded
by
theairscrew.Anexamination ofthekineticenergyofthesystemreveals anincreaseovertime
inthefluidsystemcorrespondingto the
following
equations:E^A^V+v^V+vJ-V2)
(8)
Whichreducesto
E=2Ap(V+v)2v
(9)
Whichyieldsthe
following
afterusingequation(7)
E_T(V+v)=QQ
(10)
whereQ isequated toangularvelocityoftheairscrew
(27if)
andQ
isthetorqueoftheairscrew.Nowthisexpression canbeusedtodefine the totalworkdoneonthefluid
by
the thrust.Oncetheactual andidealwork areboth
known,
an expressionfortheefficiencyofthe system canbewritten asfollows:
TV
n=^Q
<>
and wherethe total workdoneis
nQ
=T(V
+And if
y=aV
(13)
where ahereisusedtosymbolizea multiplier
Thentheideal efficiency isthensaidtobe:
V V 1
rj= = =
V+ v V+ aV 1+ a
(14)
By
constructingthisequationtheassumptionismadethat theonly loss inthesystemis dueto thekinetic energyofthe axialvelocity intheslipstream.Butthereare
otherlosses inthe system,which areignored inthis
theory
aslisted below.a) nofriction
drag
ofthebladesb)
nokinetic energy loss intherotationoftheslipstreamc) noloss ofthrust towardsthebladetips
Themostinfluential ofthelistedlosseswouldbe
(a)
becausethereexists alarge amountoffrictionalloss here
depending
onthebladesurfacematerial. Fora quick anddirty
estimate oftheefficiencyof apropeller, one can predictwithsomecertaintythat the
actualefficiencywillbealmost85% thatoftheideal efficiency
(#4,
H.Glauert)
fromtheaboveequation, whichindicatesthatastudyoftheideal efficiency isa good guideto
determining
actual efficiency.Anotherversionoftheefficiencyequationinvolving
power, speed,andthe airscrewdiametercanbe derivedwhen one considers power output
versus powerinputtoapropeller,withthefinalresult
being
thefollowing
1-7
2Prj npND
Itcanbe deduced fromthisequationthatthe
efficiency falls quicklyasthepower
coefficient
increases,
such asattemptingtoput alotof powerthrougharelativelysmallpropeller.
2.2 Blade Element
Theory
(ExtensionofMomentumTheory)
Asa continuation ofthesimplified momentumtheory,thebladeelement
theory
providesfora moredetailedanalysis ofthepropeller
by
exploringtheforcesexperiencedby
theairscrewblade. Aswiththemomentumtheory,thereare several assumptions madeby
thistheory
inordertoconduct an analysis andthey
are asfollows:1. Therotationalvelocityofthe tipsoftheblade doesnot approachthe
speedofsound.
2. The blade isplacedinauniform streamofvelocity Vparallelto the
axis ofrotation.
Thereexistalso someterms thatneedtobedefined inorderforafullexplanationto
becomeuseful in
helping
oneanalyze a propeller.Inflow- Flow
immediately
in frontofscrewOutflow- Flow
immediately
behindthescrewWake- Flow inslipstreamfar behindthe screw
Interference Flow
-Velocity
fieldof system oftrailing
vortices which acts as aninterference ontheblade elements
Nowthatsomeimportanttermshave been defined forthe reader, a morein depthlookat
theactivity surroundingapropellerblade canbe discussed. Inthis theory,asinthe
timeitissubjecttointerference flowrepresented
by
helicalvorticescreatedby
tip
androotblade elements. (Inthis case, theexact effect ofthevorticesis difficulttoanalyze
andthemean valueisgenerallysubstituted.)
To begintheanalysis,thetorqueofthe airscrew mustbeexaminedand
understoodtocreate rotation abouttheaxis offlow intheslipstream. Notethatthis
rotationdoesnot occurinfrontoftheairscrew or outsidethe
boundary
layer. Thisrotationthen transformsintovortices and circulation aroundtheblades. Dueto the
trailing
vortices,theflow intheplane ofthe screwwillhavean angularvelocity inthesame sense astherotation ofthescrew. Thecirculation aroundthe screwbladeswill
cause equal and opposite angularvelocities oftheinflowandoutflow.Oncethe flow
motionis understood, theangular momentum oftheoutflow can beexaminedandknown
tobe closelyrelatedto the torqueofthe screw.
Consider bladeelementdrat radialdistancerintheFigure 4. Fromthis figurethe
following
variables andequationscanbe derived. Equation(16)
showsthattheaccelerationoftheflow inthe directionofthebladetravelresultsintorque.Equation
(17)
isthentheincrementalthrustforanelementalongthepropellerblade.
dQ
=torque of this elementu=axial velocity thru the airscrew annulus
torque=rate of increase of angular momentum
dQ
=2-xp
u-2--r2dr
(16)
^
=4-r> VQ(l+
a)a'
(17)
andais theaxialinterferenceflowwhile afistherotationalinterference flow.
Theaxialvelocity isconsideredtobecontinuousthrough theairscrew and ubecomes the
axialvelocityattheinflowand outflow. In estimatingtheaxialinterference flow
magnitude one importantassumption mustbe made:the
trailing
vortices movein helices.Theinterference flowexperienced
by
thebladesatdistancerfrom theaxisdoesn't dependonbladeelements at otherdistances. Forthisstatementtobe true,
considerthebladeelementdratrfromthecenter whentheremainderoftheairscrewis
not present. The
trailing
vortices which spring fromtheends oftheelementlieon thesurfaces ofthe twocircular cylinders of radius randr+dr. The vorticity isresolvedinto
twoparts:
1. Axis paralleltothescrew axis
2. Circumferential
The firstoftheseparts acts as a
bearing
betweentherollingshell of airboundedby
thecylindrical surfacesandthe generalair.Thistranslates intothe factthat thegeneral mass
of aircannot acquire circulationabouttheaxis andhencetherotationduetothetorqueof
theblade elementis confinedto theregionbetweenthe twocylinders.Thereforethe
rotational interference duetothevortexsystemisexperiencedonly
by
thoseblades thatcausethevorticity.
Discovering
thisfact,
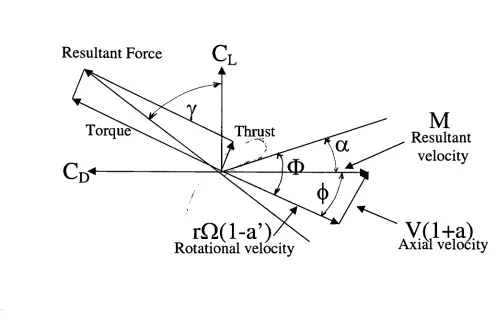
ageometricanalysisofthevelocities andtheoverall effectFigure4
Blade
Element
Theory
DiagramResultant Force
rQ(l-a').
Rotational velocity
M
Resultant
velocity
V(l+a).
[image:31.564.22.519.133.458.2]where
a V (1+a) tand=
-(20)
rQ(l-a')Cl
andCo
aredefinedastheliftanddrag
coefficients, respectively.These applytoairfoilintwo-dimensionalmotion.Thesecanberesolvedintothrustandtorqueaccordingto the
following
equations:\
=CLcost#-CDsin^
(21)
/*2 =
CL
sin<p+CD
costp(22)
Theelements ofthrust andtorquegiven
by
thebladeelement of areacdr,wherecisthechord oftheairfoil shape,thenbecome:
dl=AiyipM1cdr
(23)
Theseexpressions arethenmultiplied
by
the numberofbladestoobtaintheelements ofthrustandtorquefortheentire airscrew. Inplace ofc,sisusedforthepropellerblades
whichisequaltofollowing:
Nc
(25)
s= 2-r
whereN isthenumberofblades inthe airscew. srepresentstheratio ofbladeelementsto
Andthe advanceratioforthescrew canbegivenas:
. V r V r
1-a'
,
(26)
rjD R rQ R 1+ a
There existtwoextremities forthisanalysisthefirstof whichis thefollowing:
(27)
sCL=4^2
where
C_
istaken atanangle ofincidenceequalto 0-<f>. Thiscorrespondstoa normal
positive value of</>forapropulsive screw. Thesecondextremityoccurs whenthe thrust
disappearsatapoint given
by
thefollowing:CL=CDtan<*
(28)
Thetorqueispositivebutvanishes at ahigherrate of advancewhen
(29)
CL
CD
cot<j>Betweenthesetwopoints, theairscrewis actingas abrakeandbeyondthepoint where
torqueis negative, theairscrew isthenactingas a windmill.
For efficiency utilizingthemethodfound intheNotesinthe appendix and
correspondingtoanincrementalelementat
dr,
theequationbecomesthe following:VdT
_
V
\
tan^
(30)
T,~
where
CD-CLtanr
(31>
Note : yis definedas theeffect of profile
drag
oftheblades and
a1
is theeffect of rotation onthe slipstream.
Profile
drag
is definedastheskinfrictionandinduceddrag
on an airfoil shaped section.Inthefirstoftheseequationstherearetwoadditional sources ofenergy loss andthese are
thefollowing:
1.
a'
: effect of rotation ontheslipstream
2. y: effect of profile
drag
oftheblades. The first loss issmall overthe
workingrange ofthepropeller,butthe secondloss
becomes importantwhenthebladeelement approachestheattitudeofnolift.
Nowthat thebladeelement
theory
has been introducedandexplained,showingthateachbladeelementcontributesto theperformanceofthepropeller, anothertechnique
employingtheuse of a computer softwareprogramwillnowbecovered. Thissoftware
programtakesinto account a numberofbladeelements andthedesignofthepropellerin
ordertopredicttheperformance andefficiencyoftheoverall prop.This eliminatesthe
needtoperformtedioushandcalculationsinorderto get afasterestimate oftheprop
performance without construction ofthepropelleritself. As
long
asgeometryat certainChapter
3
:Propeller Software
Program
3.1 Propeller
Software
BackgroundModern
Prop
andDuctDesign, by
Martin HollmannandMarkBettosini,
is awritten guide thatfirstexplainsthe
theory
ofdesign behindpropellers and ductsandthenproceedsto analyze potentialdesigns with anincludedprogram.But beforetheprogram
canbeproperlyutilized,a generalunderstandingoftheauthors'
knowledge concerning
thesubject mustbe undertaken.Tothisend,the
theory
inthemanualwillbeexplainedindetailandthentherelativeinputsrequiredfornumeric predictionswillbe divulged.
Thetheoreticalbackgroundon whichthesoftwareprogramis basedwillnowbe
discussed. The geometryofthebladetobeusedonthe aircraftmustbe
fully
described inordertoderivemathematicequationsthatpertaintothrust,power,and efficiency.The
mostbasicofthesequantitiesincludethebladepitch angle 0,theradius ratwhicha
bladesectionis described alongthe
blade,
the totalradiusRoftheblade,
andtherotational speedoftheblade Q. IfoneconsultsFigure 5on thenextpage, these
quantitiesare moreeasilyreferenced. It isalsonecessarytoknoworhave an
understandingoftherelativewind speedseen
by
boththeplane andthepropeller.Thisquantity isgiven
by
:v
=Vv>(nr)!
<32>
where
V_
is thefreeairflow,
whichin anycaseisthesamefortheprop andtheplanebeing
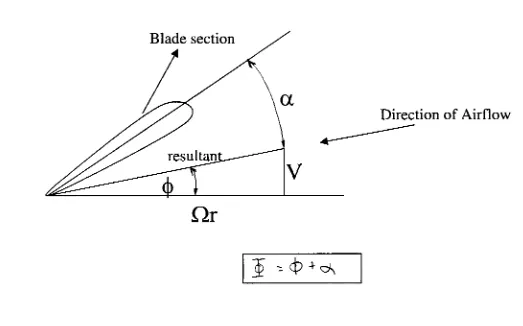
that thepropellerisattachedto theplane. Itcan alsobeseenthat thepitch angleisthesumoftwootheranglesasfollows:
0
=a+O
Figure5
Blade Element Diagram
for Program Input
Blade
sectionQr
J
- <> +<^
[image:36.584.28.551.179.505.2]where
O =
tan"1
-z-(34)
ClrIt isobviousthat thepitch ofthebladevaries alongtheradius and so O is determinedat
eachbladesection alongtheradius(note thatit isrecommendedtousetensectionsfora
betteranalysis),fora certain speed,and certainfree flowof air. Thevariablea however
remains a constantbetween 2and4 degreeswhich givesthemostlift forthe leastamount
of powerforcertainwingsections.
Onceanunderstandingofthesequantitieshas beenacquired,it isnowrelevantto
discuss efficiency 7ofapropeller which canbe definedas :
P 77=7"
(35)
Inthis equation, theefficiency is simply describedasthepower availablefromthe
propellerovertheshaftbrakepowerdeliveredto thepropeller
by
the engine orthedrivesystemitself. Butthisequationneedstobe broken down intoa moredescriptiveequation
withknownquantities andmeasurablevalues such as:
TV
77
"p
(36)
wherethepower available attheprop has beenequatedto thefreestreamflowmultiplied
by
theavailablethrust. Frompasttheory
andextensiveexperimentation,it has beendeterminedthat theefficiencyisafunctionof adimensionless quantity
J,
theadvancedwhere nisthe
frequency.
Agraph canbegenerateddepicting
theefficiencyversusvarious values ofJ in orderto
directly
readtheefficiencynumber,butthis techniquecannotbeusedforbladesthatdonothaveafixedpitch. Inthiscase a more complex
techniquemustbe employed whichiswherethe software programbecomesmostuseful.
Twoother quantities ofinterest are also analyzed and graphed
by
thesoftwareprogram. Theseinclude
Ct,
thecoefficient ofthrust, andCp,
thecoefficientof power.Thecoefficient ofthrustfora propellerdependsonthreeseparatefactorswhichinclude
theshape ofthepropeller, the advanceratio, andtheReynold'snumber.Thepropeller
thrustisequalto thefollowing:
T
=pnld*CT
(38)
whered isthediameterofthepropeller andn istherotationalspeed ofthepropellerin
revolutionsper second. Thepower coefficient alsodependsonthesamefactors affecting
the thrustcoefficientanditcanbeequatedto thefollowing:
CP
=2nCQ
(39)
where
Cq
isthecoefficientoftorque. Thepower equationstarts asthefollowing:P
=pn3d527rCQ
(40)
and canbereducedtothefollowing:
P =
Whencallingupontheaid of a softwareprogramfor
help
inanengineeringproblem,it isalways good practicetounderstandtheinputsrequiredoftheuser andthe
correspondingoutputstobeinterpreted
by
theuseraswell.Forthisparticular programthereare alargenumber ofinputsneededinordertocorrectly describethepropeller
geometricallyas well astheenvironmentinwhichitwilloperate. This assiststhe
computerin
determining
a more accurate resultintheschemeofthings.The listofinputvariables canbefound intheNotessection.The otherinputsrequiredforthecorrect
analysis ofthepropeller canbe foundwiththeTableofInputs inthenext section.These
3.2 Selected InputsForthePropellerProgram (withcollaborationfrom Ken
Blackburn)
After
defining
andlisting
the inputsto thesoftwareprogram,one mustbe abletoinputthecorrect valuesfortheparticulartypeofpropeller
being
usedfortheevaluation.This willtell thepotential propellerdesignerandbuilderwhetherthebladesare adequate
enough forthepurpose intended. Forthisparticularanalysis, reverseengineering isused
todeterminetheefficiencyoftheWrightBrothers'
propeller. Sincethebladeis already
inexistence, thevalues mustsimply be determined fromthesectionsprovidedonthe
propeller
drawing
itself.Inordertoacquirethenecessary inputsrequiredforthesoftware program, the
propellerandinturn eachbladesectionmustbe carefullyanalyzed.Forthistask, an
Eppler
boundary
layerprogramisemployed. Informationonthedrawing
is transferred tothisprogramfortheanalysis whichoccursintwosteps. The firstofthesestepsis an
inviscid flowanalysiswhichlooksattheairflowaroundthe airfoil. Itproduces avelocity
distributionandpressuredistribution tobeusedinthe second step.Importanttonoteis
thatthisprogram assumes no
boundary
layer. Thesecond stepoftheprogramis anintegral
boundary
layersolverthatintegratesindividualeffects on small sections oftheairfoil. Thisis apiecewiseintegratorand,intheend, this program can producethe
requiredinputs forthe analysisofthepropellerusingtheefficiencyprogram.
Analyzing
thesesectionsaccordingtoKen
Blackburn,
thefollowing
values wereinputted intotheM: 10
THETA75: 28.875
RPM: 428 rpm
VMPHBEGIN:0
VMPHEND: 50
VMPHSTEP: 1
D: 8.5'
N:2
RHO: .002378
CLP: 2.0
MINCL: 1.2
ALPHAMINCL: 22
Theaforementionedvariablesdescribetheoperatingconditions fortheWrightBrothers'
propeller.Thevariable THETA75 specificallyrefersto theangle of attack atthespan
75%outfromthe centerhubofthepropeller. Thesoftwareprogramusesthisvlaueto
determine allothervalues,
by
assumingtheangle oftwistas afunctionof radiusis ideal.Anothernoticeable variableis theRPMofthepropeller.The value of428 rpm was
retrievedfroma
drawing
oftheWrightpropeller.Thisrpm waskeptconstantthroughoutthe analysisbecausethepropellerturnedata constant rpm ontheModel B.
Nowadays,
propeller rpm canbe altered
during
flight butthisis notthecase withtheModel B. Thenextset ofvariables takesintoaccountthesections oftheblade andtheirspecific
characteristics andproperties.Thiswillensuretheprogramhasthecorrect propeller
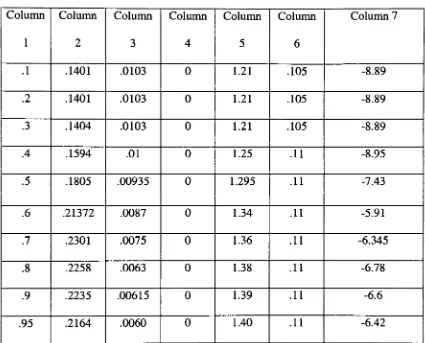
Table 1
TableofInputs
Column 1 Column 2 Column 3 Column 4 Column 5 Column 6 Column 7
.1 .1401 .0103 0 1.21 .105 -8.89
.2 .1401 .0103 0 1.21 .105 -8.89
.3 .1404 .0103 0 1.21 .105 -8.89
.4 .1594 .01 0 1.25 -8.95
.5 .1805 .00935 0 1.295 .11 -7.43
.6 .21372 .0087 0 1.34 -5.91
.7 .2301 .0075 0 1.36 -6.345
.8 .2258 .0063 0 1.38 -6.78
.9 .2235 .00615 0 1.39 -6.6
.95 .2164 .0060 0 1.40 -6.42
Column 1 : Midelement spanwiselocationasa percent ofthe total
Column 2: Widthofthebladeairfoilsection as given
by
thefollowing
Width=Chord/Radius
Columns 3 & 4: Coefficientsofthefollowingequation
CD
=A,
+A3
xa2
whereA*isobtainedbysettingtheangle of attacktozero andreadingthecorrespondingCDandA3is obtained
by
readingtheCDcorrespondingtoaknownangle of attack.
Column5: MaxCLforeach section
Column6: Liftcurve slopeforeach section(enteredperdegree)
Thetableontheprecedingpage completestherest oftheinputs necessary forthe
output ofthegraphs andefficiencynumbers
by
thepropeller program.By
alteringthesenumbers, one can changetheperformance characteristics ofthepropellerandinturnthe
plane towhichthepropeller will beattached.Thesenumbers werecarefullycalculatedin
ordertoobtainthecorrecttraitsoftheWrightBrothers'
propeller. Graphical
3.3 Output
Results
from
Software
Program
Graph1- 428
rpm
Efficiency
vs.Speed1 1
09
-OR^
07
-o
n r
-_.
i>
>>
c
05-0)
'5
m
04-i>
no
-0<?
10 15 20 25
Speed(mph) 30
?Efficiency
Graph2- 428
rpm
HPvs.Speed
18
16
14
12
10
a.
z
<>
n
o
<>
o
10 15 20 25
Speed(mph)
?HP
Graph3- 428rpm
Efficiency
vs.Advanced Ratio0.9
0.8
0.7
^0.6
>>
c 0.5
a,
'5
UJ
0.4
0.3
0.2
0.1
?
?
?
?
<> 1 1
0.2 0.4 0.6
AdvancedRatio
0.8 1.2
Graph4- 428 rpm
Thrustvs.Speed
120
100
80
|
6040
20 o
V. a
<?
o
10 15 20 25
Speed(mph)
?Thrust
Graph 5- 428rpm
Cp
vs, Advanced Ratio0.3
0.25
0.2
0.15
0.1
0.05
?
?
?
_
0.2 0.4 0.6
Advanced Ratio
?Cp
0.2
0.18
0.16
0.14
0.12
0.1
0.08
0.06
0.04
0.02
0.2
Graph6- 428rpm
CTvs.Advanced Ratio
?
? ?
?
<
0.4 0.6
AdvancedRatio
0.8
?CT
These graphscannowbeusedinan overall performance evaluationoftheWright
ModelB aircraftin Chapter 4. Notethat thediscussionofthesesix graphs willbeundertaken
Chapter
4
:Performance
Evaluation
ofthe
Wright
Model
B
Aircraft
Nowthat thecomputer software programhas beenutilized and produced
performancegraphs, a
drag
studywillbeconductedtobeusedinconjunction withtheperformance graphsin ordertopredictthecruise speed oftheWright Model B aircraft. In
this section,datafromtheWright Flyer willbe usedand correctedtofittheWright
Model B. Thismethod was chosendueto thelackofdata inexistence ontheModel B.
4.1
Drag
AnalysisProcedureoftheWright Model BThe first step in conductinga
drag
studyoftheWright Model B wastoobtain anydrawingsavailable oftheplaneinordertoaidinthecalculationoftheequivalentfrontal
area oftheplane. Inthis caseboth drawingsfortheFlyerandtheBwere obtained(for
reasonstobe discussed later). These drawingswere presented asFigures 1 and2 inorder
forthereadertobetterviewthe available material. Oncethescale ofthe
drawing
wasestablished, measurementsweretakenof cable
length,
strutlength,
approximate enginesize,and approximatepilotsize.
Following
the measurements,adrag
coefficientforeach separate piece wasdeterminedwith
help
fromaFluid DynamicDrag
textbook(Hoerner,S 1965). Cableandstrutcoefficientsweretaken
directly
fromthebook,
while aCd
forthepilothadtobecalculatedusingejection seatdataprovidedinthebook (Note:thefrontalarea ofthepilot
wasassumedtobe equivalenttotheejectionseatbecausebothwerein asittingposition.
Thisanalysis willbeshowninthenumerical results section.).Inthe end,thetotal
equivalentflatplatearea, theoverall
drag
coefficient oftheplane wasthencalculatedaccordingtothefollowing:
(42)
C.plane=
S.
wmg
where
Swing
is thetotal area ofthewing,notjustthefrontal area.Now eventhiscoefficientis not
totally
accurate so thata correctionfactormustbeappliedtoboostthecoefficienttomatch windtunneldata. Becausea
l/8th
scalemodel oftheFlyer hasbeen
inthewindtunnel,thetotal
drag
coefficients oftheplane arealready known. Thesewillbeusedto
help
determinethedrag
coefficients ofthemodelB.Theinherentassumption isthat theplanes arerelativelysimilarin flight. Basedondatato
date,
thisappearstobe agood assumptiondueto thefactthat theplaneswere nottoodifferent in design. There
wassome differenceinthenumberofpilots,
landing
gear,andtailbooms buttheoverallplaneappeared similarenoughtomakethis assumption.
The first stepwastodeterminethe totalcoefficientof
drag
oftheplaneinordertofurther carryontothefinal stepof
determining
thepowerrequiredtokeep
theplaneinflight. Thetotalcoefficientof
drag
canbe determined accordingto thefollowing:(43)
C Total =C'Parasitic+C. Inducedda a
whereparasitic
drag
is due to theflatplate areaandtheinduceddrag
is duetoliftgenerated
by
thewingsandtheangle of attack oftheplane.Sinceparasiticdrag
is merelytheonlypartrequiring furtheranalysis.The
following
equation canbedirectly
appliedtodeterminetheinduced
drag
coefficient:C2
C'induced=
(^4)
-e
(AR)
where
Cl
is theliftcoefficient,eisa correctionfactor(approximately
equalto0.9fortheWrightaircraft), andAR istheaspect ratio fortheplane. Since
Cl
willbeplotted againstCd,
Cl
isthengiven andisnot neededtobecalculated.As withCl,
eand ;rarealreadyknownvalues
leaving
ARtobe determined foreach respectiveplane.Theaspect ratiowouldbe easily determined foramonoplane,butchanges forthe
case oftheWrightplaneswhichwerebi-planes. Inthiscasethewingspan andheight
betweenwings mustbe known. Oncetheratio ofheighttowingspan was
determined,
itwasfoundon agraph(canbeseenintheResultsandDiscussion
Chapter)
andtracedoverto thecorrespondingAi/A value.Thiswasmerelyanintermediate step in
determining
theultimate aspectratio- Ai.The valueARwasthencalculatedby
thefollowing:
b2
(45)
AR
=wing
wherebis thewingspanand
Swing
isthetotalarea ofthewings.Oncethiswasdetermined,
theoverallAi foreachplanewasfinalized.This stepwas repeatedfor boththeFlyerandtheBmodels. (Notethatseparate plots
were created andthesewillbeshownintheResultsandDiscussion
Chapter.)
TheinducedplotfortheFlyerwasthencombined withtheoverall
Cd
fortheFlyer. Thismeansthatthe inducedplot couldbe subtractedfromtheoverall plotinordertoisolate
theparasitic
drag
only,which wasdoneaccordingto thefollowing:Cd
parasitic=Cdoverall-Conduced
The resultingnumbers werethenadjusted
by
multiplyingthemby
thefollowing
correctionfactor: (Thecorrectionfactor accountsforalloftheparasiticdifferences
betweentheFlyerandBso
CdB(parasitic)
canbefound.)
cf=
Y,CdS(B)
(47)
Y^CdS
(Flyer)
CdB(
parasitic)=cfxCdFlyer{
parasitic)(48)
where
CjS(B)
isthe totalequivalent flatplate area ofB aircraft andCdS(Flyer)
is the totalequivalentflatplate areaforthe Flyer. Thesenew numbers, alsoknownastheparasitic
drag
fortheBplane,werethenaddedto theinducedcurvefortheB inordertogetthecombined
drag
coefficient fortheB planeaccordingto thefollowing:Cd
(B total)=Cd
(B induced)+cf*Cd(flyer
parasitic)'4")
Anew curvewas thenplottedtodepictthe
Cl
vs.Cj
totalfortheB plane.ThiscanbeOneofthelaststeps ofthisanalysis wastodetermine the
drag
force atcertainspeeds ontheplane.Thiswas conducted
by
firstdetermining
thevelocityat whichtheplane was
flying
accordingto thefollowing
equation:CL=
, W
(50)
y2pv2swing
where Wisthe weight oftheplane,p istheair
density,
V isthevelocity,andSWig
is thetotal wingarea.
Knowing
Cl, W, S,
andp, theonlyunknown valueis thevelocity.After rearrangingtheequationthevelocitycanbe found from:
W
(51)
V C S1
wing
Knowing
thisquantityandthecoefficient ofdrag
at eachCL,
thedrag
forcewasthencalculatedasfollows:
1/ 2
(52>
Drag
Force =C,
x V,'
xpxV x5
whereall oftheabove quantities have been previously definedand areknown inthe
equation. From heretotherequiredpower was onlya matter ofplugging intothe
following
equation:Powerrequired=
Drag
ForcexVelocity
(")
Thiswasthenconvertedinto horsepowerthrough a series of conversions which were
ontheplot of power available vs. speed obtainedfromthesoftware analysis. Thepower
obtainedfromthesoftware program neededtobe doubledinordertoaccountforthe two
propellers present ontheplane.
The finalstepwasto determinetheclimb speed
by
readingthespeedoff ofthegraphthatcorresponds to theleastamount ofHPrequired.Thentherate ofclimb,
R,
canbefoundaccordingto thefollowing:
P -P
R=
(54)
Weight K }
where
Pa
is theavailable power andPr
istherequired power attheclimb speed.4.2
Drag Study
Numerical
AnalysisandResultsAccording
to theanalysisdescriptiongivenintheTheory
Chapter,
thefollowing
drag
studyoftheWright BrothersPlanes,
the FlyerandtheB,
was undertaken andcompletedand exhibitedtheproceedingresults.
Total Equivalent FlatPlate Area
Flyer: 2.69
(cables)
+ 13.54(struts)
+ 1.8 (chaintubes)+2.205(engine)
+7.65(wing)
+6.48 (person+ radiator +fueltank)=34.365Model B :
(1.91+.32) (cables)
+ 12.85(struts)
+2.21 (chaintubes)+ 1.42(motor)
+.385
(wheels)
+7.08(wing)
+ 12.96 (pilot+ radiator +fuel tank)=39.135Cd
ofPerson inSitting
Position (from Fluid- DynamicDrag
Book)
Thefirst step in
determining
theequivalentflatplate area oftheWrightplaneswas tofindthe totalprojectedfrontal areafromthedrawings. Thenthe
Cd
wasfound intheFluid Dynamic
Drag
bookand appliedto thefrontalarea. Inthecaseofthepilottherewasnoclear-cut
drag
coefficient.The frontalareahadtoassumedandthe
drag
coefficient wascalculatedaccordingto theinformationfoundinthebook (theexample was foran ejection seatbutthe
drag
coefficientwas appliedtotheWrightpilot).
=
V~oV2SC
(55)
Drag
force=where
5 =
6ft2(asumed)
V=500 knots=843.9-^/
p=.00238
Drag
force=5500lbsKnowing
thisinformation,
theCd
oftheejection seat/personisequivalentto 1.08.Aspect Ratio Determination (from Fluid- Dynamic
Drag
book)
Figure4 :AspectRatio Diagram
ATA (C^ ()
> ae a (e,) ()
A C II (C,) (<)
A> k/l m
Gap
Ratio=h/bEffectiveAspect Ratio =Ai
GeometricAspect Ratio=A=
y^
[image:57.538.113.444.296.626.2]Flyer Analysis:
B Analysis:
Plotof
Cd
InducedGap
Ratio=h/
=6/A
n=0. 15
40
A=
40Xio
=3-137Ai=1.25x3.137=3.921
Gap
Ratio=h/b=
5'4%s
5=0.141
A/A
=l.23A= =3.140
'472
Ai=1.23x3.140=3.8622
C 2 C,induced = , .
d
n{0.9)Ai
Oncetheaspectratiohas been determined fromtheprevious analysis,theinduced
drag
coefficientcan beplotted versusthecoefficientoflift. Theresults canbeseenintheFlyer
induced
drag
plotC C.induced = , .
'
^-(0.9)3.921
Graph7- Flyerinduced
drag
CL
vs.Cd
Flyer
n
(
1 <
) 8 ?
<
<
1 R ?
1 A. ?
1*? ?
n i?
-0.01 0.01 0.03 0.05 0.07 0.09 0.11 0.13 0.15
Cd
?Cd induced
B induced
drag
plotC
C,
induced=-, .
'
^-(0.9)3.3.8622
Graph 8-- Model B induced
drag
r>
CL
vs.Cd
B
(
(
I
i ?
i p ?
J.Q
1fi ?
1 A ?
\i ?
J.c fl .
*
-0.01 0.01 0.03 O.I35 0.07 0.09 0.11
Cd
0.13 0. 15
PlotofFlyer
Induced
Drag
+ParasiticDrag
(takenfromexistingdata)
Graph9- Flyer induced
andtotal
drag
CL
vs.Cd
Ryer 1.2 0.8 0.6 0.4 0.2 ? ? ? *t
1
?,, B
0.05 0.1 0.15
Cd
0.2 0.25 0.3
?Cd induced Cd induced+parasite
Parasitic
Drag
CoefficientDeterminationoftheFlyerCdparastic=
Cd
(measured)
-Conduced
Using
theabovedescribedequationandthecurves presentedintheprevioussection,theparasitic
drag
coefficient oftheFlyerwasdeterminedat eachdatapoint and [image:60.538.101.463.92.332.2]placedintothe
following
table:Table 2- Flyer
Drag
CoefficientsCd
inducedCd
totalCd
parasite0 0.13 0.13
0.000902009 0.12 0.119097991
0.003608035 0.11 0.106391965
0.008118079 0.11 0.101881921 0.014432141 0.11 0.095567859
Determination
oftheParasiticCd
fortheBNowthat theparasitic
drag
coefficienthas been determined fortheFlyer,
itcanbeappliedtotheB with afewadjustments as follows usingacorrectionfactor:
YC.S(B)
39.135 cf =__^
d v J
= =1.1388
2^CdS
(Flyer)
34.365Thetotalcoefficient of
drag
fortheB isasfollows:Cd(B total)=Cd(B
induced)
+cfx.Cd(flyer
parasitic)
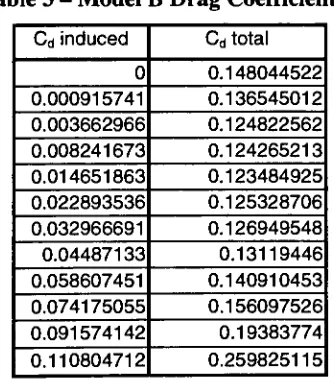
[image:61.538.185.352.379.569.2]This yieldsthe
following
tableof values andthegraphonthefollowing
page:Table 3- Model B
Drag
CoefficientsCdinduced Cdtotal
0 0.148044522
Graph 10- Model B induced
andtotal
drag
CLvsCd
B
O
1
1 _ ??
Ofi
?
\J.KJ
04
ut
OP
A?\J.C
n;
\
.0
?
Cd
induced
Cd
irduced+parasite
Drag
ForceDetermination
fortheBOncetheabove plothasbeencompleted, a
drag
forcecanbeobtainedby
applyingthe
following
equationsin theorder presented:V =
W
/9 L wing
Drag
Force =C.x]/xpxV2xS
Inthiscasetheunknownvelocity is found first
by
pullingCL
valuesfromthegraphs andthenapplyingthe second equationfor
drag
force. Fromthese twoequations thefollowing
tablewas produced:
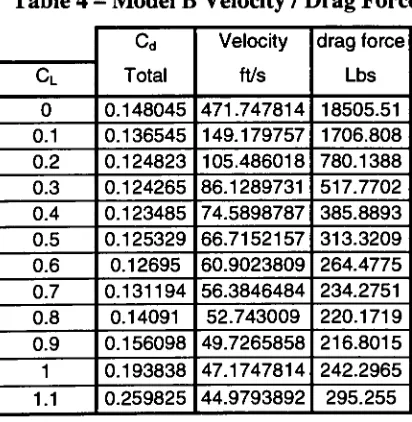
Table4- Model B
Velocity
/Drag
Forcecd
Total
Velocity
ft/s
drag
forceLbs
CL
0 0.148045 471.747814 18505.51
0.1 0.136545 149.179757 1706.808
0.2 0.124823 105.486018 780.1388
0.3 0.124265 86.1289731 517.7702
0.4 0.123485 74.5898787 385.8893
0.5 0.125329 66.7152157 313.3209
0.6 0.12695 60.9023809 264.4775
0.7 0.131194 56.3846484 234.2751
0.8 0.14091 52.743009 220.1719
0.9 0.156098 49.7265858 216.8015
1 0.193838 47.1747814 242.2965
[image:63.538.168.374.351.562.2]Power Required for Flight
Nowthat the
drag
forcehas beencalculated, theoverall power requiredtokeep
theplanein flightatdifferentvelocities canbe determined. Oncethishas been
found,
itcanbeplotted onthe same graph as power available produced
by
the softwareprogram.Thepower required canbefoundviathefollowing:
Power required =
Drag
ForcexVelocity
Aftertheequation was appliedto thedata intheprevioustableand
following
someconversionstogetto theultimate goal,
HP,
thefollowing
tablewas produced:Table 5- Model B Required Power
Velocity
Ft/s 471.747814 149.179757 105.486018 86.1289731 74.5898787 66.7152157 60.9023809 56.3846484 52.743009 49.7265858 47.1747814 44.9793892 295.255drag
force Lbs 18505.51 1706.808 780.1388 517.7702 385.8893 313.3209 264.4775 234.2751 220.1719 216.8015 242.2965 powerreq HP 15872.63 462.9482 149.6252 81.08196 52.33359 38.00599 29.28605 24.01734 21.11372 19.60148 20.78236 24.14619ThisshowstheHPrequiredagainst speed and
drag
force. Inthenext section theplot ofHPrequiredvs. Speed
(mph)
willbe presentedalongwiththeHPavailable vs. SpeedHP
Required/Available
vs.Speed
This isthelast step intheoverall
drag
studyoftheWright Bplane. Fromthisgraphthestall speed canbedeterminedas well as regions ofliftandsinking.The
following
graph willbe further discussedinthenext section ofthis chapter.60
50
40
_ 30
20
10
Graph11
Power Required/ Power Available
'*-7<21.1vi.vc--.
A
A
/
/
/
*
10 20 30
Speed(mph)
40 50
PowerRequiredB
-Power Available
60
ClimbSpeedand Climb Rate
According
tothegraphabove, theclimbspeedisapproximately 34mph andtheclimb rateisthefollowing:
,,06107-107")
,,
Chapter
5
:Discussion
ofResults
5.1 Climb Speed
andClimb Rate
Fromtheprevious chapteritwas shownthat thebestclimb speed occurred at34
mph andthiscorrespondedtoa climb rate or almost4.26ft/sor255 ft/min. These values
comparecloselywiththeknowndata fromtheModel Bperiod of200 ft/min. Theclimb
in ft/sisoften referredtoasthespecific excess energy. Atsealevelanaircraftperforms
differently
thenathigheraltitudes. Ascomparedtosealevel,
anaircraft'sengine losespower athigheraltitudesdueto the thinnessoftheair. Theenginecannotingestenough
airtomaintain performance andthereforeitcannot climb over a certain altitude.
5.2
Performance
atCL
Max
Theaircraft specific excessenergyatCLmaxis 2.26 ft/s . This indicatesthat the
aircraft canstillclimbwhileontheedge of astall,whichisadesirabletrait. Apilot can
usethisadvantagewhenabortinga
landing
orclearing highterrain.5.3 Cruise Speed
Thecruise speed was readfromthepowercurve whichdepictedtheavailable
powerandtherequired power atspecificvelocities. Thetwocurvesintersectedat41
mph. This becomesthecruisespeed oftheaircraft. Availabledata fromthe period ofthe
ModelB aircraftindicatethatitscruise speedwas around40mph.This comparesvery
closelyto thatofthedatagenerated
by
thesoftwareprogram andthedrag
study.5.4 Propeller Performance
Efficiency
of apropellerisvital to theperformanceof an aircraftinflight bothinistoproducethrustand act against a
body
of airin ordertopropeltheplanein aforwarddirection. Thepropellersatthe timeoftheWrights were
hardly
efficient andthereforetheirgoal of66%seemed out ofreach,butthroughperseveranceandhardwork
they
succeeded.Theanalysis ofthepropeller conductedhere wastoconfirmtheirdesignand
theirnumerical outputs. Becausethepropellerturnedat one speed most ofthetime,the
analysis was run at a constant rpm of
428,
being
thisis a published numberlinkedtotheModel B aircraft.
Thehorsepowergraph
(2)
fromthesoftware programindicatethepowerinputtopropeller(which ismultiplied
by
2forthedualpropellerset-up) and should notbeconfused withthepowerresulting fromthe thrust.The efficiency factorreducesthe
powerpropellingthe aircraftforward.
Asitturns out,the428 rpm resultsin 28 totalHPrequired atthepropellers, which
isaboutrightforthevertical4engine.Thisenginewascapable of35
HP,
butthetransmissionlossesand
density
of air will reducethispower.SincetheWright Brothers first designedtheirpropeller,therehave been
enormousimprovements andrefinementsmadeon propellerdesign
itself,
andinturntheefficiencyofthepropeller. As a result ofthese
improvements,
today'spropellers canbeChapter 6
:Conclusions
&
Recommendations
6.1
Conclusions
Inthepreviouschapter,the results obtainedthrough thesoftware analysis andthe
drag
studywere presented and discussedasfarastheircorrelationto thedataormeasurements obtained
by
theWright Brothers. Thischapterwill attempttodrawconclusionsfromtheseresults andthe
following
chapter willmake recommendationsinordertoeasefurther studyofthissubject matter. Fromthefirstchapter, theobjective of
thisresearch wastodetermine theaccuracyand correctness oftheWright Brothers in
theirquesttodesignapropellerfortheirairplane.
Thefirstareaof concern was theefficiencyofthepropelleritself. From observing
the presenteddataand graphsintheResultsandDiscussion
Chapter,
it isclearthatbothstudies producesimilar enoughresultstoconcludethattheir theorieswere correct and
theirpropeller performedinthemanneritwasintended.
Taking
thecross sections andinputting
theircorrespondinggeometricaldataintothesoftware program wastheultimatetestofthepropeller.Thesoftware wasdesignedtoconductefficiencystudies giventhe
shape ofthepropelleras well astheoperatingcircumstances ofthepropeller, orinthis
casetheplaneitself. Thistranslatesintoarelativelyprecise physical model ofthe
propellerandtheresults canbeconsideredasaccurateastheinputtedmodel. Outofthe
softwarecame anefficiencyof70%thatis notfaroff ofthe66%predicted
by
theWrightbe acceptable
including
theavailablehorsepoweratdifferentspeeds(
agraphthatwaspresented intheResultsandDiscussionChapter). Thenextstepoftheanalysiscouldbe
completed
knowing
thisinformation.Thesecond objective ofthisresearch wastodeterminepower requiredto
keep
theplaneinflight.Thecalculated powerdatacouldbeplotted againstthepredicted power
dataretrieved fromthesoftware and a cruise speed couldbe determined. Fromscale
drawingsofboththeFlyerandthe
B,
adrag
studywas conductedaccordingtotheprocedureinthe
Theory
Chapter (theresults of whichcanbeseenintheResultsandDiscussion Chapter). This
drag
studyyieldedbothspeeds andthedrag
forcepresent ateach speed.
Using
thisdataandthepowerequationpresented, thepower-requiredcurvewasthendiscovered.
Overlaying
bothplots yieldeda cruise speed of around42mphwhichcloselymatchesthatgivenatthe time theplanewas constructed. Thecombined
powercurvefulfilledthis objectiveintheresearchand showedthat the technique
employedtoconductthe
drag
studycouldactuallyproduceviable numbers with arelativelysmall amountofknowledgeatthe start. Evenwithonlycrude scaledrawingsof
the planes, thefinalnumberswereonlyafewunitsofffromtheirsupposedtargets(as set
by
theWright Brothers).Asmentionedpri