Int. J. Electrochem. Sci., 13 (2018) 12118 – 12124, doi: 10.20964/2018.12.87
International Journal of
ELECTROCHEMICAL
SCIENCE
www.electrochemsci.org
Temperature Effect on Behavior of Sodium-ion Battery
Electrodes Based on Na
3V
2(PO
4)
3@C/Ag Composite
Alexander Skundin1,*, Tatiana Kulova1, Svetlana Novikova2, Andrey Chekannikov3, Yuliya Kudryashova1, 4
1 Frumkin Institute of Physical Chemistry and Electrochemistry of Russian Academy of Sciences,
31-4 Leninskii prospect, 119071, Moscow, Russia
2 Kurnakov Institute of General and Inorganic Chemistry of Russian Academy of Sciences,
31 Leninskii prospect, 119971, Moscow, Russia
3 Skolkovo Institute of Science and Technologies, 3 Nobel St., 121205, Moscow, Russia
4 National Research University “Moscow Power Engineering Institute”, 14 Krasnokazarmennaya st.,
111250, Moscow, Russia
*E-mail: [email protected]
Received: 15 September 2018 / Accepted: 16 October 2018 / Published: 5 November 2018
The influence of temperature on the process of sodium insertion into Na3V2(PO4)3@C/Ag composite in
1 M NaClO4 in a mixture of propylene carbonate‒dimethoxyethane is studied in the range from ‒45 to
+20 oC. A decrease in temperature was found to result in a significant decrease in the capacity, and the
temperature dependence of the capacity is not described by the Arrhenius equation, as in the cases with other insertion compounds. Besides, a decrease in temperature results in a noticeable nonlinear increase in polarization, the polarization of the cathode process being much higher than that of the anodic process.
Keywords: sodium-ion batteries, sodium vanadophosphate, sodium insertion, temperature effect
1. INTRODUCTION
Sodium-ion batteries are considered now as the most promising candidates for the next generation of secondary power sources, especially for stationary applications. In principle, sodium-ion battery is very similar to lithium-ion counterpart, so the key problem of sodium-ion development comes to search the most effective electrode materials. Of late, sodium vanadium phosphate Na3V2(PO4)3 with NaSICON structure [1‒4], and more strictly, its composites with carbon
Na3V2(PO4)3@C [5‒12] attract keen attention as promising active material for positive electrodes in
and satisfactory cycling stability due to absence of serious volume changes at sodium insertion/extraction. So, authors of [5] studied in detail Na3V2(PO4)3@ C which was synthesized by the
sol-gel method and showed that a special porous morphology and structure leads to an increase in the specific surface area and, consequently, to an increase in the contact area with electrolyte and to ability of this material to work at elevated current densities. In [6, 7], an increase in the discharge capacity at rather high current densities is provided by the unique morphology of Na3V2(PO4)3@C, which
represents sodium vanadophosphate nanoparticles embedded in carbon nanofibers [6, 9] or porous carbon matrix [7]. The authors of [10] reported on the record characteristics of Na3V2(PO4)3@C,
namely, its ability to cycling at current densities up to 100C. This feature was explained by consisting of Na3V2(PO4)3 nanocrystals coated with amorphous carbon and then wrapped by reduced graphene
oxide nanosheets (abbreviated as NVP@C@rGO). Even more impressive results (cycling with currents up to 500С) were reported by the authors of [12]. In this work, sodium vanadophosphate, decorated with carbon nanofibres grown by acetylene decomposition at 690 °C, was synthesized. Therefore, at present, the performance of Na3V2(PO4)3@C-based electrodes are studied in many
details, but any data on their behavior at low temperatures are absent in the literature. At the same time, such information has importance for practical exploitation of sodium-ion batteries, e.g in renewable energy systems, in smart grids, in electric vehicles and so on. In this paper we report for the first time a study concerning the performances of Na3V2(PO4)3@C-based electrodes in a wide
temperature range from ‒45 to +20 oC
2. EXPERIMENTAL
2.1. Synthesis of active material
Na3V2(PO4)3@C/Ag was synthesized with modified Pechini method in the wake of [13] with
V2O5, NaNO3, NH4H2PO4, AgNO3, oxalic acid, citric acid, and ethylene glycol as starting substances.
All reagents were analytical grade. Polycondensation of citric acid and ethylene glycol resulted in polymer matrix creation, which prevented growth of Na3V2(PO4)3@C/Ag particles. Final heat treating
was carried out in argon atmosphere at 600 oC for 10 hours and 800 oC for 2 hours. Ag nanoparticles were embedded in final particles of active material for notably enhancement of electronic conductivity. 2.2. The electrode preparation
The electrodes were prepared by standard paste technology. The active mass consisted of 70 w/o Na3V2(PO4)3@C/Ag, 20 w/o carbon black (Timcal, Belgium) as a conductive additive, and 10 w/o
polyvinylidene fluoride (PVdF) as a binder. (PVdF was used as its solution in N-methyl-2-pyrrolidone (Sigma-Aldrich)). This active mass was applied onto aluminum foil as a current collector (5 mg/cm2) and dried in air at the temperature 100 oC for 2 hours. Then, the electrodes were pressed by 100 MPa and once more dried in vacuum at the temperature 120 oC for 8 hours.
2.3. Electrochemical measurements
The electrochemical performance was estimated by galvanostatic cycling with using sealed three-electrode electrochemical cells. Every cell contained one working, one auxiliary and one reference electrode. Auxiliary and reference electrodes were prepared by rolling sodium metal onto stainless steel mesh as current collectors. The separator from microporous non-woven polypropylene film (UFIM, Russia) was sandwiched between the electrodes. The surface area of working and auxiliary electrodes was 2.25 cm2. 1 М NaClO4 in an equivolume mixture of propylene carbonate and
dimetoxyethane was used as an electrolyte. Humidity of this electrolyte measured by the coulometric K. Fischer titration (917 Ti-Touch, Metrohm, Switzerland) did not exceed 20 ppm. The cells were assembled and filled by the electrolyte in a glove box (Spectroscopic Systems LLC, Russia) with argon atmosphere with oxygen and moisture content no more than 1 ppm. The cells were placed into climatic chamber КТХ-74-65/165 («Smolenskoye SKTB SPU», Russia). The temperature in the chamber was maintained with accuracy of 0.2 oC. Electrochemical cycling of the cells was performed over the potential range of 2.7–3.8 V using a ZRU 50 mA–10 V charge-discharge system (NTT Buster JSC, Russia). The tests were carried out under the galvanostatic mode at a current density of 20 mA g−1. Specific capacity was calculated per unit weight of Na3V2(PO4)3@C/Ag.
3. RESULTS AND DISCUSSION
3.1. Temperature effect on capacity
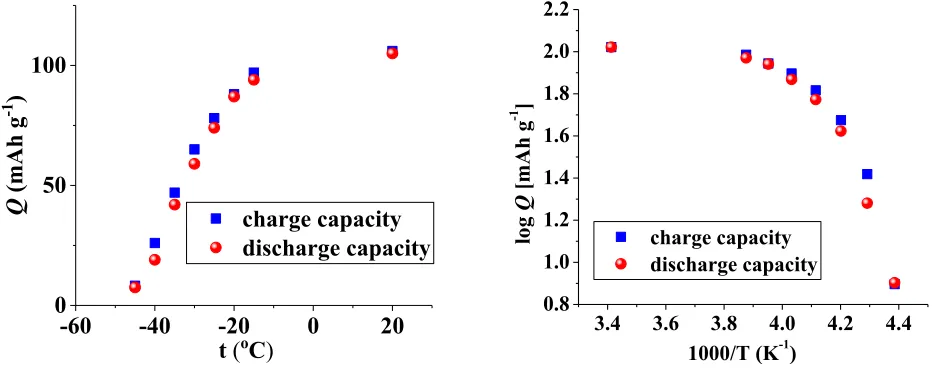
Fig. 1 shows galvanostatic charge-discharge curves taken at the temperatures of ‒45, –40, ‒35, ‒30, –25, –20, –15, and +20 oC. Discharge capacity at the temperature of +20 oC amounted to 105
mAh g‒1, which is rather close to theoretical value of 117 mAh g‒1. One can see the evident decrease of capacity (Q) with temperature lowering. Indeed, at the temperatures of –15, –20, –25, –30, –35, –40, and –45 oC the discharge capacity was equal to 94, 87, 74, 59, 42, 19, and 8 mAh g‒1, correspondingly.
Figure 1. Galvanostatic charge-discharge curves for the electrode from Na3V2(PO4)3@C/Ag, taken at
[image:3.596.181.401.528.712.2]
The quantitative temperature dependence of charge and discharge capacities in regular and Arrhenius coordinates are shown in Fig. 2
3.4 3.6 3.8 4.0 4.2 4.4 0.8
1.0 1.2 1.4 1.6 1.8 2.0 2.2
charge capacity discharge capacity
lo
g
Q
[
mAh
g
-1 ]
1000/T (K-1)
Figure 2. Temperature dependences of charge (anodic) and discharge (cathodic) capacities for the electrode from Na3V2(PO4)3@C/Ag
In [14, 15], the Arrhenius temperature dependence of the capacity was obtained, which was explained by the slowness of solid-phase diffusion in the electrode material. As can be seen, in the present paper the capacity at temperatures above -15 ° C is marginally dependent on temperature, and at lower temperatures the temperature decrease is accompanied by an increase in the activation energy (an increase in the slope of the curve in Arrhenius coordinates). To realize the temperature dependence of the capacity in the form of the Arrhenius equation, certain conditions must be met, in particular, the diffusion of potential-determining particles should be the limiting stage of the entire electrode process, the diffusion geometry should be close to semi-infinite, there should not be a wide distribution of active material particles in size, etc. More likely than not, in the present case it is impossible to consider diffusion as the limiting stage of the process.
Intriguingly, the charge capacity at +20 oC is equal to the discharge one. At less temperatures the anodic (charge) capacity exceeds the cathodic capacity and this difference increases with temperature lowering. This phenomenon could relate to the increase of share of irreversible processes at temperature lowering.
It is worth noting that in [16] close results for temperature dependence of discharge capacity of electrode based on Na3V2(PO4)2O2F. The discharge capacity was weakly dependent on temperature in
the range from ‒25 to +25 oC and it was 94, 101, 116, 122, 126, and 126 mAh g‒1 at the temperatures
of ‒25, ‒15, ‒5, +5, +15, and +25 oC.
-60 -40 -20 0 20
0 50 100
charge capacity discharge capacity
Q
(
mAh g
-1 )
[image:4.596.57.523.116.309.2]
3.2. Temperature effect on polarization
A graphic representation of how quantitatively the shape of the discharge curve varies with the temperature change is given in Fig. 3, where the discharge curves are given in normalized coordinates (when the ratio of the current capacitance to the final capacitance is plotted along the abscissa axis). Such approach was used, e. g. in [17, 18]
0.0
0.5
1.0
2.5
3.0
3.5
4.0
8
7
6
5
4
3
2
E
c(
V
vs
.
Na/Na
+
)
q
c [image:5.596.137.434.195.419.2]1
Figure 3. Discharge curves in normalized co-ordinates, taken at temperatures +20 oC (1), ‒15 oC (2), ‒ 20 oC (3), ‒25 oC (4), ‒30 oC (5), ‒35 oC (6), ‒40 oC (7) and ‒45 oC (8)
-40 -20 0 20
2.8 3.0 3.2 3.4 3.6 3.8 4.0
E
1/2(
V
vs
. Na/
Na
+
)
t (oC)
[image:5.596.146.428.501.721.2]
As can be seen, a decrease in temperature does not lead to any regular change in the shape of the discharge curve, in contrast, for example, with the case of lithium insertion into lithium titanate [15].
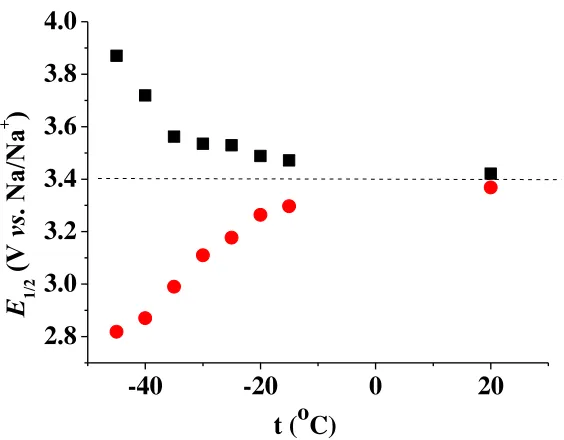
Often a characteristic value of the potential corresponding to half the capacity in galvanostatic measurements is used as a quantitative characteristic of polarization (see, for example, [15, 19]). Fig. 4 shows the characteristic potentials of the anodic and cathodic processes on an electrode based on Na3V2(PO4)3@C/Ag.
The temperature dependences of the characteristic potentials are nonlinear, unlike the analogous dependences for lithium insertion into lithium titanate [15]. In addition, it is clearly seen that the cathodic polarization exceeds the anodic one, also in contrast to the patterns of lithium insertion into lithium titanate [15].
4. CONCLUSION
For the first time, the effect of temperature on the process of sodium insertion into a sodium vanadophosphate composite with carbon with a small silver additive was studied. The objects of the study were electrodes made by standard paste technology, in contact with the standard electrolyte 1 M NaClO4 in an equivolume mixture of propylene carbonate‒dimethoxyethane. Galvanostatic cyclic
measurements were carried out in the temperature range from -40 to +20 ° C. It was found that a decrease in temperature results in a significant decrease in the capacity, and the temperature dependence of the capacity is not described by the Arrhenius equation, as in the cases with other insertion compounds. A decrease in temperature also leads to a noticeable nonlinear increase in polarization, and the polarization of the cathode process greatly exceeds the polarization of the anodic process.
ACKNOWLEDGEMENT
The present work was financially supported by Russian Scientific Foundation, Project No. 16-13-00024.
References
1. L. S. Plashnitsa, E. Kobayashi, Y. Noguchi, S. Okada, J.-i. Yamaki, J. Electrochem. Soc., 157 (2010) A536.
2. K. Du, H. Guo, G. Hu, Z. Peng, Y. J. Cao, Power Sources, 223 (2013) 284.
3. Z. Jian, W. Han, X. Lu, H. Yang, Y-S. Hu, J. Zhou, Z. Zhou, J. Li, W. Chen, D. Chen, L. Chen, Adv. Energy Mater., 3 (2013) 156.
4. K. Saravanan, C.W. Mason, A. Rudola, K.H. Wong, P. Balaya, Adv. Energy Mater., 3 (2013) 444. 5. W. Shen, C. Wang, H. Liu, W. Yang, Chemistry - A European Journal, 19 (2013) 14712.
6. J. Liu, K. Tang, K. Song, P.A. Van Aken, Y. Yu, J. Maier, Nanoscale, 6 (2014) 5081. 7. C. Zhu, K. Song, P.A. Van Aken, J. Maier, Y. Yu, Nano Letters, 14 (2014) 2175.
8. H. Wang, D. Jiang, Y. Zhang, G. Li, X. Lan, H. Zhong, Z. Zhang, Y. Jiang, Electrochim. Acta, 155 (2015) 23.
Chem. A, 3 (2015) 1005.
10.X. Rui, W. Sun, C. Wu, Y. Yu, Q. Yan, Adv. Mater., 27 (2015) 6670.
11.J. Kang, S. Baek, V. Mathew, J. Gim, J. Song, H. Park, E. Chae, A. K. Rai, J. J. Kim, Mater. Chem., 22 (2012) 20857.
12.Y. Fang, L. Xiao, X. Ai, Y. Cao, H. Yang, Adv. Mater., 27 (2015) 5895.
13.A. Chekannikov, R. Kapaev, S. Novikova, N. Tabachkova, T. Kulova, A. Skundin, A. Yaroslavtsev, J. Solid State Electrochem., 21 (2017) 1615.
14.T. L. Kulova, Russ. J. Electrochem., 40 (2004) 1052.
15.E. K. Tusseeva, T. L. Kulova, A. M. Skundin, Russ. J. Electrochem., 54 (2018) (in press). 16.J.-Z. Guo, P.-F. Wang, X.-L. Wu, X.-H. Zhang, Q. Yan, H. Chen, J.-P. Zhang, Y.-G. Guo, Adv.
Mater., 29 (2017) article No. 1701968
17.Yu. E. Roginskaya, F. Kh. Chibirova, T. L. Kulova, A. M. Skundin., Russ. J. Electrochem., 42 (2006) 915.
18.Yu. E. Roginskaya, T. L. Kulova, A. M. Skundin, M. A. Bruk, E. N. Zhikharev, V. A. Kal’nov, Russ. J. Electrochem., 44 (2008) 992.
19.X.-L.Wu, Y.-G. Guo, J. Su, J.-W. Xiong, Y.-L. Zhang, L.-J. Wan, Advanced Energy Materials, 3 (2013) 1155.