The
ECONOMIC
Background
THE INTERNATIONAL ENVIRONMENT
Overview
Prospects for the world economy are extremely good. For the first time since 1994 all the major regions of the world are expected to see significant synchronised growth. This is in direct contrast to the late 1990s. Forecasts of world economic growth have been revised upwards several times over the last year by most forecasters. This increase in economic activity is expected to increase world trade by 9%.p.a between 2000 and 2002. The US continues to drive the world economy while many emerging market economies, particularly in South America and in South East Asia are experiencing strong recovery. In contrast Japanese performance is relatively poor. While oil and energy prices have risen recently, the slight pick up in inflationary pressure has not been transmitted fully to consumers although some producer and export prices have increased. With such an optimistic outlook the balance of risk must be on the downside with the possibility of a fall in asset prices.
US
GDP growth in the US was 4.1% for 1999 (the third year that growth has been above 4%). Again domestic demand is the main stimulus to growth. Growth for 1999q4 has been revised up to 1.8% with consumption accounting for 1%. Investment spending was weaker but this may be relative due to the large outlays associated with the millennium date change. Data for 2000ql indicate a rise in retail sales of 3.7% in the three months to March and the possibility that investment spending will pick up again. The estimates of 2000ql GDP growth indicate that the US will continue to grow strongly this year.
Productivity growth is still accelerating despite the longest period of continual economic growth
[image:1.518.284.484.358.548.2]recorded. It now averages 2.6%p.a. since 1996. The growth of incomes slowed slightly but real personal consumption continued to grow. This suggests that the 'wealth effect' has boosted consumption. The Federal Funds rate has been increased once more by 0.25% and is currently 6%. It is expected to rise to 7% by the end of the year. Clearly the prospect of increased inflationary pressures undermining growth are taken very seriously. Headline inflation has grown by 3.7% in the year to March but core inflation was only 2.4%. This is explained by the high oil price working through into industrial commodity prices. Oil prices have declined by more than 20% since the beginning of March. A significant factor here was the 1.45mbpd increase in production agreed by OPEC. Thus the main impact of the higher oil price is felt on producer prices. The current account deficit grew to 4.2% of GDP in 1999q4 and for the year as a whole it was 3.7% of GDP. Employment growth continues in the US with unemployment in March unchanged at 4.1% from the previous month. This is below the average for previous years.
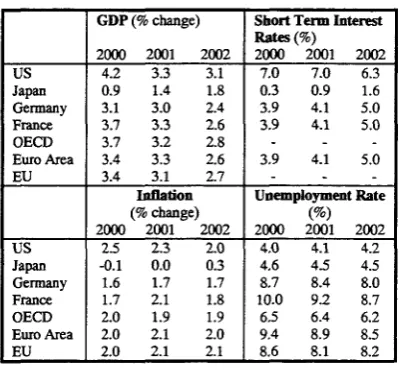
Table 1: Forecasts of International Main Economic Indicators; 1999-2001
us
Japan Gennany France OECD Euro Area EU
US Japan Gennany France OECD Euro Area EU
GDP (% change)
2000 2001 2002 4.2 3.3 3.1 0.9 1.4 1.8 3.1 3.0 2.4 3.7 3.3 2.6 3.7 3.2 2.8 3.4 3.3 2.6 3.4 3.1 2.7
Inflation
(% change)
2000 2001 2002 2.5 2.3 2.0 -0.1 0.0 0.3 1.6 1.7 1.7 1.7 2.1 1.8 2.0 1.9 1.9 2.0 2.1 2.0 2.0 2.1 2.1
Short Term Interest Rates (%)
2000 2001 2002 7.0 7.0 6.3 0.3 0.9 1.6 3.9 4.1 5.0 3.9 4.1 5.0
3.9 4.1 5.0
Unemployment Rate
(%)
2000 2001 2002 4.0 4.1 4.2 4.6 4.5 4.5 8.7 8.4 8.0 10.0 9.2 8.7 6.5 6.4 6.2 9.4 8.9 8.5 8.6 8.1 8.2
Data Sources:
Fraser of Allander Institute, Bank of England Quarterly Economic Bulletin, Barclays Economic Review, Financial Times, IMF World Economy, National Institute Economic Review, OECD Economic Outlook, and various others.
Europe
and March. GDP growth has also had a considerable stimulus from investment as it has grown by 4.7% over 1999 as a whole. Trade made a strong contribution to GDP growth in 1999q2 & q3 but in 1999q4 it was small and negative. Growth for 1999 as a whole was 2.4% (slightly below the 2.7% seen in 1998). Both German and Italian growth is slower than the Euro Area as a whole and this is attributed to their greater exposure to emerging markets where the slowdown adversely affected the contribution of trade. Both domestic demand and net trade are expected to grow and contribute significantly to GDP.
Inflation was 2.1% (harmonised basis) in the year to March 2000 up from 0.9% in the year to June 1999. In April 2000 inflation was 1.9%. Core inflation shows little change however. The ECB raised interest rates in March and April by 500 points to stand currently at 3.75%. A further increase in June left European interest rates at 4.25% again because of upside risks to price stability. M3 growth for the Feb-April 2000 period was 6.3% compared to 5.9% in Jan-Mar 2000. Another factor in the decision was the increase in private sector credit. The Euro Area unemployment rate was 9.2% in April, down 0.3% from February 2000. This is its lowest level since October 1992. Unemployment has been on a downward trend since August 1997. There are indications in Germany, in particular, that real structural changes are taking place in the labour market. Employment growth was 0.4% in 1999q4 and preliminary data suggests similar growth in 2000ql. The Euro has continued to depreciate since the beginning of the year but lately there has been a slight appreciation against sterling. In 1999q4 the Euro Area current account surplus was 0.6% of GDP and 0.7% of GDP for 1999 as a whole.
Headline consumer inflation fell by 0.6% in February of this year but core inflation only declined by 0.1%. This has been helped by the appreciation in the Yen last year and declining unit labour costs. The Bank of Japan has continued to pursue a 'zero interest rate' policy in order to ease liquidity in short-term markets. Broad money growth has slowed since 1999ql, it was 1.9% in the year to March well below the 3.6% it averaged over 1999. This may reflect the easing of the financial situation where the precautionary demand for money is less and this money could be channelled into investment. The current account surplus for 1999 was 2.5% of GDP and in the last quarter of 1999q4 it was 2.25% of GDP. The March Tankan survey indicated that business confidence continued to improve. Business conditions were in fact in line with expectations for the first quarter of this year. Recently there has been a trend of steadily rising unemployment in Japan and declining payments. Estimates now show that in the six months to February 2000 there has been no change in total earnings whereas contractual earnings rose by 0.6%. Unemployment is expected to remain relatively high but the ratio of vacancies to job seekers has begun to improve.
UK MACROECONOMIC TRENDS
In the first quarter of 2000, the estimate of GDP at
market prices - 'money' GDP - rose by 0.9%.
After allowing for inflation, GDP at constant 1995
market prices grew by 0.5%, compared with 0.8%
in the fourth quarter of 1999, 1% in the third quarter, 0.7% in the second quarter, and 0.4% in the first quarter. Over the year to the first quarter,
'real' GDP at constant market prices is
estimated to have risen by 3.1%.
Japan and Asia
Japanese growth remains relatively poor at 0.3% for 1999 but this was better than 1998. After positive growth in the first two quarters of 1999 there have been two consecutive periods of negative growth, the latest showing a fall of 1.4%. All the components of GDP except investment made a negative contribution to GDP in 199q4. This suggests that most of the ¥18trillion fiscal stimulus was spent early in the year and supported private consumption but there has been no long lasting effects. The Bank of Japan does not expect a sustained recovery without first having hard evidence of an upswing in corporate profits. If this were the case then we could reasonably expect growth to accelerate in private non-residential investment. This could in turn lead to increased consumption, employment and incomes.
Gonstmt pries •nnuBl growth M n * on wuntt ojuvttr H I pravifltn y
GDP at market prices
isee
SCURK ONS
Output of the production industries in the first
quarter fell by 0.8% to a level 1.4% higher than the same period a year ago. Within production:
manufacturing output contracted by 0.5% in the
first quarter, output of the other energy and water supply industries fell by 2.7%, and mining &
quarrying, including oil & gas extraction fell by
1.6% above the same period a year ago. The output of the service sector rose by 0.8% in the first quarter. Over the year to the first quarter service sector output rose by 3.2%. The construction
industry experienced an increase in output in the
first quarter of 0.5% with output in the industry rising by 2.2% over the year.
increase of 0.9% in the second quarter, and 1.9% in the first quarter. Government consumption in the first quarter was 2.4% higher than in the corresponding quarter of 1999. Government consumption made a negative contribution of -0.08% points to overall GDP growth of 0.54% in the first quarter.
In the first quarter of 2000, real households'
expenditure (which is consumers' expenditure minus expenditure by non-profit making
institutions serving households) rose by 0.6%. This compares with a 1.1% rise in the fourth quarter 1999, a 0.6% rise in the third quarter, a 0.9% rise in the second quarter, and a 1.8% rise in the first quarter. Spending during the first quarter rose by 3.3% on the same period a year earlier. In the first quarter, households' expenditure provided the main positive contribution to GDP. The contribution to the GDP growth rate of 0.54% was 0.37%. The official seasonally adjusted estimate of retail sales volume for the three months to May indicates an increase of 0.2% over the preceding three months and a rise of 4.2% over the same period a year earlier. The seasonally adjusted household saving
ratio rose to 6.5% in the fourth quarter 1999, from
4.7% in the third quarter, 7.6% in the second quarter and 5.1% in the first quarter. Real
household disposable income (RHDI) rose by
2.1%, on revised figures, in the fourth quarterl999, to a level 3.4% higher than in the corresponding quarter of the previous year. The reported underlying increase in average weekly earnings in the year to April 2000 was provisionally estimated to have been 4.4%, compared to an increase of 5.2% in the year to March and 5.5% in the year to February. In April, private sector earnings grew by 4.4% over the year, while earnings in the public sector grew by 4.7%. There has been a considerable slowdown in the annual growth of private sector earnings, which peaked at 6.9% in January, while public sector earnings have tended to rise gradually from a low of 3.6% in December 1999.
General government final consumption, fell by
0.4% in the first quarter, compared to an increase on revised figures of 1.3% in the fourth quarter 1999, an increase of 0.6% in the third quarter, an
Coaatant price annual growth ralM - on aame quarter In pnivioue year General government final consumption
Real gross fixed investment or Gross fixed capital
formation rose by 0.2% in the first quarter to a level 3.4% higher than in the first quarter of 1999. Investment made a contribution of 0.04% points to overall GDP growth in the first quarter.
• - on M m quarter In pmlous ¥i Gross fixed capital formation
Inventory investment made a small positive
contribution to growth in the first quarter after the marked positive contribution in the fourth quarter. In the first quarter, this aggregate made a positive contribution of 0.13% points to overall GDP growth.
Turning now to the balance of payments. The
current account for the fourth quarter 1999
registered, after seasonal adjustment, a deficit of £2.8 billion. This follows deficits of £3.1 billion in the third quarter, £2.7 billion in the second quarter, £4.2 billion in the first quarter and £1.7 billion in the fourth quarter 1998. For trade in goods and
services the deficit deteriorated in the fourth
quarter to £4.7 billion, from £2.6 billion in the third quarter, £3.1 billion in the second quarter, £5.2 billion in the first quarter and £3.4 billion in the fourth quarter of 1998. For income and current
transfers the surplus rose to £1.9 billion from a
billion in the first quarter and a surplus of £1.7 billion in the fourth quarter of 1998. In the first quarter of 2000, net exports made a positive contribution of 0.29% points to overall GDP growth of 0.54%, reflecting the stronger growth of export volumes (3.2%) compared to imports (1.96%) during the quarter.
UK LABOUR MARKET
Employment and Unemployment
Using the ILO definition, for the quarter to March the level of UK unemployment stands at 1,713,000. This is an absolute reduction of 1.2% over the last quarter and 6.1% over the last year. The unemployment rate for the quarter to March, on the ILO definition, is 5.8% (6.3% for men, 5.2% for women). This aggregate figure compared to 5.9% for the period October to December 1999 and 6.2% for the first quarter of 1999. The UK ILO unemployment rate remains well below the EU average rate, which is 8.7%, though six EU countries, Austria, Denmark, Ireland, Luxembourg, Netherlands and Portugal have lower rates of unemployment, as do the USA and Japan. The April claimant count definition of UK unemployment shows a lower absolute level (1,111,800) and rate (3.9%) than the ILO definition. However, the two measures are qualitatively similar in identifying the consistently falling unemployment which has occurred over the past year.
The persistent increase in UK total employment, which has been in evidence since June 1994, continues. Total employment in the quarter from January to March numbered 27,824,000 and this represents an employment rate of 74.4% of the population of working age. The UK employment rate is at present above every other country in the EU except Denmark. This total employment level represents an increase of 55,000 (0.2%) on the figure for the previous quarter and 284,000 (1.0%) on the figure for the previous year. However, the employment experience in the different sectors of the UK economy varied markedly. Data exist for workforce jobs broken down by industrial sector. The jobs figures differ from the number employed as one person can have more than one job. They are available up to December 1999 and show a fall in the number of manufacturing jobs by 0.2% in the quarter and by 3.2% in the year. Additionally, more up to date figures for manufacturing indicate a further employment loss of 0.2% for the quarter up to March 2000. Over the quarter to December 1999, the biggest proportionate increase in jobs has occurred in agriculture and fishing, although the number of jobs in this sector are down over the full
year. However persistent job increases are identified in transport and communications, finance and business services and in other services.
Whilst the total employment and unemployment figures change in a rather consistent manner, the level of vacancies notified at Job Centres seems to fluctuate around a relatively stable level. The notified vacancy figure for April is 5.6% higher than the figure for January and 8.3% and 6.8% above the figure for April 1999 and 1998 respectively.
Earnings and Productivity
The GB headline (3 months average) annual increase in whole-economy earnings stood at 5.8% in March 2000. This headline wage-inflation figure has been above 5% since December 1999 and hit a value of 6.0% in February. There is significant variation in wage increases between sectors. The headline figure in the private sector, at 6.2%, is well above the increase in the public sector, which stood at 3.7%. This follows a trend that has been very marked over the previous two years where earnings increases in the private sector have, in general, far outstripped those in the public sector. Again, the headline rate of increase in earnings to March in production industries is 4.7% whilst in service industries it is 6.0% (and in private- sector services, 6.6%).
In the fourth quarter of 1999, the annual rate of growth of labour productivity in the whole economy was 1.8%, up from 1.1% in the previous quarter and 0.6% in the fourth quarter of 1998. The figures for manufacturing productivity change are much higher, with the annual increase registering the value 3.8% for the year to March 2000. However, this manufacturing figure has been falling since its recent peak of 5.9% in November 1999. Given the productivity and wage change figures, we observe an annual increase in the whole-economy unit labour costs to the fourth quarter of 1999 of 3.2%. The corresponding increase in manufacturing to March 2000 is 0.7%.
UK OUTLOOK
In terms of the expenditure aggregates, the main cause of the slowdown in growth was the slower rate of growth of household expenditure and total domestic expenditure generally. At 0.41%, the growth of total domestic expenditure was the slowest since the second quarter of last year, which stagnated during that quarter because of an appreciable run down of stocks. In the first quarter of this year, the slowdown in the growth of domestic expenditure was reflected in all of the main expenditure aggregates. However, there was a marked improvement in export performance in the first quarter, which outstripped the growth in imports and contributed positively to overall GDP growth. The changes in the pattern of aggregate expenditures appear to contradict the view that the deterioration in manufacturing performance was the direct consequence of the strong pound, since it appears that the problem was a weakening of domestic rather than external demand. This in turn may also account for the positive contribution to growth of stock building in the first quarter due to the growth of demand being weaker than producers expected.
The slowing in the growth of domestic demand appears also to have produced an effect on the growth of average earnings, which slowed appreciably in February, March and April. The weakening of earnings growth occurred mainly in the private as opposed to the public sector and affected services somewhat more than manufacturing. House price inflation also appears to be slowing, with the Halifax index down 0.4% on April in the three months to May. The annual rate of retail price inflation excluding mortgage interest payments averaged 2.1% in the first quarter, which represents a slight fall on the previous quarter and remains below the 2.5% inflation target. However, retail services inflation rose to 4.2% in the first quarter from 3.9% in the final quarter of last year, while retail goods inflation fell 0.1% in the year to the first quarter. In addition, producer input price inflation rose to 12.9% in the twelve months to May compared to 7.6% in April, while the sterling effective exchange rate fell by 7.5% over the four weeks from early May to June. Nevertheless, given the weakening of domestic demand and the slowdown in overall earnings growth, the decision of the MPC of the Bank of England in June to keep interest rates at 6% appears prudent. However, a further sustained depreciation of the exchange rate is almost certainly likely to provoke the MPC to raise the repo rate again.
The outlook for the UK economy is very much dependent on whether the slowdown in domestic demand in the first quarter is sustained, or whether
it represents a temporary erratic movement. Industrial production rose by 0.8% in April on the back of a surge in output in the energy sector, but manufacturing production continued to fall by 0.2%. Retail sales also fell in April but survey evidence suggests an increase in May. At this stage it is therefore too early to tell from published data, but it seems possible that GDP growth will be stronger in the second quarter than the first.