THE MALAYAN FISHING INDUSTRY
by
Moira Rowland
Australian National University.
i i i
TABLE OF CONTENTS
Page LI ST OF TABLES
LIST OF FIGURES AND GRAPHS
A. INTRODUCTION 1
B. EMPLOYMENT OF LABOUR AND CAPITAL
5
Total EmploymentUnder-Employment and Secondary Occupations Economic Nature of Employment
Capital - Total Value of Capital Invested in Fishing Industry
O"\VTIership of Capital
5
7
11 12 19C. PRODUCTION AND INCOMES
35
Average Incomes
Distribution of Incomes Returns to Capital
Production Inboards
Synthetic Nets Conclusion
35
37
4548
5675
79D. DISTRIBUTION AND CREDIT 80
E.
Kelantan Fish Marketing Scheme 82
Ice and other forms of refrigeration and
preservation
84
Dried fish industry 90
Transport 90
Markets 93
Credit and Co-operatives 95
Scope of co-operatives 97
Beserah co-operatives 97
Repayment of loans 103
East Coast Fishermen's Co-operative Transport
and Marketing Union 104
Credit without co-operatives 105
Conclusion 109
CONSUMPTION
Household Budget Survey Local surveys
Total production figures Dried fish consumption Dried fish prices
Dried fish production Swnmary
Population
Changes in the structure of the population Racial composition of the population
Urbanization
Income growth and distribution of incomes
E. ( c on t in ue d )
Changes in income distribution
Changes in prices of fish, or in prices and availability of other foods
Nutrition and Consumer Preferences Summary of possibly relevant factors
F. FOREIGN TRADE
Production in South East Asia
Consumption in South East Asia and the Far East
Trade in South East Asia
Japanese fishing activities in the Indian Ocean and neighbouring seas
Federation trade Summary
Federation extrepot trade Conclusions
G. CO CLUSIONS
APPENDIX - THE JOINT JAPANESE-MALAYAN CANNING COMPANY
NOTE ON THE SECOND EDITION OF FIRTH'S MALAY FISHERMEN
Capi tal
Co-operatives
Relative earnings of capital and labour Level of incomes
General
BIBLIOGRAPHY
GLOSSARY
Page 147 148 156 158 160 160 160 167 169 170 170 178 181 191
195
199 200 200 200 201 201
202
Table Bl
Table B2
Table B3
Table B4
Table B5
Table B6
Table B7
Table B8
Table B9
Table B10
Table Bll
Table B12
LIST OF TABLES
Employment in the Fishing Industry, Federation of Malaya, Showing Race
Number of Operating Days a Honth for Different Fishing Gears, Kuantan Area
Numbers of Fishing Boats and Gears, 1938-39 and 1959
Fishing Boats and Gears, Prices New in 1939-40 and 1955-59
Range of Capital Investment in Fishing Equipment (Perupok 1938-39)
Number of Fishing Units in Beserah in 1958
Boats and Equipment Belonging to Chinese Towkays, Beserah, 1958
Fishing Units Financed by Fish Dealers in Beserah, 1959
Units of Production in Pompang and Gombang Fishing, Penang Island, 1959 Main Items of Operating Costs for Pompang and Gombang Fishing, Penang Island, 1959
Number and Cost of Fishing Units at Bagan Panchor, 1959
Number and Cost of Fishing Boats at Bagan Panchor, 1959
v
Page
6
9
14
17
20
23
24
24
26
27
28
28
Table B(a)l Cost of Boats in Kelantan and
Trengganu, 1940 31
Table B(a)2 Cost of Nets in Kelantan and
Trengganu, 1940 31
Table B(a)3 Cost of Boats Used at Beserah, Pahang,
in 1958 32
Table B(a)4 Cost of Boats O'wned by Chinese Towkays
at Beserah, 1958 32
Table B(a)5 Cost of Boats in Kuantan Area 32 Table B(a)6 Cost of Motors in Pahang, 1958 33 Table B(a)7 Cost of Nets in Beserah, 1958 (from
Sallehuddin Bin Mohammed 33
Table B(a)8 Cost of Nets Owned by Chinese Towkays
at Beserah, 1958 34
Table Cl
Table CJ
Table c4
Table C4a
Table C4b Table C5
Table c6 Table C7 Table C8
Table C9
Table C10 Table Cll Table C12 Table C1J Table c14
Table C15
Table c16
Table Dl
Table El Table E2 Table EJ Table ELt-Table E5
Table E6 Table E7
Distribution of Fishing Incomes in Perupok, 19J9
Federation of Malaya - Monthly
Landings (in Piculs) of Marine Fish in 1959 - by States
(Fisheries Report for 1959) - Landings in Piculs, 1959
Returns to Capital in Pompang and Gombang Fishing, Penang Island, 1959
Page
J8
44
46
47 Landings per Fisherman by State 48 Federation of Malaya - Fish Landings
and Boats Employed in Fishing 49 Different Series of Production Figures 50
Fishing Boats 52
Federation - Trade in Marine Engines,
1958-62 57
Federation of Malaya - Numbers of
Inboard and Outboard Motors 58
Fishing Boats; Fishermen 60
66
Production per Fisherman 67
Landings at Federal Ports in Tons 68 Federation of Malaya: Fishing Gears,
by States, 1955 and 1959 72
Trade in Fishing Nets, Federation of
Malaya, 1962 76
Federation Trade in Fishing Nets,
1958-62 78
Proportion of Fish Dried, Salted and
Otherwise Processed 89
Value of Fish Consumption 115 Fish Consumption by W-eight 115
Average Household Size 116
Fish Consumption per Capita by Weight 116 Classification of Population by Race
and Size of Locality 117
Private Households by Race 117
Table E8 Table E9 Table E10
Table Ell
Table E12
Table E13
Table E14
Table E15
Table E16
Table E17
Table E18
Table E19
Table E20
Table E2l
Table E22
Table E23
Table E24
Table E25 Table E26
Total Consumption of Fresh Fish Total Consumption of Fresh Fish Incomes, Fish and Other Consumption in Beserah
Income Group - Monthly Income in Dollars
Fresh Fish Supplies, Federation, 1957, 1958 and 1959
Federation Landings, Marine and Freshwater
Consumption of Preserved Fish, All Kinds
Consumption of Belachan, Quantity and Value
Expenditure on Dried Fish, 1957, Federation
Imports and Exports of Dried Fish, Federation, 1958
Annual Averages for 1957, 1958 and 1959 of the Average Monthly Retail Market Prices for Dried Fish in the
Federation
Dried Fish Supplies, Federation, 1958 and 1959
Supplies of All Kinds of Fish, Federation, 1957 to 1961
Average Monthly Consumption of Meat, Poultry and Eggs, by Quantity
Income Distribution of Households in Budget Survey
Extra Fish Consumption Resulting
from Urbanization, 1957-82 Consumption of Fish and Other
Animal Proteins, Asia and Far East Annual Average Retail Price of Fish Wholesale and Retail Prices for Fresh Fish, Singapore
Table E26a Prices in 1960 Compared with those
vii
Page 120 121
124
125
127
128
129
13 0
131
132
132
134
135
140
141
143
144 149
150
in 1957 and 1959 151
Table E27 Household Expenditure on Cereals and Cereal Products as Percentage of
Page Table E28
Table E29
Table Fl Table F2
Table FJ
Table F4
Table F5
Table F6
Table F7
Table F8
Table F9
Consumption of Main Animal Protein Foods
Annual Average Retail Prices of Meat, Poultry and Eggs, Federation 1959-62 Catches (Live Weight), 1955-62
Catches in South East Asia and Neighbouring Regions
Increases in Fish Catches and Population, South East Asia and Neighbouring Regions, 1957 to 1961 Fish Available for Human Consumption and Protein Content of National
Average Food Supplies, Far East
Fish Available for Human Consumption and Protein Content of National
Average Food Supplies, Selected Countries, 1957-59
Consumption of Fish in Asia and the Far East
Imports and Exports of Fish, Selected Asian Countries, 1961
Summary of Federation Fish Trade, 1958-62*
Federation Fish Trade 1958 and 1962, Chief Commodities - Net Imports and Exports, and Terms of Trade - from Tables FIO-14
Table FIOa Federation Fish Trade, 1958
Table FIOb Federation Trade, 1962; Imports,
154
155 161
162
164
166
168
170
177 182
Exports and Net Imports by Commodities 18J Table Fll Federation Trade by Countries,
Value Only, 1958-62 184
Table F12a Federation External Trade: Imports
by Commodities, 1958-62 185
Table F12b Federation External Trade: Exports
by Commodities, 1958-62 186
*
Table F1Ja Federation 1958 Imports: Chief Types and Sources
ix
Page
187 Table F1Jb Federation 1958 Exports: Chief Types
and Destinations 188
Table F14a Federation 1962 Imports: Chief Types and Sources
Table F14b Federation 1962 Exports: Chief Types
189
and Destination 190
Figure Cl
Figure C2
Figure CJ
Figure Fl
Figure F2
Figure FJ
Figure F4
LIST OF FIGURES
Federation Fish Landings -Employment in Fishing Federation Fish Landings -Number of powered boats
Federation - Monthly Landings of Fish
Sources of Federation Imports of Fish, 1958 and 1962
Destination of Federation Fish Exports, 1958 and 1962
Types of Fish Imported by Federation, 1958 and 1962 Types of Fish Exported by Federation, 1958 and 1962
54
55
172
17J
174
A. INTRODUCTION
The fishing industry of the Malay States has
inspired investigations since the end of the nineteenth century. The earliest students may.have been more
interested in the picturesque fishing methods used by the Malays, but since D.G. Stead wrote his report for the Colonial Research Committee in
1923
the studieshave been mainly economic in nature and directed towards finding means to improve the industry for one r eason or another. The most important work was the study made by Raymond Firth just before the Second World War, and
although primarily an anthropological study i t is of major economic value. A short handbook was brought out
on the occasion of the inaugural meeting of the Indo-Pacific Fisheries Council held in Singapore in
1949.
In1955
an official Committee to Investigate the Fishing Industry produced its report and recommendations. At the moment a long awaited enquiry into the marketing anddistribution of fish is being carried out with the help of a Canadian expert under the Colombo Plan.
Since
1955
there have been also several small scale studies into particular fishing localities. One group(largely but not entirely concentrated on Beserah, in Pahang) was carried out by students of the University of Singapore, and another (on Panchor in Perak, on the West coast) by the Rural and Industrial and Development
Authority; while Dr T.M. Fraser of Cornell University published a book on a Malay fishing village in south Thailand, and a short article on a village in Johore was published by Y.L. Lee in the Journal of Tropical
Geography.
The twin problems of the fishing industry have always been and are s t i l l the poverty and indebtedness of the fishermen, and their low per capita production. The fishermen are often indebted to fish dealers, and are obliged to sell their fish to them at low prices.
The Federation Government has tried to solve these related problems by encouraging co-operatives and by providing capital for the purchase of boats, engines and
2
gears. What evidence there is, shows that these policies have been successful at least in that a respectable degree of mechanization has been introduced without driving the fishermen into greater indebtedness and dependence on dealers. The official statistics show that there has recently been a marked increase in fish landings, but there is reason to believe that these statistics
exaggerate the increase.
Although per capita production is lower than in many other countries, the Federation is by weight a net
exporter of fish. I t is at the same time a net importer by value. This was of negligible importance when the Federation could rely on i t s exports of rubber and tin
to produce a favourable balance of trade. I t is now however becoming more necessary for minor exports to be profitable, and for many imports to be replaced by home products. The trade in fish is a good candidate for improvement.
Finally, given the continuing rapid growth of
population in South East Asia, there is a need for much greater supplies of protein food. Fish is a relatively cheap source of protein, and one acceptable to people of most races and religions. The Federation!s own consumption of fish may be expected to increase considerably in the next decade, and given Malaya!s favourable geographical position and its relatively well established industry, the country ought to be able to become one of the major fish producers of South East Asia,
This study is an attempt to put together what is known about the present state of the fishing industry in the Federation of Malaya, and to show in wha t
directions i t Cill~ best be developed. The related
problems of the industry are dealt with in the following order: employment of capital and labour; production and incomes; distribution and credit; consumption;
The study is restricted to the Federation, since the Singapore industry is separate and many of its problems are different. The study is also, except in so far as consumption and trade are concerned, restricted to marine fisheries, since the freshwater fisheries are also quite
separate and have their own distinct problems.
References are made throughout to Firth!s book, 1
!Malay Fishermen, Their Peasant Economy!, and i t should perhaps be explained at the outset that although he
included an account of the Malayan industry as a whole, the main part of his book consisted of an intensive study of tile fishing village of Perupok, in Kelantan, the north east corner of Malaya, together with a fairly detailed description of how Perupok differed from other fishing centres in Kelantan and in the neighbouring
states of Trengganu and Pahang. Conditions on the East coast differ in several important respects from those el sew·here; the fi shermen are almos t all Malay s, whereas on the West coast and in the South many of them are Chinesej the East coast consists mainly of long sandy beaches, whereas in the West the coast more often consists of mangrove swamps; partly for this reason the Malay fishermen on the East often have subsidiary sources of income, which are much rarer among the
Chinese in the West; some methods of fishing are common to bo th coast s, large group s wi th up to five boa t s
engaged in fishing together are found in the Northeast but also at Pangkor, the most important centre on the West coast; on the other hand, large and elaborate fishing stakes and screens are found only in the South and West. The economic structure of the industry also varies a great deal from one coast to the other, with a greater proportion of independent fishermen in the
Northeast and a measure of control by dealers in the South and West. Most of the population of Malaya is concentrated in the West, and the East is not only sparsely populated but cut off from the West by jungle and moun tains • Before the war there was no good road
joining the coasts, and only one railway through Kelantan from the Southwest. One final and important difference
1
4
is that on the East coast the Northeast monsoon makes fishing difficult and dangerous i f not impossible, from November until February. On the West coast the Southwest monsoon is much milder, and though different areas or methods of fishing may have different off seasons there is no period during which nearly all fishing stops. I t is unfortunate that no major study of the West coast fishing industry has been published, and that none of the University of Singapore students visited Pangkor.
The University of Singapore studies are referred to frequently in the earlier sections below, and for brevity, references in the text are made only to the name of the student, while full titles are given in the bibliography. References to other books and articles are amplified by footnotes, although titles are also included in the bibliography.
There are also references to official reports and statistics. The Federation Department of Fisheries used to produce a report each year, with detailed statistics of landings and gears, and a commentary on the state of the industry. Most of the commentary, and a few of the figures, used also to be published in the Federation1s Yearbooks. The last available fisheries report is however the one for
1959,
and the1962
Yearbookcontained only a few additional statistics for
1960.
Considerable use is made of the Household Budget Survey, carried out in the Federation in1957
and1958.
Other minor sources of official information are the Federation1s Monthly Statistical Bulletin andSingapore1s Monthly Digest of Statistics, the two recent
Censuses of population, and the annual trade figur es. There are again however, discontinuities in many of the series of figures published, and though these are
discussed in the ap~ropriate sections below, i t is necessary to emphasize here that they exist and that links between series are not absolutely reliable.
Malay words and units of measurement used in the text are listed with their English equivalents in the glossary which follows the bibliography. The detailed explanations of many terms are given in Firthfs book, and there is also a useful glossary in the Handbook on Malayan Fisheries published in
1948.
Dollars areSECTION B
EMPLOYMENT OF LABOUR AND CAPITAL
Total Employment
Firth estimated that the number of fishermen in 1
Malaya just before the war was about 50,000. According to figures published by the Fisheries Department since 1947, the number in the Federation has fluctuated
between 50,000 and nearly 80,000 (see Table Bl).
However, according to the two population censuses, about 60,000 were employed as fishermen in both 1947 and
1957,2 and this may be taken as a mean figure for the postwar period.
In 1957 the total labour force of the Federation (defined as the number of males aged between 15 and 59) was 1,679,000; the number of male fishermen was 59,881, or 3t per cent of the total. 3 Fishing is therefore only a minor occupation in the Federation, but not a negligible one.
4
In the second five-year plan for the Federation i t was estimated that the working force would grow by nearly 340,000 in the years 1961-65. To absorb this growth i t was hoped that jobs would be provided for from 130,000 to 150,000 additional agricultural workers.
Of these, 30,000 were to care for the increased acreage under rice, 35,000 to work in the rubber industry,
45,000 to 50,000 in developing new land, and finally, (increased output of other miscellaneous crops,
1
Firth, op.cit., p.5. 2
59,788 in 1947; 60,628 in 1957. employed in the fishing industry both years: 60,288 and 61,431.
3
The number of those was slightly higher in
According to a paper on the changing industrial
distribution of the Malayan labour force, by G. Jones of the Department of Demography of the A.N.U., the census figures show that the fishing industry
constituted 2.6 per cent of total employment in 1957, although he also quotes a higher figure, 66,000, for all those employed in the industry.
4
livestock, fish and forest products will be accompanied 1
by some rise in employment!. TABLE Bl
6
EMPLOYMENT IN THE FISHING INDUSTRY, FEDERATION OF MALAYA, SHOWING RACE
Year Malay Chinese Indian Other* Total
1947 34,359 13,278 495 57 48,189
1948 5 0 ,312 17,582 474 71 68,439
1949 55,329 19,903 512 404 76,148
1950 56 , 18L~ 20,791 387 293 77,657(5 7 )
1951 51,927 21,560 353 333 74,173
1952 27,630 22,044 532 192 5 0 ,398
1953 37,406 17,893 378 358 56,035
1954 33,679 15,173 388 292 49,532
1955 36,533 24,003 490 186 61,212
1956 35,664 14,366 660 50,690
1957 34,428 14,454 385 176 49,443
1958 33,908 17,110 411 187 51,616
1959 33,350 16,746 301 144 50,541
1960 35,500 17,9 0 0 (4007) 53,800
* Thai, Portuguese and others j mainly Thai. Sources: 1947-54 - Economic Development of Malaya,
IBRD, Baltimore !55 (Malayan fisheries gives rather lower figures for 147).
1955 - Report of the Committee to investigate the fishing industry. !C.L. 1956.
1956, 1957 - Annual Report of Federation (all these reports were themselves using Department of Fisheries figures).
1958, 1959 - Fisheries reports.
1960 - Yearbook of the Federation for 1962, who rounded the unpublished figures supplied by the Department of Fisheries, and omitted any figure for I others! j the one here has been obtained by subtraction.
I t is not necessarily true that any increased output of fish will be accompanied by a rise in employment;
in the context, i t may be interpreted rather as meaning that provided output is increased, a rise in the numbers employed will not harm those already in the fishing
industry. On the other hand, the fact that there is likely to be a general surplus of workers over the next
2
few years does certainly mean that i t would be rash to
1
For a detailed examination of this part of the plan, see E.K. Fisk, in the Political Economy of Independent Malaya (published 1963), p.172 in particular.
2
[image:15.583.19.553.142.936.2]assume that large numbers of fishermen can be found employment in other jobs.
Table Bl shows that there have been considerable fluctuations in the numbers employed in the fishing industry. This is probably due in part simply to the erratic collection of statistics, but i t also reflects both the fact that some fishermen have other occupations, and also that fishing itself is not necessarily a
permanent occupation. A fall in the recorded employment may mean simply that some who one year both grew rice and fished, decided next year to give up fishing
al together. I t may however me.an that some who had spent all their time fishing found some quite other occupation. A series of figures is therefore hard to interpret
precisely, though i t is evidently an indication of the relative prosperity of the fishing industry. For
example, the fall in employment between
1951
and1952
was almost certainly connected with the rubber boom in the later stages of the Korean war, which encouraged many Malay fishermen to devote themselves to rubber t applng. . 1Under-Employment and Secondary Occupations
A considerable number of fishermen have a secondary employment of some kind. They find this necessary to supplement their low incomes, and possibly because fishing is in many cases not a full-time occupation. On the east coast, large-scale fishing is interrupted by the monsoon, and although the south west monsoon is less disruptive there are s t i l l good and bad fishing seasons on the south and west coasts.
Sometimes i t is impossible for fishermen to change from one method to another as the seasons change. For example, according to Yahya bin Haji Kalib, the mengail
2
parang fishing at Beserah Pantai stops between April
1
Except in census years the employment figures (and most other official statistics) are based on reports from fisheries officers in the different states. These
officers are each in charge of very large areas, so that i f for example one officer is replaced by a much more zealous one, i t could have a considerable effect on the total recorded employment.
2
Mengail parang - hand line fishing;
and October, so these fishermen may join mengail unjang groups since unjang fishing stops only for the monsoon. In Kuala Sedili Besar, any of the Trengganu fishermen stranded by lack of money when the pukat sudu fishing
stops for the monsoon may join the local pukat payang
fishermen who at this season migrate even further south
to Singapore. At Kukup on the south west coast the
good season is during the north east monsoon, and the
rest of the year catches are only half as heavy and
many fishermen may scarcely put to sea at all during
8
the south west monsoon from May to September. At Panchor the good season is from September to February, but even
the rest of the year catches do not fall below half the
peak November figure. On the east coast Firth noted
that although individual catches might be good during the monsoon, there were many days when even the most
enthusiastic fishermen would not go out; Ubaidilla fowLd
this s t i l l true in Beserah in
1956,
even though accordingto fisheries reports the increased use of engines has
meant greater continuity of fishing throughout the
monsoon.
Apart from interruption by seasons of the year, some
kinds of fishing may also be stopped during certain phases
of the moon. Pukat dalam (gill nets for mackerel) can
only be used about four months of the year when mackerel
are plentiful enough; but in Rusembilan at least their
use is also restricted to moonless nights, when the
f ishermen can see where the fish are by Ithe glow created as they swim through the highly phosphorescent waterl •
In Kukup, fish pots are used mostly during the full moon and jaring hanyut (drift net) at the new moon. Y.L. Lee says that those who practise both methods may therefore
fish for about 20 days each month, but that in fact only
8
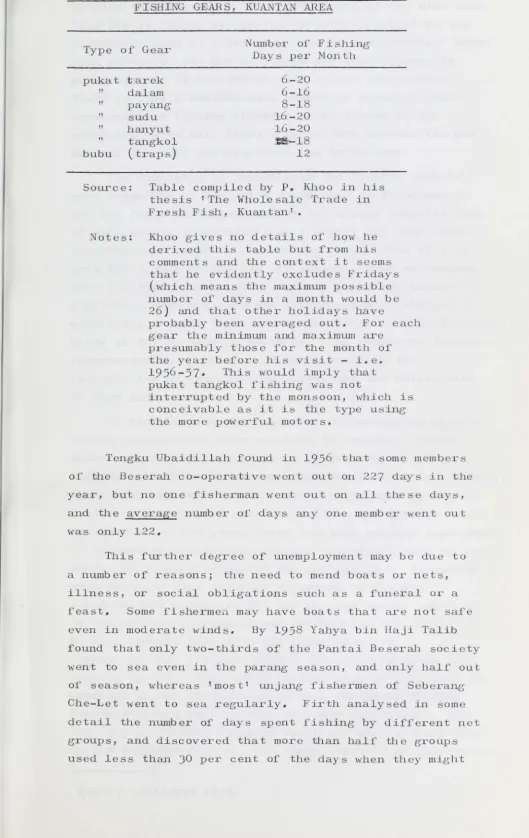
men make any extensive use of fish pots. Philip Khoolists the number of days a month when various kinds of fishing may be practised in the Kuantan area (see
Table B2) and found that even in the best months, gears
were used on l i t t le more than two-thirds of the
TABLE B2
NUMBER OF OPERATING DAYS A MONTH FOR DIFFERENT FISHING GEARS, KUANTAN AREA
Type of Gear Number Days per Month of Fishing
pukat tarek 6-20
6-16 8-18
"
"
"
"
"
bubu
dalam payang
sudu hanyut
tangkol ( traps)
16-20 16-20 ~18
12
Source: Table compiled by P. Khoo in his thesis IThe Wholesale Trade in Fresh Fish, Kuantan l •
Notes: Khoo gives no details of how he derived this table but from his comments and the context i t seems that he evidently excludes Fridays (which means the maximum possible number of days in a month would be
26) and that other holidays have
probably been averaged out. For each gear the minimum and maximum are
presumably those for the month of the year before his visit - i . e . 1956-57. This would imply that pukat tangkol fishing was not
interrupted by the monsoon, which is conceivable as i t is the type using the more powerful motors.
Tengku Ubaidillah found in 1956 that some members of the Beserah co-operative went out on 227 days in the year, but no one fisherman went out on all these days, and the average number of days anyone member went out was only 122.
This further degree of unemployment may b due to a number of reasons; the need to mend boats or nets, illness, or social obligations such as a funeral or a feast. Some fishermen may have boats that are not safe even in moderate winds. By 1958 Yahya bin Haji Talib found that only two-thirds of the Pantai Beserah society went to sea even in the parang season, and only half out
[image:18.577.20.550.95.934.2]lO
theoretically have gone out fishing, and none of the
groups used as much as 50 per cent of the days available. He also estimated that about two-thirds of the time loss
twas due to causes beyond the effective control of the fishermen! such as illness or need to repair nets. Less than one-third was due to !their own inefficiency in management or to conformity with social conventions!. There is thus a considerable amount of apparent under-employment in fishing villages, even though of the
estimates above only Firth!s takes into account the net mending and boat caulking that has to be done.
The Committee to Investigate the Fishing Industryl were I appalled at the utter dependence of fishermen on
the sea for a livelihood and at the almost complete lack of alternative employment I i only rarely did they Imeet fishermen who owned or rented land or who were able to work for a wage during the off season . . . even net-making, once a flourishing industry in many areas has almost completely died out with the introduction of cheaper
manufactured netsl (this particular point will be discussed below in the section on capital). The Committee therefore recommended the provision of land, possibly the
introduction of cottage industries, and the cultivation of fish and cockles.
In fact however the degree of dependence on fishing varies considerably from one area to another. Firth himself estimated that at least 20 per cent of the
fishermen in Perupok had some subsidiary source of income, apart from any interest on capital or returns on leased land or coconuts (see op.cit., p.79). Moreover at least
one-quarter of the women there had some regular employment or occupation and another quarter occasional work of some kind. He roughly estimated the ~rag~ (i.e. including
even those in fact entirely dependent on :fishing)
supplementary income as $25 per man per annum, added on to the average fishing income of $llO (pp.278, 28 5). He also remarks that with the improvement of
communications, villages tended to specialize more in fishing (p.67). This point is also made by Y.L. Lee, who comments on the differences between the Malay fishing kampongs with a multiplicity 0:[ other occupations, and
the Chinese fishing villages which are more closely bound to the monetary economy, and where there is no cultivation.
1
(This is partly geographical; he notes that on the west coast the Malay kampongs are on the landward side of the mangrove swamps, the Chinese villages built out over the water) . However, in Panchor Lim Peng Kin noted that JO households, those of towkays or fishermen owning their own equipment, kept pigs; and two dealers and two of these independent fishermen kept cafes. Otherwise there seem to have been no secondary occupations, and
90
per cent of the population was entirely dependent on fishing.Yoong Swee Yin found that the Chinese pompang and gombang fishermen of Batu Maung lacked any alternative employment in the parts of the month when they could not fish. The studies of Malay villages do show a less complete
dependence on fishing. Yahya bin IIaji Talib mentions that some (no exact figure is given) of the Beserah line fishermen have opened up land at Cherating about
5
miles north, and spend part of their time working there. He also comments that of the 71 members of the Pantai Beserah co-operative, 18 no longer fished at all, some were now employed by the local towkays and some had other work. Philip Khoo, writing about the wholesale fish trade of Kuantan, lists the numbers of fishermen in each village in the area, and for Beserah gives IJOJ,70
part-time l • Mohammad Noor does not mention what proportion of his Trengganu fishermen were solely dependent on fishing, but Wan Sidik found that of the79
Trengganu fishermen he interviewed in Kuala Sedili Besar, 44 had come 1 to be able to fish most of the year round 1 ,15
for lalternative employment',9
for 1 subsidiary employment 1 and theremaining 11 for non-economic motives, as for example a desire to travel. Ten of the
79
had padi plots inTrengganu, but a total of
19
gave their main occupation as padi planting and only 48 were Imainly fishermen l • In Rusembilan, Fraser found that nearly every family had itsown padi field.
Economic Nature of EmploLPent
The ease wi th which a fisherman can change his
To take an obvious example, a line fisherman needs 1
only a small boat and can work alone. A net fisherman however is never entirely independent of others, even though he owns a boat and a section of net. The nature
12
of his dependence may vary from a very elastic kind of co-operation; as in Kalentan before the war, and as s t i l l
2
in parts of Trengganu, to employment for a wage as in Panchor. And fishermen working on the larger fish traps and fishing stakes usually do so for wages.
The independent fisherman who owns his own equipment is likely to find i t easy to manage other work at the same time, but he may be hampered in leaving the industry if he cannot dispose of his investment without loss.
Conversely, a fisherman working for a wage may have difficulty in taking on other work, but can change his occupation with as much or as l i t t l e trouble as any other wage earner.
The fishermen who 'borrowl boats and equipment from fish dealers and who are in return obliged to sell them their catches, come into a different category again. The nature of the relationship between them and the dealers
is discussed below in Section C. Here i t is only
necessary to comment that although they are free to take up a subsidiary employment, and technically free to change
their occupations altogether, they may in fact be under strong moral pressure to stay working for a dealer to whom they are in deb t.
Total Value of Capital Invested in Fishing Indus~ Firth estimated that in the period
1938-39
theinvestment in fishing boats and gear in Malaya was about
2t
million dollars at current values.3
His estimate1
Although in parts of Malaya several line fishermen go out together in larger boats.
2
See Firth, Chapter
4.
same kind of system in3
Mohammed Noor found much the Trengganu.
P.9.
He also quotes an estimate in 1931 of over 2 million dollars in the Straits Settlements and Federated Malay States, but said !this estimate was based on new values and is therefore almost certainlyalmost certainly included the Unfederated Malay States (Kelantan, Trengganu, Perlis, Kedah and Johoreil in his statistics for boats and equipment2 he gives figures for Kelantan and Trengganu for 1939, together with those for
the Straits Settlements and Federated Malay States for 1938. He adds an estimate of the number of boats in Perlis, Kedah and Johore, but not of the gears there.
Recent estimates of the numbers of boats and gears are available for the several States of the Federation, but not for Singapore, which was included in the Straits Settlements until 1945 and therefore also included in Firth's total value. Therefore in order to compare the value of boats and equipment in 1938-39 with the value in recent years, it is necessary to make some deduction from the earlier figures to exclude Singapore. Table B3 below gives the number of fishing boats and gears in 1938-39 and in 1959, showing for the earlier years
Singapore and the rest separately. I t will be seen that Singapore had about
7
per cent of the boats, and roughly 8 per cent of the number of sets of gears. There is no way of analysing further the number of boats, since no details of them are given, but account must be taken of the fact that the 8 per cent of total gears includes a very high proportion of the total traps, and a very lowproportion of trap nets. Both traps and trap nets are relatively very expensive gearsi most of the Singapore traps were kelong, which are particularly expensive,3 and about half the non-Singapore trap nets were pompang and gombang, which are less so (see below). Since the Singapore percentage for both categories together is l I t , i t is perhaps sufficient to estimate that the Singapore percentage of the valu~ of total gears was 10 per cent rather than 8 per cent.
1
He later, p.15, uses the same estimate of 2t million for boats, nets and other gear.
2
Appendix 2, pages 318-9.
3
According to Burdon, in 1950 a large kelong cost $35-40,000 to construct, yearly maintenance was about a quarter of that, and the trap lasted only five
14 TABLE B)
NUNBUlS OF FISHING BOATS AND GEAR.§.z..-!2.:lli..::-22 and 1959
1938-39 1959
Including Singapore Total With With
Singapore No. ')0 of Outboards Inboards
Total No. No.
Boats 19,500 1,315 7 22,263 4,761 3,12)
1938-)9 1959
Including Singapore Excl. Total Johore, Perlis and
Gears Singapore No. % of Johore Incl. Kedah
No. Total Perlis Johore
No. 'f, of
and Perlis
Kedah and Total
Kedah
Seine nets 1,900 109 6 1,891 2,005 278 14
Gill nets
(pukat dalam) 206
7~
Drift nets 2,739 198 2,541 4,986 948 19
Lift nets 21) 21) 559 85 15
Trap nets ) (Bag nets 2,059 260 1)
(ambai, pompang,
Barrier nets 214 157 73
gombang) 2,036 3 0 2,03)
Traps (belat, Fishing
kelong, other) 1,8)6 397 22 1,440 stakes:
large 668 323 48
small 1,335 418 31
Traps and
pots 467 90 19
Long lines 926 31 3 895 Lines 4,657 714 15
Shellfish
collection 2,296 19 1
Push nets 626 35 6
Miscellaneous 487 85 17 402 654 41 6
[image:23.569.11.539.16.776.2]To make an accurate calculation for Singapore, i t would be necessary to know what part of investment can
be ascribed t 0 boat s and what part to gears. In his
quite separate calculation of the capital invested in fishing in Kelantan and Trengganu, Firth estimatedl that fishing boats and their gear (e.g. sails, paddles and so
on) were worth $434,000, and that nets, traps and lines
were worth $182,800; so boats made up about 70 per cent
of the total, and gears only 30 per cent. On the other hand, there were few expensive fishing stakes in this north eastern area, so over the whole country gears would
probably make up more of the total, say 40 per cent. For our present purposes the exact distribution is not important; i f we assume that boats make up rather more than half, we can estima te that Singapore I s share of
the total value would have been nearer 8 per cent than
2 9 per cent.
The exclusion of Singapore gives 2.3 million dollars as the value of boats and gear in the rest of Malaya in
1938-39. changed.
Between then and 1959, numbers and prices both The number of boats seems to have increased quite substantially, from 18,000 to 22,263, or by
24 per cent. 3 I t is impossible to say how much the
number of gears has increased. As can be seen from
Table B3, the categories are not all the same in the two
periods, and several categories were probably excluded
from Firth's Table altogether (for example, he lists 'long lines ' but no other lines); moreover, where the
categories do seem comparable, any increase could be
largely accounted for by the earlier exclusion of Perlis,
1
P.56.
2
That is giving a heavier weight to the 7 per cent of the
boats and less to the 10 per cent of the gears; there is the fur ther point tha t in calculating th e tot al value we assume Firth included an estimate for the gears of Perlis, Kedah and Johore, and i f these had been included in his
statistics of gears, the Singapore percentage would have been even lower.
3
The figure 18,000 included an estimate of 1,900 for
Kedah, Perlis and Johore, which would give them 10 per cent of the total; in 1959 they had 24 per cent. I t is
unlikely that their relative number would have increased
quite so sharply, and the 19J8-J9 figure is therefore
probably an underestimate. This does not however affect
[image:24.564.17.543.64.935.2]16
1
Kedah and Johore. The number of l i f t nets also seems to have risen considerably, but Firth1s figure of 213 for the whole country is exactly the same as tbe total he obtains for Kelantan and Trengganu, whereas these two states had only 337 out of the 1959 total of 559; so there has probably been a change in definition. I t is safest to assume that gears have increased proportionately to
2 boat s.
Table B4 shows the prices quotes by Firth for new boats and equipment in 1938-39, and the comparable prices
in the late 1950s. I t will be seen that, in rough
terms, the prices of boats increased by about 4t times, and the prices of equipment about 5t times. 3 However there is reason to believe that there are now relatively more large boats used with motors, and we may therefore
take the average price to have increased about 5 times. If we assume that of the original 2.5 million estimate for 1939, 1.5 million (60 per cent, see above) was for boats and the rest for gears, then, excluding Singapore,
the figures would be 1.4 million dollars and 0.9 million dollars. The corresponding figures for 1959 would be 8.7 million dollars and 6.1 million dollars,4 or a total of 15 million.
1
For example, traps and trap nets totalled 3,473 in 1938-39, and 4,743 in 1959, but of the latter 1,248 were in Perlis, Kedah and Johore, leaving only 3,495 in other states, which would mean an increase of under 1 per cent. Similarly, the number of seine nets has risen from 1,891 to 2,005, but of the latter 278 were in Perlis, Kedah and Johore, so the total elsewhere seems even to have fallen.
2
An alternative would be to assume that they had
increased only as much as the number of fishermen has, which would be by about 12 per cent; Firth estimated that there were 50,000 fishermen in 1938 (p.5) and we can deduct 4,000 to 5,000 for Singapore.
3
Unfortunately Firth does not include average prices of trap nets, since these were rare in Kalentan and Trengganu; these are such expensive items that the change in their prices should in fact be heavily
weighted, but we shall have to assume that they changed at about the same rate as the other types of gear.
4
5.5-FISHING BOATS AND GBARS: PRICES NEW IN 1939-40 AND 1955-22
Boats
Perahu payang
Kolek buatan barat
Kolelr. - large smaller
Kueh - 'caamon 1arge'
(largest) small Selr.ochl smaller Bngines Outboards Inboards Gears
Drift nets puka t hanyu t Gill nets
pukat da1_
Seine nets pukat tarelr.
pukat payang pukat sudu
Lift nets pukat takur
(tangko1) 1939-40 S JOO-500 200-JOO 250-400 120-200 100-150 15 0 -200 50
150
50
4 h.p.
5t-7t
Jt
h.p. 6(inboard and large boat together)
85
200
15 0 -400 (Kel. -1,000) 100-500 100-250 200 1955-59 $
1, JOO, 1,500
1,000
- 1,000 500
800, 1,000
350 1
600, -800 ~ 200-, 2J5 ~ 400, 600
850, 450-750 600-1,750 700 1,188 2,0001 1,900 J,OOO 5,000
450 , 800
900, 800
1,150 , 1,200
1,200, l,J5°, 1,000, 1,200,
1,200, l,JOO
Sources: The 19J9-40 figures are taken from Firth, pp.48 and 49.
1,500
l,J50
The 1955-59 figures are based on estimates made in the University
of Singapore theses. For details, see tables in text below;
and also Annex tables B(a) J and 4.
18
By 1959 there were also 4,761 outboard motors and
3,123 inboards. From the 1959 statistics of external trade
for the Federation,l one can deduce an average dock-side price of $700 for outboards and $1,87 0 for inboards.
There are however various references in the local
statistics (see Table B4 and the notes to it) to outboards of four horsepower costing $LI-OO or $600, and slightly
larger ones costing up to $850. A small inboard costing
only $1,188 is also reported, but from the few rei'erences in R.I.D.A. reports i t seems that around $2,000 would buy
a 6 h.p. motor, though i t might cost more to adapt a boat to take it. From detailed statistics for mechillLized
boats in 19572 i t can be calculated that the average
1 1
horsepowers at that time were 72: and 172 for outboards and
inboards respectively. This would imply that the trade
figures underestimate the cost prices, and in any case the retail price would be higher than the c . i . f . landed price.
Firth used as current market value ta l i t t l e more than half the present price of acquiring this equipment in a new state l , and we may in the same way take the current
value of outboards as averaging $500, and of inboards as $1,500. 3 The to tal value of mo tors was therefore probably
about $7 million in 1959, $2.5 million for outboards, $4.5
million for inboards.
Another factor which ought to be taken into
consideration is the change to using synthetic nets;
according to the fisheries report for 1959 Ithe use of
synthetic fishing by lines and netting has shown a
remarkable increase, and in the west coast synthetic drift
nets have almost completely replaced ramie and cotton nets
in the main drift net fleets. A similar process has
recently started in the east coastl. And according to the
1958 report these synthetic nets I although initially more
expensive are more durable, stronger and require less
maintenance l than the cotton or ramie ones. Unfortunately
1
In 1959, 988 marine diesel engines were imported, with a
total value c . L f . of $1,846,3L~Lt_ ; and 1,072 outboard petrol or kerosene engines were imported with a total value of $758,032.
2
Unpublished.
3
Outboards have a very short life; three years, according
to some reports. They may however go on being used after
their market value has fallen very close to zero. We can
only place this factor against the probability that the
trade figures underestimate the price of a new motor,
especially as the smaller outboards imported may be used
there are no estimates available of the cost of these nets ( i t will be seen that most of the prices quoted in Table B4 are for 1958 or earlier) - trade statistics are no help since they give only the weight of nets of each kind imported, and not the number of nets, so that there is no way of telling how the weights of the two kinds
compare. Nor is there any way of telling how far lishermen now rely on one synthetic net where before they needed to have two or more cotton nets - so that they could s t i l l fish if one was badly torn.
,vas
The total capital invested in boats and gears in 1959 therefore of the order of $22 million. l I t is worth comparing this increase in capital invested, from $2.3 million to $22 million, or by ten times, with the
increase in the value of landings; Firth put the prewar catch at 80,000 to 100,000 tons, and i t s value tat the wholesale prices received by the fishermen! between $6 million and $8 million. In order to exclude Singapore, we can take the lower limit. The 1959 fisheries report values total landings that year at about $106 million, but this is based on retail prices.2 According to the Committee to Investigate the Fishing Industry the
fisherman might receive 60 per cent of the retail price (other estimates are lower, around 50 per cent), and in that case the value comparable with Firth!s estimate would be about $64 million, again a ten-fold increase.
3
Ownership of Capital
In the north eastern area studied by Firth boats and gears were nearly all owned by fishermen, though not all fishermen owned boats or gears. Table B5 gives the distribution of capital among his sample of 256
fishermen. Ninety-six of them owned no equipment of their own,. eighty-five less than $50 worth, and the rest amounts varying from $50 to over $1,000.
1
If Firth was excluding Perlis, Kedah and Johore from his own estimate (and this is unlikely, for the reason given on page 13 above), then the current estima te should
perhaps be raised to $24 million. 2
There are unfortunately no price series for fish going back before the war, and the only prices quoted by Firth
are by number and not by weight, which makes i t impossible to compare them with published 1959 prices. There were however some cost of living statistics based on 1939 s t i l l published in 1959, and for what these are worth, the cost of food seems to have risen by about four to five times.
3
[image:28.571.11.538.73.933.2]TABLE B2
RANGE OF CAPITAL INVESTMENT IN FISHING EQUIPMENT
(PERUPOK 1938-]21
Levels of Investment Number of Fishermen
$
at Each Level0 96
1 to 50 85
51 to 100 15
101 to 150 17
151 to 200 5
201 to 250 8
251 to 300 3
301 to 350 6
351 to 400 1
401 to 450 3
451 to 500 6
501 to 600 3
601 to 700 4
701 to 800 2
801 to 9 0 0 0
901 to 1,000 1
1,001 to 1,100 1
256
Note: Reproduced from Table 10 on p.138 of Fir tho
Investment excludes hooks, lines, etc. ,
and personal gear.
Where fishermen used boats or gears belonging to
others, the owner of the equipment was given a share
of the catch.
Firth also noted however that further south, in
Trengganu and Pahang, boats and nets were often owned
20
by Chinese fish dealers (Firth, pp.59-62 and Appendix V),
and in this case the owner would more probably get his
interest and return of principal indirectly through his
monopoly of the purchase of the fish. These southern
areas were however outside the part studied closely by
Firth, and he gave no estimate of the precise
distribution of capi tal.
I t is s t i l l true that in of the boat and gear receives
the north east the owner
1
a share of the catch (and is often a fisherman himself, according to Mohammed
Noor) • On other parts of the coast the owner of capital is s t i l l usually a Chinese fish dealer, and the fisherman
1
Report of the Committee to Investigate the Fishing
receives 'a price for the fish caught which takes into account his (the dealer's) ownership' , l
There are however no data on the present
distribution of capital. Unfortunately even the Beserah studies do not contain enough complete information to permit a table similar to Firth's (Table B5) being prepared for that area. There is however a great deal
of somewhat imprecise description of capital distribution both in Beserah and elsewhere which enables some kind of picture to emerge. In 1956 Tengku Ubaidillah estimated
that the cost of the capital equipment necessary for handline fishing was $305 new, of which $235 was for boat, and the rest for lines, hooks, floats, and jaring
umpan (landing net). A second hand boat could be got for as l i t t l e as $l40, and s t i l l be good for l5 years. The cost of maintenance and depreciation he estimated at
$83, He found that members of the co-operative in Beserah tended to own equipment rather better than the average. Other line fishermen in Beserah might have their own equipment but had to !hire! boats; in Tanjong Lumpur, a small village nearby where there was no co-operative, many owned their own boats but had to hire equipment.
By 1958 Yahya bin Haji Talib found that of the 7l members of the Pantai Beserah co-operative all but l5 owned t eir boats (he reported also that l 8 of the 7l no longer fished at all - but some of these may have
kept their boats and hired them out). These members were engaged in mengail parang (individual line fishing),
which is done close to the shore, so outboards were not needed. At the neighbouring kampong of Seberang Che- Let most line fishing is mengail unjang (group fishing with a lure) which is carried on 5 to 7 miles off shore, so that outboards were used. Therefore of the 65 members of the Seberang Che-Let co-operative society
only 20 had boats, l6 of them with engines. The rest had to hire boats and engines, paying lO per cent of the
catch for each. The co-operatives in both villages were authorized to make loans for the purchase of boats, and in 9 years the Pantai Beserah society had made loans totalling $4,l48 and 20 parang boats had been bought.
l
22
(This implies that boats used in parang fishing cost about $200, which agrees well enough with figures given elsewhere, see Tables B(a)3 and 4 in annex below).
However, the bigger boats used in mengail lUljang fishing cost more than a co- operative could afford to lend, so the only members who took loans for the purpose were
those who could pay the larger part of the cost themselves. In four years three such loans were made, totalling $553
(this gives no indication of the cost of each boat, nor of whether motors were purchased at the same time, though
this is probable). The Pantai Beserah society also made loans totalling $650 for boat repairs and $1,285 for fishing gear, and the Seberang Che-Let society $656 for gear, but no further details are given of these loans.
Sallehuddin bin Mohammed, who was taking part in the
Beserah survey with Yahya bin Haji Talib, largely
confirms the latter!s findings, except that he thought all the boats used in mengail paraJ'lg were user owned; this may simply show that the 15 members of the Pantai Beserah society who did not own boats had all retired from fishing. He adds that mengail parang fishermen who
owned motors retained their sails to economize in petrol costs. Engines cost from $450 to $750 and had a l if e of only 3 years. Maintenance might be $45 a month.
Handline fishermen might use one gallon of petrol a trip, and net fishermen two; sometimes when there had been no catch there would be no money to buy petrol for
the next trip and a loan had to be obtained from the owner of the boat, who was usually a Chinese dealer but sometimes a Malay. The cost of boats depended on
materials, size and workmanship (see aJ'lllex). Maintenance, pain ting and caulking (and a new $10 anchor rope every
two years) would perhaps amount to $30 a year for a large boa t. The lUljang itself, and the floats used in parang fishing, were home-made s t i l l , but he was told that the nets, which used to be made locally from cotton twine made in Trengganu, were now assembled from pieces made in Japan. The Japanese nets were naturally much easier and quicker to assemble but did not last as long as the old kind. Maintenance of the nets (a preparation of tree bark is used for the big nets, and white of egg for the
$2 a year respectively. Repairs and maintenance of both boats and nets were carried out by fishermen (who were not paid for the work, though the jeragan responsible
for the boat might stand them coffee and cakes afterwards), but the cost of materials was met by the o"mer.
Of the boats and nets used in net fishing in Beserah, Sallehuddin bin Mohammed found that 30 per cent were
user- owned, 10 per cent borrowed from Malay fishermen, and 60 per cent borrowed from towkays. As there were 59 (see Table B6 below), this probably means that 18 were user- owned, 6 and 35 borrowed from Malays and
towkays respectively. (There is some ambiguity, however, as pukat tarek and pukat dalam are usually operated with the same boats by the same group, and also because three boats are used with pukat sudu).
TABLE B6
NUMBER OF FISHING UNITS IN BESERAH IN 1958
(both Kampong di Pantai Beserah and Seberang Che-Let)
-Number Type Number of Men
in Crew
Note:
61 Mengail Parang 1
48 Mengail Unjang 3
28 Pukat Tarek 10-lL~
~1~
24 Pukat Dalam 10-14
2 Pukat Payang 15 16
2 Pukat Sudu 15
~1;
2 Pukat Hanyut 3- 5
1 Pukat Tangkol 25 25
Table taken from Sallehuddin bin Mohammed, but last column of figures (in parentheses) are those given for the same nets by Philip Khoo.
Lim Peng Kin, who was studying only the activities of the dried fish dealers (i.e. the towkays) in Beserah, lists the boats and equipment they owned (see Table B7 below). His figures are not consistent with
24
TABLE B7
BOATS AND EQUIPMENT BELONGING TO CHINESE TOWKAYS, BESERAH, .l2..2§
Boats Nets
Number Type Number of Units Type
20 25
5
Note:
Sekochi
14
Pukat SuduKueh 25 Pukat Tarek
20 Pukat Dalam
Payang 5 Pukat Payang
Table from Lim Peng Kin, re-arranged to show boats and nets used together.
The only other thesis bearing on the ownership of capital in the BeserruL area is the one by Philip Khooj this deals with the wholesale fish trade of Kuantan
but in the process gives a certain amount of additional information about equipment (see Tables 2 and J in the annex to this section, and part of Table B6). He says that three of the 10 Kuantan wholesalers lend equipment
directly to fishermen, and he lists units financed in Beserah by !fish dealers! - without specifying whether this means the Kuantan wholesalers or the Beserah
towkays (see Table B8).
TABLE B8
FISHING UNITS FINANCED BY FISH DEALERS IN BESERAH,
1232
Number Type
8 Pukat Tarek
J Pukat Dalam
J Pukat Payang
1 Pukat Sudu
Note: Table from Philip Khoo.
He comments !independent units are uncommon in this areal, though there is apparently a group of west coast
[image:33.555.15.535.18.783.2]I t is impossible to f i t these pieces of information from the Beserah studies into a coherent whole. Some
figures are insufficiently defined and others are mutually contradictory. 1 But i t is clear that in the Beserah area there exist both the systems mentioned by the Committee to Investigate the Fishing Industry, and that in addition a great many of the line fishermen are entirely
independent.
The only University of Singapore study of fishing on the north east coast is Mohammed Noor's on income
sharing in Trengganu, and he does not give details either of the costs of equipment or of ownership, though he
implies that nets and boats often belong to the boat leaders (as indeed was the case there in Firth's day). At Rusembilan, which is in Thailand but is s t i l l fairly representative of the NE Malay villages, Fraser found
that the smaller boats were all individually owned, and of
14
larger perahu kolek(J5'-501)
7
were individually owned, 2 were shared by partners, and5
were owned jointly by their crews. The smaller net s were again individually owned, and the larger kembong nets (called pukat dalam by Firth and others) consist of sections, and each member of the crew was required to supply two.The Trengganu fishermen in Kuala Sedili Besar studied by Wan Sidik o"wned neither boats nor nets, and 'shared' their catches with the dealers who owned the equipment. In practice they were employed by these dealers and even under contract to them.
Conditions on the west coast differ considerably from those on the east. There is unfortunately no recent
study of the relatively very important Pangkor area, and the only University of Singapore study of a west coast village is Yoong Swee Yin's of Pompang and Gombang
1
For example, Lim Peng Kin quotes the Co-operative Department as saying that there were ~955 fishermen in Beserah in
1954,
and that1,175
or 60 per cent of them worked for the towkays. Using Sallehuddin's figures for the number of men employed with each unit, the towkays would seem to have only enough equipment to 1 employ' at the very most915
men. Philip Khoolists Beserah as having
JOJ
fiShermen in1959.
These discrepancies are probably only due to different26
fishing at Batu Maung on the island of Penang. All the
80 fishermen are engaged in operating these two types
of trap. 62, of them are hired warkers, and 18 are owner
-operators owning 27 boats between them. There are also
4 'capitalistsl, who O.ill 13 boats between them but rarely
if ever fish themselves. Of the hired workers only 18
are strictly speaking employed (he means in this context
paid wages) - 9 by 'capitalists' and 9 by owner-operators.
The other 44 work with boats belonging to owners of one
kind or another, and are given shares of the profits (not
of the gross catches). The share to labour is 58 per cent
in pompang fishing and 62 per cent in gombang fishing.
Yoong Swee Yin comments that these sbares are quite high
because 'the tecbnical coefficient of production is very
rigid' (that is, two men are needed to take the sampan
out and collect the fish from the trap, one man could not
do i t by himself and. a third would be superfluous). And
although the trap itself once made is not mobile at all,
labour in the area is very mobile, so unless they are
contented the fishermen will leave and take up some
other kind of fishing. The wages paid to the fishermen
who are actually employed is not given, but the average
earnings for all fishermen are said to be $75 a month
(no evidence for this is shown).
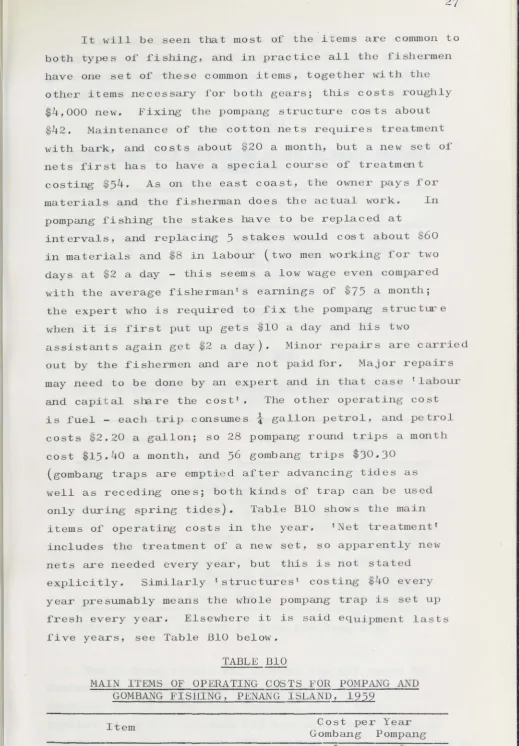
Apart from the boat, which costs $350, a 'unit of
production l includes nets and either floats (for
gombangs, which float) or stakes (for pompangs which
are fixed to stakes) and also a shed. (See Table B9)
TABLE B9
UNITS OF PRODUCTION IN POMPANG AND GOMBANG FI SHING,
PENANG ISLAND, 1959
Nwnber Item Approx. Price Pompang Total Value Gombang
$
$ $10 Nets 15.8 158 158
1 Boat 350 350 350
1 Outboard (4 hp) 600 600 600
1 Shed 500 500 500
Pompang Only
16 Iron Hoops 1. 20 19.20
25 Stakes 6 150
Gombang Only
24 Bamboo Floats 6 144
Both
8 Drying Stakes 6 48 48
Miscellaneous 30 30
Total 3,277.20 3,242.00
Note~ Table from Yoong Swee Yin. Prices are those for
new equipment, which is all the fishermen will