Rochester Institute of Technology
RIT Scholar Works
Theses
Thesis/Dissertation Collections
1997
Optical character categorization: Clustering as it
applies to OCR
Jennifer Greenwald
Follow this and additional works at:
http://scholarworks.rit.edu/theses
This Thesis is brought to you for free and open access by the Thesis/Dissertation Collections at RIT Scholar Works. It has been accepted for inclusion
in Theses by an authorized administrator of RIT Scholar Works. For more information, please contact
Recommended Citation
Rochester Institute of Technology
Computer Science Department
Optical Character Categorization: Clustering as
it Applies to OCR
by
. Jennifer B. Greenwald
A thesis, submitted to the Faculty of the Computer Science
Department in partial fulfillment of the requirements for the
degree of Master of Science in Computer Science
Approved by:
Dr. Peter G. Anderson
Dr. Fereydoun Kazemian
Dr. Stanislaw P. Radziszowski
Optical Character Categorization: Clustering as it Applies to OCR
I, Jeunifer Greenwald, prefer to be contacted each time a request for reproduction is made. Ifpennission is
granted, any reproduction will not be for commercial use or profit. I can be reached at the following
address:
193 Golden Rod Ln.
Rochester, NY 14623
1
.0Abstract
I
appliedclustering
analysisto the
problem ofcreating
tagged
training
data for
opticalcharacterrecognition
(OCR).
The
creation oflabeled
characterdata
by
hand is
a slow andcumbersome process.
My
belief is
that
clustering
methods canbe
appliedto
characterdata before
tagging
it,
allowing
the
operatorto
label
entire groups of characters at once andgreatly
speeding
the time
in
whichtagged
characterdata
canbe
generated.This
thesis
will provideproofofconceptas a
basis for
morein depth
researchandeventually
the
creation of asophisticated applicationutilizing
these
techniques
for
the
generation oflabeled
training
data for
OCR
systems.
Keywords:
Clustering, OCR,
Genetic
Algorithms,
Kohonen
SOM,
K-Means
Table
of
Contents
2.0
Introduction
4
3.0
Theory
4
3.1
K-Means Algorithm
4
3.2
Genetic Algorithms
5
3.3
Kohonen SOM
5
4.0
Description
5
5.0
Experimental Proceedure
6
5.1 Kohonen SOM
6
5.2
K-Means Algorithm
8
5.3
Genetic Algorithm
10
6.0
Results
andConclusions
1 1
6.1 Kohonen
SOM
11
6.2 K-Means Algorithm
13
6.3
Genetic Algorithm
14
6.4
Comparisons
14
6.5 Suggestions
for
Further Work
15
7.0 Appendices
16
7. 1 Kohonen SOM Example Script
1 6
7.2 Kohonen SOM
Drawing
17
7.3 Background Material
17
7.4
Other
Sources
18
7.5 Percentage Correct Calculation Code
18
7.6 Cluster Composition Code
20
2.0 Introduction
My
area ofinterest is
clustering,
specifically using Genetic
Algorithms
(GAs),
the
K-meansclustering
algorithm,
and neural networks as appliedto
the
problemofopticalcharacter categorization.The
problemI
have investigated is
this:
in
the
area ofOCR,
systems arein
place which are capableofdoing
anadequatejob
of
recognizing
text
they
have
been
trained
for.
However,
generating
training
data for
these
systems(often based
on neuralnetworks)
is
time
consuming
andexpensive,
asit
currently
requires ahuman
operatorto
sortthrough thousands
of character samples andlabel
eachonewiththe
characterit
represents.This
paperreportsonsomepreliminary
proofof conceptworkfor
a method whichcouldhelp drastically
reducethe
amount ofhuman
effortinvolved in
tagging
this
training
data.
The
idea is
to
pre-sortthe
sample charactersto
be
tagged.
Once
the
charactersto
be
tagged
are groupedinto
sets oflike
characters, the
human
operatorcanlabel
them
all atonce,
doing
only
afew
incorrectly
classified samplesby
hand.
In
abest
casescenario,
sets of characters whichhave been
clusteredtogether
canbe
putonthe
screenfor
an operator all atonce,
sortedin
order of percentage correlation.I
investigated
using
the
K-means clustering
algorithm,
a genetic algorithm and atype
of neuralnetworkknown
as aKohonen
Self-Organizing Map
(SOM)
to
clusterhandwritten
characterdata.
Each
ofthese
methodshas
shown successin clustering
other simplerdata.
This
paperreportsthe
results ofusing
these techniques
onhandwritten digits
(0-9),
comparing
the
successof each method andindicating
whichis
the
quickest andthe
mostaccurate.I have
not seenany
previous work onthis topic specifically, though
agreatdeal
of researchhas
been done
on whichfeatures
are most usefulto
represent characterdata.
That
workis
somewhat applicablehere,
asthe
choice offeatures is
likely
to
have
animpact
onthe
success ofthe
method.My
literature
searchwas conducted onthe
WWW
andusing the RIT
library's
searchtool
Einstein,
focusing
onthe
keywords
OCR,
geneticalgorithms,
Kohonen
maps,
anddocument
processing.3.0
Theory
3.1 K-means
algorithmK-means,
alsoknows
asC-means
orISODATA,
is
aniterative
clustering
algorithm.In
orderto
clusterasetoffeature
vectorsinto
'n'
classified and
the
processhas
converged.Otherwise,
the
algorithmreplacesthe
old cluster centerswiththe
new meanvalues,
returnsto the
distance
calculationstep,
and carries onfrom
there.
The
success ofthis
processis
reliantonthe
distance
metricused, the
features
chosen,
andthe
initial
cluster centers chosen.3.2
Genetic
Algorithms
Genetic
algorithms are a product ofbiologically
based
computing.A
good solutionto
a problemis found
by
randomly generating
alarge
population of possible solutions(generally
encodedin
astring
ofnumbers,
often abinary
string),
evaluating
each ofthem
by
a problem-specificfitness
metric,
andthen
'mating'the
better individuals
to
make children.This
process repeatsthrough
alarge
number ofiterations
and,
if
all goeswell,
produces anindividual
atthe
end witha
very
goodfitness
rating
whichis
a correct solutionto the
problem.As
somuch ofthe
process
is
based
on randomnumbers, that
randomness can oftenbe
the
life
ordeath
ofthe
process.
A
genetic algorithm which performsquickly
and well with one random seed might never convergeat all with adifferent
one.3.3 Kohonen
Self-Organizing
Map
A Kohonen SOM
is
a variation on a neural network which canbe
representedgraphically
as a
two-dimensional
grid of nodes.The
gridis
initialized
to
a set of random weight values.As
the
gridis
exposedto
data,
each nodereactsin
someway
to
it. Nodes
whichhave
astrong
responseto
a particular piece ofdata
are strengthened suchthat
they
are encouragedto
respondstrongly
to
similardata
in
the
future,
while nodes with a weak response are weightedto
keep
their
responseto that type
ofdata
weak.In
this way,
different
areas ofthe
net aretrained to
fire
astrong
responseto
different
sortofdata. An
unknownindividual
canbe
classifiedby
sending
it
through
thenetwork anddetermining
what areafires,
andthus,
what classthe
individual
belongs
to.
4. 0
Description
I
usedasimple character setfor
this
preliminary
testing:
15,000
samples ofthe
digits
0
to
9,
already
scanned,
quantizedto two
bits, de-skewed,
and scaled.That
sort ofimage
preprocessing
is
out ofthe
scope ofthis
work.The features I originally
plannedto
useinvolve
breaking
the
image data into
5x5
boxes
and
summing the
numberof'dark' pixelsin
eachbox, breaking
theimage
data
into 4x5 boxes
and
summing
the
numberof 'dark'pixels
in
eachbox,
counting
the
number ofdark
pixelsin
eachrow,
andin
each column.As
testing
ofthe
SOM
began,
I
found
the
last
method,
counting
the
dark
pixelsin
eachcolumn,
performedsopoorly
it
was not worthcontinuing
to
experiment with.I
replacedit
with anotherfeature
whichwassimply
aconcatenation ofthe
verticalcolumnIn
the
nextstep,
each separate setoffeatures
wasfed
throughK-Means,
the
geneticalgorithm,
andthe
Kohonen
SOM,
varying
the
parametersfor
each methodin
orderto
determine
whichconditions
they
workbest
underfor
this
data.
5.0 Experimental
Procedure
5.1
Kohonen SOM
I
ranthe
15,000
charactersdata
setthrough
each offour feature
extractors:the
5x5
grid,
the
4x5
grid, the
rowcounter,
andthe
combinedrow/column counter.The
outputfrom
each ofthesewas
broken
up
into
atraining
setofthe
first
5,000
samples,
and atesting
set ofthe
last
10,000
samples.A
smallertraining
suite of1,000
samples was also pulled out ofthe
bigger
training
set.I
usedthe
SomPak Kohonen SOM
packageto
implement
the
SOM. It
consists of a set ofcommand-line operated routines
for
building
andtraining
aKohonen
SOM. A
description
ofthe
package and where
it
canbe
obtained canbe found in
theappendix.A
seriesof scriptfiles
was createdfor
eachfeature
set,
each onecarrying
outthe creation,
training,
andtesting
of aKohonen
SOM
as well asextracting
andsummarizing
the
resultsof each run andcreating
aPostScript
file
of
the
SOM
itself.
Each
ofthefour
data
sets,
representing
the
four
features,
wastested
on32
different
SOM's,
each withdifferent
parameters.The
parametersI
choseto
investigate
were:1.
Training
set size.I
usedboth
a set of5,000
samples and a setof1,000
samplesto
determine
if
the
size ofthe
training
sethad
any
appreciable affect onthe
accuracy
ofthe
network.
2. Number
oftraining
passes.This indicated
how
many
times
thetraining
algorithmwould cycle
through
thetraining
data.
I
tested two
settings: a combination of1,000
passesthrough the
first
training
cycle and10,000
passesthrough
the
secondtraining
cycle,
and acombinationof
5,000
and50,000
passes,
respectively.3. SOM
shape.The Som Pak
software allowsfor
the
creation ofmapsin
whichthe
'nodes'are organized either
hexagonally
orin
rectangles.The
documentation
that
comeswith
Som
Pak
seemsto
indicate
that ahexagonally
organizedmap,
with six connectionsfor
eachnode,
might workbetter for
somedata
setsthan
rectangular maps.I
tried
both.
4.
Neighborhood
function. This determines
how
the
training
neighborhooddecreases in
radiusas
training
proceeds.The
'bubble'
option
is
astep
function;
the
other optionis
agaussian
decline.
5. SOM
size.After
somebrief
investigation,
I
determined SOM
sizesaround10
or15
The
stepsinvolved in
creating,
training, testing,
and evaluationthe
networkare asfollows:
1.
Randomly
initialize
the
network.SomPak include
the
executable'randinit'for
this
purpose.Map
size, shape,
and neighborhoodfunction
are set atthis time.
2.
Training.
SomPak includes
the
'vsom' executablefor
this
purpose.This
was carriedout
in
2
stages,
asperthe
recommendationsin
the
SomPak
documentation.
The
parameters
to
vsominclude
the
number oftraining
exemplars,
thelearning
ratealpha,
andthe
initial
neighborhoodradius.The
neighborhood radius and alpha were constantsthough
allthe experiments,
based
on values availablein
the
manual.It
shouldbe
notedthat the
parameter'rlen',
describing
how many
training
exemplarsthe program shouldrunthrough,
is
the
methodfor
specifying
the
number oftraining
passesthrough the
data.
If
the
number specifiedby
rlenis
larger
than the
number ofexemplarsin
the
training
data
file,
vsomiterates back
through
the
file.
For
instance,
whentold to
use5000
training
steps,
but
only
given afile
containing 1000
exemplars,
vsomwill
iterate
through
thatfile
5
times.
The
two
training
stagesare aninitial
'rough'training,
during
which rlenis
small and alpha andthe
initial
training
radius arelarge.
During
the
secondphase,
themap
is
fine
tuned,
rlenis
usualmuchgreater,
while alpha andthe
neighborhood radius start outmuch smaller.
In my
experiments,
I
used an alpha value of.05and an eight node radiusin
the
first
training
stage,
andan alpha of.02and athree
node radiusin
the
secondtraining
stage.3. Determine
quantization error.This step 'computes
the
quantization error over allthe
samples
in
the
data
file'. It
does
not seemto
have any
effect onthe
actualoutput;
it just
reportsa statisticconcerning
theperformanceofthe
map.This
statisticdoes
not quite correlateto
accuracy.4. Calibrate
the
map.This step is
optional.Given
a set oflabeled
training
data,
the
program veal will assign
the
labels
to the
appropriate nodes.This
is
primarily
atime-saver,
allowing
later
test
samplesto
be labeled
asthey
areclassifiedby
the
networkratherthan
having
to
do it
by
hand
by
comparing
the
coordinatesofthe
nodewhichfires in
responseto
asample withthe
clustersin
themap.I
did
usethis
optionalfeature,
andit
wasvery
helpful.
5. Test.
During
this stage,
abatch
offresh,
unlabeleddata is
presentedto
the
networkto
be
classified.The
program'visual',
included for
this purpose,
returnsthe
coordinatesofthe
best-matching
unitsfor
the sample,
andthe
label
associatedwiththat unit,
if
any.6. Extract
andtally
results.An
awk scriptwasusedto
extractthe
labels
ofthe
unitseach
test
data
pointwasassignedby
the
som(if any.) I
wrote asmall c program which comparedthese
results withthe
correctanswers,
keeping
count ofhow
many
werecorrectly
classified,
how
many
wereincorrectly
classified,
andhow
many
were notclassified at all.
In
the
caseofincorrect
classifications,
it
alsokept
track
of whatthe
point7.
Draw
map.SomPak include
acoupledifferent
programsfor
creating
graphical representationsofthe
maps.The
program'umat' was usedto
outputthe
mapsto
PostScript
files.
A
samplescriptfile for
running
the
whole processto
create onemap
canbe found in
the
appendix.
5.2
K-Means
Algorithm
As
withthe
Kohonen
SOM,
the
set of15,000
characters was runthrough
each ofthe
four
feature
extractors:5x5, 4x5,
horizontal
rowcounter,
andthe
horizontal/vertical
row counter.The
verticalcounterwas
discarded due
to
its
very
poor performancein
the
previous experiment.As
the
K-Means
algorithmdoes
notinvolve
the
samesortoftraining
then
testing
cycle asthe
Kohonen
SOM,
the
exemplarsdid
not needto
be
splitinto
groups.I
usedKhoros,
avery
versatileinformation
processing
package witha wide range of capability.The
routinesit includes
canbe
accessedeitherthrough the
commandline
or a graphical userinterface.
I
usedthe
graphical userinterface
for
this
project.As
withSomPak,
information
aboutthis
package andwhereit
canbe
obtainedis
availablein
the
appendix.A
workspacewas created
in
Khoros
for
each offour
experiments perfeature
extractor,
eachexcersizing
adifferent
combination of variablein
the
process.The
parametersI
choseto
investigate
were:1. Data
set size.I
wascurious asto
whetherthe sizeofthe
data
setpresentedto
the k-means algorithm madeany
difference in its
ability
to
perform.I
ranboth
the
full
setof15,000
characters andaset ofthe
first
5,000
through the algorithm.2. Initial
cluster centers.The
success ofthe
K-Means
algorithmis
very
sensitiveto
the
choice ofinitial
cluster centers.As it
is
basically
ahill-climbing
process,
a poorchoiceofinitial
clustercenterscanlead
to
alocal
maximum and afailure
ofthe algorithmto
perform
to
its full
potential.Khoros
allowsinitial
clustercentersto
be
eitherchosen'randomly',
in
which caseit
simply
usesthe
first
X
data
pointsin
the
data
setfor
clustercenters,
whereX
is
thenumberofclusters,
or elseit
allowshe
userto
specify
initial
cluster centers
in
a separatedata file.
I
ranit
withboth
the
'random'cluster
centers,
andusing
specificintelligently
chosen cluster centers.For
specific clustercenters, I
chose one exemplarof eachdigit,
zerothroughnine.This
did
resultin
acertain amountofoverlap
in initial
clustercentersbetween
thetwo
methodsasthe
first
ten
data
pointsin
the
file
contained exemplars of mostof
the
digits,
andthose
were usedasinitial
cluster centersin
both
types
of experiments.1.
Convert
input data
into
the
Khoros format. The Khoros
routines aredesigned
to
deal
withdata
presentedin
Khoros's owninternal format.
The
application providesroutines
for
converting ASCII
files
to
aKhoros
data
object.2. Run
the
algorithm.There
arenotmany
parametersfor
the
K-Means
algorithm asimplemented here. The
user can chooseto
specify
initial
clustercenters,
and mustlist
the
numberof clusters
desired.
The
other parameterthat
couldtheoretically
be
changedis
the
distance
measure usedby
the
algorithmto
calculatedistance between
cluster centers anddata
points.The Khoros
K-Means
implementation
usesEuclidean
distance for
this.
It
does
nothave
provisionsfor
the
useofotherdistance
measures.3. Convert
the
output.The
resultsofthe test
mustbe
changedfrom
the
Khoros
data
format
back into
plaintext
in
orderto
usemy
extraction routines onthem.
4.
Tally
results.I
wrote a program which comparesthe
K-Means
outputto
theactualidentity
of eachdata
point.Since
the
results are not calibrated asthey
werein
the
Kohonen
SOM
study, the
correctness ofthe
groupingsis
not atissue
here
so much asthe
actualcomposition of
the
clusters.In
otherwords, the
idea
is
notto
determine if
allthe
5's have been correctly
classifiedas5 's
so much asit is
to
determine if
allthe
5's
have
been
groupedtogether.
To
this
end,
I
wrote a smallC
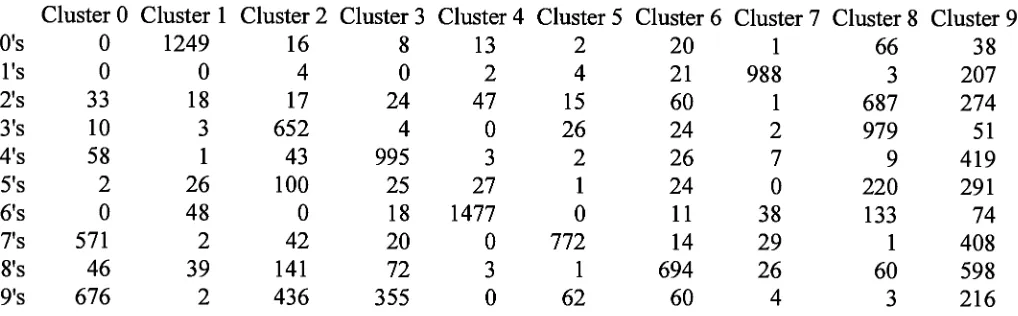
programwhich reportedback
the
Cluster
0
Cluster 1
Cluster
2
Cluster
3
Cluster 4 Cluster
5
Cluster 6 Cluster
7
Cluster 8 Cluster 9
O's
0
1249
16
8
13
2
20
1
66
38
l's
0
0
4
0
2
4
21
988
3
207
2's
33
18
17
24
47
15
60
1
687
274
3's
10
3
652
4
0
26
24
2
979
51
4's
58
1
43
995
3
2
26
7
9
419
5's
2
26
100
25
27
1
24
0
220
291
6's
0
48
0
18
1477
0
11
38
133
74
7's
571
2
42
20
0
772
14
29
1
408
8's
46
39
141
72
3
1
694
26
60
598
9's
676
2
436
355
0
62
60
4
3
216
Figure
1. Sample
of output(reformatted)
from
the
results-tallying utility
shows what wasassignedto
eachcluster.5.3
Genetic Algorithm
The
two
mainquestionsanyonewanting
to
use ageneticalgorithmmust answerin
regards
to
the
problem athand
are:how
willthe
data be
representedin
eachindividual
string,
andhow
willthe
fitness
of eachindividual be
calculated.For
data
representation,
I
useda variation on a scheme which proved successfulin
earlier work.In
a previous experimentin using
geneticalgorithmsin
clustering,
I
wasattempting
to
cluster
two
groups ofdata.
Each
individual in
the
population consisted of anarray
ofintegers.
The array had
asmany
elements asthere
weredata
pointsto
be
classified.The
populationofindividuals
was createdbut
randomly assigning
a'0' ora'1
'to
each elementin
eachindividual.
Each
data
point representedby
a '0'in
any
particularindividual
wastaken
asbelonging
to
onecluster,
whileeach point representedby
a'1
' was placedin
the
other cluster.It is
worthnoting
that
using
the
representationscheme,
eachindividual in
the
populationwas an attemptto
clusterall
the
data
pointsat once.For
thiswork,
I
usedthe
samescheme,
just
modifying
it
to
representten
clustersratherthan
two.
The
elements wereinitialized
randomly
to
a numberfrom
0
to
9. For
eachfeature
vector, this
numberindicates
whichclusterthecharacter representedby
that
element'belongs'
in. Note
that the
number givento
a particular clusterin
this
schemedoes
notnecessarily
indicate
whatthe
charactersin
that
clusteractually
are.The
numbersin
the
individual
schemesare
labels
only;
I
couldhave
just
aseasily
used alphabeticcharacters or othersymbolsratherthan
digits
in
the
individuals. The
fact
that
a set of charactersare clusteredinto
group
zerodoes
notmean
that
they
are all zeros.Actual
character recognitionis
not partofthis
system.An
individual's fitness
willbe
calculatedby
scanning
the
length
ofthe
individual,
[image:12.575.34.543.70.228.2]elements,
andcalculating
the
maximumdifference
between
corresponding
placesin
the
feature
set
in
the
setby
comparing
eachfeature
ofeach characterseparately,
noting
the
largest
difference
for
eachfeature,
andthen
adding
those
numberstogether.
The
morefit individual
willhave
alower
fitness
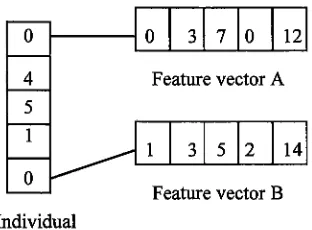
rating.0
3
7
0
12
0
4
Feature
vectorA
5
1
1
3
5
2
14
0
Feature
vectorB
[image:13.575.206.362.136.251.2]Individual
Figure 2: This
sampleindividual
placesfeature
vectorsA
andB
in
the
same cluster.The
fitness
ofthe
individual
is
calculatedby determining
the
maximumdifference
between
each element of
the
vectors clusteredtogether,
andadding
them
alltogether.
This
classification wouldresultin
7
(1+0+2+2+2) being
addedto the
fitness
valuefor
the
individual
.After running
the
genetic algorithmafew
times,
I
found
I
had
to
make an adjustmentto
the
fitness function.
The way
it
waswritten,
individuals
were rewardedfor
minimizing the
numberof clusters
they
contained.This
is
clearly
notthe
desired
goal.I
adjustedthe
fitness
function
by heavily
penalizing any individual
which excludedaclusterordid
notassignfeatrue
vectors
to
clustersin
anearly
evendistribution.
At
first,
individuals
were100
elementslong,
representing 100
charactersto
be
clusteredat a
time.
I
plannedto
uselonger individuals
and cluster more characters per run ofthe
genetic algorithmoneI
was surethe
system wasfunctioning
properly;
however,
it
ransoslowly
withjust
100
elementsin
eachindividual
that
I decided
experimentation withlonger individuals
was notfeasible.
The
resultsfrom
the
genetic algorithm's classification were runthroughthe
sameclustercounter programaswas used
to
theK-Means
results.6.0
Results
and
Conclusions
6.1
Kohonen
SOM
The
goal ofthis
part ofthe
project wasto
determine if
aKohonen SOM
could clusterhandwritten
characterdata
atall,
how
well,
how
eachfactor (feature
set,
map
size,
and soon)
affected
the
overallsuccess,
and what combinationoffactors
workedbest.
The
parameters werefound
to
have
the
following
effects onthe
accuracy
ofthe
SOM:
1.
Training
setsize.The
mapstrained
with a smalltraining
settended
to
have
aslightly
better
responsethan those trained
onalarge data
under most conditions.Other
factors,
however,
had
a muchlarger
effectonthe
overallaccuracy
ofthe
SOM.
2. Number
oftraining
passes.The
number of passesthrough
the
training
data
wasfound
to
have
alarge
effect onthe
success ofthe
network.Maps
trained
withmany iterations
specified withthe
rlen parameterdid
significantly
better
than those trained
withfew
cycles.3.
SOM
shape.The map
geometry,
hexagonal
orrectangular,
did
nothave
alarge impact
ontheaccuracy
oftheprocess.4. Neighborhood function. The
'bubble'neighborhood
function
wasfound
to
performsignificantly
better
than
the
gaussiandecline. This
is
nicebecause
the
bubble
function
also ran quite a
bit faster.
5.
Map
size.The
larger,
15x15
unitmap
wasfound
to produce,
in
general,
morecorrectly
classifieddata
pointsthan the
10x10
map,
althoughthe
larger
map
also resultedin
more unclassified units.Considering
that
an unclassified unitis,
for
these purposes,
nobetter
or worsethan
anincorrectly
classifiedone, the
larger map is better.
6. Feature
set.Of
the
four feature
setsused, the
5x5
box feature had
the
highest
average percent correctanswers,
followed closely
by
the
4x5 box
set.The
horizontal data
set and thecombinedhorizontal-verticalfeature
setsboth
were around10
percentless
accurate.The different feature
sets alsohad different sensitivity
to the
other parameters.The horizontal data
set showedthe
least
sensitivity
to
changesin
otherparameters,
with the5x5
and4x5 box feature
setsonly slightly
more sensitive.The
horizontal-vertical
combination
feature
set wasvery
sensitiveto the
variationsin
otherparameters.A
graphbelow illustrated
this
point.J2 c o a
8
n o a g> in o o o o .OE
7700 75001
73007100
6900
-6700
-I* 6500 6300+
6100 5900 5700+
5500 5300 5100 4900 4700 4500\
v._.
\
v_H 1 1 1
f-1 2
3
4 5 6 7 8 9 10 11 12 13 14 15 16While
the
best
results obtained wereonly
around75
percentcorrect,
I
still countthis
as asuccessful
clustering
methodfor
this
purpose.Some OCR
applicationsdo
achieve recognitionratesof
95
percent orbetter,
andthis
is clearly
muchless
accurate.However,
it is
notintended
to
be
a complete recognition systembut
simply
an aidto
ahuman
operatorworking
to
classify
andlabel
difficult
examples.Also,
the
charactersI
amworking
with aredifficult
examples.Handwritten
text
like
I
amusing
is
muchless
regularthan
printedcharacters,
andthe
preprocessing
onmy data
setis
notthe
most exhaustivethere
are exemplars which are not scaled acrossthe
entire20x30
pixelgrid,
but
that
'float'in
one corner or another.In
short,
I feel
that there's
enoughpotentialfor
successhere
that
moreinvestigation in
this
methodis
warranted.The
workcouldbe
repeatedwith adifferent data
set,
or otherparameters could
be
tested.
Also,
someway
ofadding
a'confidence' measureto
the outputwould
be
helpful,
asin,
reporting back
that the
SOM
has
classified aparticularcharacterto
acluster with a certain percentage confidence
that
the
answeris
correct.While
this
wasincluded in
the
original scope ofthis project,
noway
to
incorporate
this
idea into
the
operation ofSomPak
was
readily
available.6.2 K-Means Algorithm
The
goal ofthis
experiment wasto
determine how
wellthe
k-means
algorithmcanclusterhandwritten
characterdata
andhow
each parametersto the
algorithm(feature
set,
data
setsize,
and
initial
clustercenter)
affectedits
performance.The
performanceofthealgorithm canbe judged
according
to
speed of executionandtightness
oftheclusters generated~ thegoalis
to
have
the
allthe
samecharactersin
eachcluster.The
numberofiterations it
takes the
algorithmto
convergeis
anindicator
ofhow fast it
runs.
There
did
notseemto
be
a greatdeal
ofcorrelationbetween
any
ofthe
studiedfactors
andthe
number ofiterations
performed.On
average, the
smalldata
set withintelligently
choseninitial
clustercentersconvergedin
the
fewest
number ofiterations,
but
that
is
the
only
clearindication
in
the
data. As
the
algorithmdid
not requirereally
large
amounts oftime to
runin
any
of
the
tested
casesanyway, the
speeddoes
nothave
to
be
aconcern.As
for
the
clustering quality,
there
was asurprisingly
smalldifference in
the
quality
ofthe
clustersproducedwithrandom
initial
cluster centersvs.specificinitial
clustercenters.While
the
clustering
wasslightly
better
withpre-chosenclustercenters, the
difference
was small.This
canpossibly
be
attributedto the
fact
that
mostofthe
initial
cluster centerswereactually
the
samebetween
the two.
The
largest difference in
quality
camefrom
the
feature
setschosen.As
withthe
Kohonen
SOM,
the
5x5
and4x5 feature
sets performedbest,
followed
by
the
horiz
set,
withthe
horizontal-verticalset
giving
the
poorestresults ofthe
four.
Something
worthnoting is
that
somecharactersclusteredmuch
better
than
others.O's,
1
's,
and6's
clusteredbest,
whilethe
algorithm seemedto
have
the
mosttrouble
classifying
3's,
8's
and9's. It
is
possiblethat this
is
an effect ofthe
clustercenters chosen.
While
this
study
does
showsome successusing
this
methodfor
clustering
characterdata,
it does
notseemto
behave
as well asthe
Kohonen SOM
for
this
purpose.More
experimentationis
calledfor,
perhapsusing
different distance
measures(Mahalanobis
distance,
for
example,
has
been
found
to
performbetter in
someapplications)
andworking
more withthe
idea
ofdifferent
initial
cluster centers.6.3
Genetic Algorithm
The
first thing
noticed aboutthe
genetic algorithm wasthat
withthis
(admittedly
expensive)
fitness
function,
it
wassubstantially
slowerthan
eitherofthe
othertwo
methods.In
fact,
it
was slow enough(taking
on averageroughly
anhour
and ahalf
to
complete onerun)
that
it
might almostbe
faster
to
go aheadandclassify
samplesby
hand
ratherthan
use a geneticalgorithm configuredas
it
wasfor
this
experiment.In
addition, the
genetic algorithm was notnearly
as effectiveatperforming
the
classificationas eitherof
the
othertwo
methodsinvestigated. Had
the
algorithmbeen
run onmore
than
100
samplesat atime,
thus
having
moredata
to
workwith,
it
mighthave been
more successful.As
it
was withsofew
samples,
any
errororuncertainty
in
the
clustering
becomes
very
significant.
6.4 Comparisons
Both
the
Kohonen map
andthe
K-means
algorithm showedencouraging
results.They
both
clusteredlarge
numbers of charactersquickly
and with enough successto
greatly
speedthe
process of
labeling
characterdata.
The
performance ofthe
geneticalgorithm,
onthe
otherhand,
wasquitepoorin
comparisonto
the
othertwo
methods.As
for
the
feature
sets, the
4x5
and5x5
features
returnedthe
mosttightly
clusteredresults underboth
the
Kohonen SOM
andK-Means. With
the
geneticalgorithm,
allfeature
setsbehaved
equally
poorly.6.5
Suggestions For
Further
Study
It
is
clearthat
shoulda genetic algorithm everbe
usedfor
this purpose,
more work mustbe done
to
makeit
effective.The
problemsI
encounteredusing
the
geneticalgorithm,
slowness andinaccuracy,
areboth
attributableto the
choiceoffitness function.
There
is
plenty
of roomfor
work onfinding
abetter fitness function for
this
problem.One
thought
wouldbe
to
usethe
unfiltered characterdata in
place ofthe
extractedfeature
vectors,
calculating
the
fitness from
hamming
distance between
the
characters.I
did
notattemptthis
methodbecause
part ofmy
goalin
this
project wasto test the
different features
themselves
in
eachclustering
method.More
work shouldbe done
withthe
K-means
algorithm; specifically,
otherdistances
measuresbesides
the
one usedby
Khoros
shouldbe investigated.
A
majorfactor
which wouldbe
usefulto
addto this
researchin
moving
towards
afinal
applicationwouldbe
finding
away
to
include,
along
withassigning
each characterto
acluster,
aconfidence
level
to that
grouping.For
instance,
a certain character couldbe included in
a cluster with a70%
confidencelevel. This feature
is
availableto
some extentin
a variation onthe
K-Means
algorithmknown
as'fuzzy
K-means'. It
could alsobe
addedto
aKohonen
SOM,
perhapsasa
function
ofthe
distance
the
node activatedby
a certain characterfrom
thegeographical center oftheclusterin
the
SOM.
Adding
this
functionality
to
aGA,
however,
would require much more work.The
point ofdoing
this
wouldbe
sothat
in
afinal
application, the
entriesin
aparticularcluster could
be
presentedto the
userin
arankedorder,
making
it
quickerto
discard
incorrectly
classified entries.Even
withoutfurther
investigation
in
these areas,
afull
character classification system couldbe
written now which wouldbe
ofvaluein creating
labeled
characterdata.
While
alot
of roomfor
optimizing the
systemremains,
one couldbe
puttogether
based
onthis
work which would servethe
purpose well.7.0
Appendixes
7.1 Kohonen
SOM Example Script
echo
initializing
map
./randinit-din
5x5.dat
-cout5x5_b_f_r_b.map
-xdim15
-ydim15
-topolrect-neighbubble
echo
first
training
run./vsom-din
5x5.dat
-cin5x5_b_f_r_b.map
-cout5x5_b_f_r_b.map
-rlen1000
-alpha0.05
-radius8
echo second
training
run./vsom-din
5x5.dat
-cin5x5_b_f_r_b.map
-cout5x5_b_f_r_b.map
-rlen10000
-alpha0.02
-radius3
echo quantizatin error
./qerror-din
5x5.dat
-cin5x5_b_f_r_b.map
echo
calibrating map
./veal-din
5x5.calib
-cin5x5_b_f_r_b.map
-cout5x5_b_f_r_b.map
echo
producing
output./visual-din
5x5.test
-cin5x5_b_f_r_b.map
-dout5x5_b_f_r_b.out
./strip
5x5_b_f_r_b.out
>5x5_b_f_r_b.strip
echo
tallying
results./percent
5x5.check
5x5_b_f_r_b.strip
>5x5_b_f_r_b.results
echodrawing
psmap
./umat-cin
5x5_b_f_r_b.map
-psl >5x5_b_f_r_b.ps
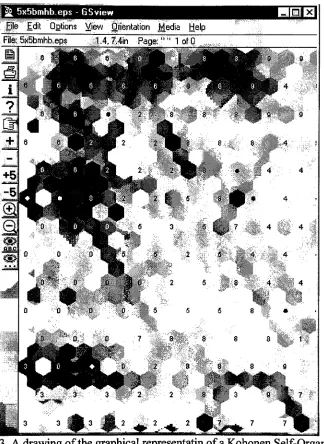
7.2
Kohonen SOM
Drawing
^
5x5bmhb.eps
-GSview
File
Edit
UEtionsView
Orientation
Media
Help
sE
File:
5n5bnnhb.eps
1.4. 7.4in
Page:""1
of0
Figure
3. A
drawing
ofthe
graphical representatin ofaKohonen
Self-Organizing
Map
ascreated
by
SomPak.
7.3 Background Material
K-Means Algorithm:
Class
notesfrom
the
graduateimaging
sciencecourseSIMG-784,
Spatial Pattern
Recognition,
astaught
in
thespring
quarterof1995
by
Dr.
Harvey
Rhody.
Genetic Algorithms:
Class
notesandexperimentsfrom
the
graduate computer science courseICSG-756,
Genetic
Algorithms,
astaught
in
the
spring
quarter of1995
by
Dr.
Peter
Anderson.
[image:19.575.130.454.85.529.2]Kohonen
SOM:
Class
notes and experimentsfrom
the
graduatecomputer sciencecourseICSG-755,
Neural
Network
Seminar,
astaught
in
the
winter quarterof1994
by
Roger Gaborski.
Charatcter
Recognition/Feature Selection:
Gader,
Paul
et al."Matching
Database
Records
to
Handwritten Text". SPIE Proceedings
onDocument Recognition.
Vol. 2181. SPIE
Publications,
1994. 67-75.
Grother,
Patrick J. "Cross Validation Comparison
ofNISTOCR
Databases".
SPIE
Proceedings
onCharacter Recognition
Technologies. Vol. 1906. SPIE
Publications,
1993.
296-306.
Wilson,
CL.
"Efficetiveness
ofFeature
andClassifier Algorithms in Character
Recognition
Systems".
SPIE Proceedings
onCharacter
Recognition Technologies.
Vol. 1906. SPIE
Publications,
1993. 255-265.
Garris,
Michael
D.,
Jon
Geist,
andR.Allen Wilkenson. "Machine-Assisted Human
Classification
ofSegmented Characters For
OCR
Testing
andTraining". SPIE
Proceedings
onCharacter Recognition Technologies. Vol. 1906. SPIE
Publications,
1993. 208-271.
7.4
Other Sources
K-Means Algorithm:
The Khoros Pro
package was usedfor
the
k-means
algorithm.It
is
aUNIX-based
software package created
for data
visualizationandmanipulation,
espeically concerning
image
processing
problemsof varioustypes.
The
packageitself
(including
binaries
for
avariety
ofsystems),
along
with a usersmanual,
canbe
purchasedfrom
Khoral Research
Inc.,
orelsethesource code can
be
downloaded from
their
website,
www.khoral.com.Kohonen SOM:
Som_Pak
is
aset of routinesfor
thecreation,
training,
and use of aKohonen SOM.
Version 3.1
was usedfor
theseexperimenst.The
packageis
writtenfor
UNIX
andMS-DOS
systems
by
the
SOM
Programming
Team
ofthe
Helsinki
University
ofTechnology Laboratory
ofComputer
andInformation Science. The
programcanbe
downloaded from
http://www.cis.hut.fi/nnrc/nnrc-programs.html.
More
generalinformation is
availablefrom
http://www.cis.hut.fi/~hynde/lvq/.
7.5 Percentage Correct Calculation Code
#include
<stdio.h>#include
<string.h>int
main(intargc,
char*argv[])
FILE
*orig,
*output;
int
right,
wrong,
total,
noclass,
i,
j,
tally;
float
percent;
char
orig_line[3],
out_line[3];
intmatrix[10][10];
right=
wrong
=noclass=
total
=tally
=0;
for(i
=0;i<10;i++)
for(j
=0;j<10;j++)
matrix[i][j]
=0;
if(argc
!=3)
{
printf("USAGE: percent
<check
file>
<nn
outputfile>\n");
exit(0);
}
orig
=fopen(argv[l],
"r");
output=
fopen(argv[2],
"r");
fgets(orig_line,
4,
orig);
fgets(out_line, 4,
output);
while((!feof(orig))
&& (Ifeof
(output)))
{
total++;
if
(isspace(out_line[0]))
noclass++;
else
if(orig_line[0]
=out_line[0])
right++;
else
{
matrix[atoi(orig_line)][atoi(out_line)]++;
wrong++;
}
fgets(orig_line, 4,
orig);
fgets(out
line, 4,
output);
}
fclose(orig);
fclose(output);
printf("Numbercorrect:
%d\n",
right);
printf("Numberwrong:
%d\n",
wrong);
printf("Number unclassified:
%d\n",
noclass);
printf("Total samples:%d\n",
total);
printf("Percentcorrect:
%f\n",
(((float)
right/(float)
total)*100));
printf("Percentincorrect:
%f\n",
(((float)
wrong/(float)
total)*100));
printf("Percent not classified:%f\n",
(((float)
noclass/(float)
total)*100));
printfC'ErrorMatrix:
\n
012345678
9\nn);
for(i
=0;
i
<10;
i++)
{
printf("%d:
",
i);
forG
=0;j<10;j++)
{
printf("%d
",matrix[i]D]);
tally
+=matrix[i][j];
}
printf("\n");
}
printf("Tally:
%d\n",
tally);
}
7.6 Cluster Composition Code
#include
<stdio.h>int
main(intargc,
char*argv[])
{
intgroup0[10];
int
group
1
[10];
int
group2[10];
intgroup3[10];
intgroup4[10];
intgroup5[10];
intgroup6[10];
intgroup7[10];
intgroup8[10];
intgroup9[10];
inti;
FILE
*check;
FILE
*output;
char
orig_line[10],
out_line[10];
if (argc
!=3)
exit(O);
for(i
=0;i<10;i++)
t
groupO[
l]
=0
grouplfi
l]
=0
group2[i
l]
=0
group3[
l]
=0
group4[i
l]
=0
group5[i
i]
=0
group6[]
i]
=0
group7[i
i]
=0
group8[i
i]
=0
group9[]
i]
=0
}
check=
fopen(argv[l],
"r");
output=
fopen(argv[2], "r");
fgets(orig_line,
9,
check);
fgets(out_line,
9,
output);
while((!feof(check))
&&
(!feof(output)))
{
switch(out_line[0])
{
case
'0':
groupO
[atoi(origline)]-break;
case'T:
group 1
[atoi(origline)]-break;
case
'2':
group2[atoi(orig_line)]H
break;
case
'3':
group3
[atoi(orig_line)]H
break;
case
'4':
group4[atoi(orig_line)]H
break;
case
'5':
group5
[atoi(orig_line)]H
break;
}
case
'6':
group6[atoi(orig_line)]++;
break;
case
7':
group7
[atoi(orig_line)]++;
break;
case
'8':
group8
[atoi(orig_line)]++;
break;
case
'9':
group9
[atoi(origline)]
++;
break;
}
fgets(orig_line,
9,
check);
fgets(out_line,
9,
output);
fclose(check);
fclose(output);
printf("Cluster
0:\n");
for(i
=0;i<10;i++)
printf("\t%d's:
%d\n",
i,
group0[i]);
printf("\nClusterl:\n");
for(i
=0;i<10;i++)
printf("\t%d's:
%d\n", i,
group
l[i]);
printf("\nCluster
2:\n");
for(i
=0;i<10;i++)
printf("\t%d's:
%d\n",
i,
group2[i]);
printf(*'\nCluster3:\nM);
for(i
=0;i<10;i++)
printf(M\t%d's:
%d\n", i,
group3[i]);
printf("\nCluster
4:\n");
for(i
=0;i<10;i++)
printf("\t%d's:
%d\n",
i,
group4[i]);
printf("\nCluster
5:\n");
for(i
=0;i<10;i++)
printfC'Wod's:
%d\nM,
i,
group5[i]);
printf("\nCluster
6:\n");
for(i
=0;i<10;i++)
printfC'Wod's:
%d\n", i,
group6[i]);
printf("\nCluster
7:\n");
for(i
=0;i<10;i++)
printf("\t%d's:
%d\nM,
i,
group7[i]);
printfCVCluster
8:\n");
for(i
=0;i<10;i++)
printf("\t%d's:
%d\n",
i,
group8[i]);
printf("\nCluster
9:\n");
for(i
=0;i<10;i++)
printfC'Wod's:
%d\n",
i,
group9[i]);
}
7.7
Genetic Algorithm Code Modifications
The
genetic algorithmI
used wasbased
onC
codeprovidedby
Dr. Peter
Andersen.
I
made modifications
in
the
fitness function
andthe
data
representation.The
functions containing
my
work areprintedhere.
typedef
struct{
int
feature[FEATURE_LENGTH];
}
point;
unsigned char
**p;
int
*perm_help,
*r, *c;
int
**M;
float
MAX_HERO;
float fitaess[l
000];
float
hero;
int
individuallength;
int
mutcount,
trial;
point
data
[100];
intgroup[100];
/*
=======*/
main(
argc,
argv)
int
argc;
char**argv;
{
int
who,
cl, c2,
pi, p2, a,b,c,d,
tmp,
permmax;
intj=0;
intk;
FILE
*fp;
chartemp[200];
char
*shorttemp;
fp
=fopen(ndataM,
"r");
for(j
=0;j<100;j++)
{
fgets(temp,
200,
fp);
shorttemp
=strtok(temp,
"
");
data[j].feature[0]
=atoi(shorttemp);
for(k
=1
;
k
<FEATURE_LENGTH;
k++)
{
shorttemp
=strtok(0,
"
");
data[j].feature[k]
=atoi(shorttemp);
}
}
fclose(fp);
params(
argc,
argv);
initO;
forall(
who,
0,
POP_SIZE-l
) fitaess[who]
=fv(who);
forall(
trial,
1,
LOOPS
){
perm_max=POP_SIZE;
#define
GET(A)
tmp
=random(
perm_max);\
A
=perm_help[tmp];\swap(
tmp,
perm_max-l);\
permmax--;
if(
two_parents
)
{
GET(a);
GET(b);
GET(c);
GET(d);
if( fitness[a]
<fitness[b]
)
{
cl=a;
pl=b;
}
else{
cl=b;
pl=a;
}
}
if( fitness[c]
<fitnessfd]
) {
c2=
c;
p2=
d;
}
else{
c2=
d;
p2=
c;
}
if(
hero
>=MAX_HERO
) {
inti,j;
break;
}
make_children(
pi,
p2, cl,
c2);
if(
MUT_RATE
>0.0
) {
mutate(
cl);
mutate(
c2);
}
fitness[cl]
=fv(cl);
if(
hero
>=MAXHERO
) {
printf(
"Maximum hero
reached:%d\n",
hero
);
exit( 0
);
}
fitaess[c2]
=fv(c2);
if(
hero
>=MAXHERO
) {
printf(
"Maximum hero
reached:%d\n",
hero
);
exit( 0
);
}
}
}
printf(
"\t\t\tStopped
after%d
trials.Hero
=%f\n",
trial,
hero
);
if(
hero
>=MAX_HERO
)
{
printf( "Maximum
hero
reached:%d\n",
hero
);
exit(
0
);
}
int
fv(
who)
int
who;
/*fitness
valueofindividual
who*/
#define
VV(X)
(2*(X)-1)
{
static
int
count=0;
int
I,J,K,i,j,k,
1;
int
ones[50],
twos[50], threes[50],
fours[50], fives[50];
int
sixes[50], sevens[50], eights[50], nines[50],
zeros[50];
int
countO, countl, count2, count3, count4;
int
count5, count6, count7,
count8, count9;
int
the_fitaess;
int
max, min;
count++;
the_fitness=0;
countO= countl = count2= count3= count4=0;
count5 = count6= count7= count8= count9=0;
for(i
=0;i<100;i++)
{
switch(p[who]
[i])
{
case0:
zeros[countO]
=i;
count0++;
break;
case
1
:ones[countl]
=i;
countl
++;
break;
case2:
twos[count2]
=i;
count2++;
break;
case3:
threes
[count3]
=i;
count3++;
break;
case4:
fours[count4]
=i;
count4++;
break;
case5:
fives[count5]
=i;
count5++;
break;
case6:
sixes
[count6]
=i;
count6++;
break;
case
7:
sevens
[count7]
=i;
count7++;
break;
case8:
eights[count8]
=i;
count8++;
break;
case9:
nines[count9]
=i;
count9++;
break;
}
}
the_fitness
=0;
for(i
=0;
i
<FEATURE_LENGTH; i++)
{
if(count0
!=0)
{
max=data[zeros[0]].feature[i];
min=data[zeros[0]].feature[i];
for(j
=1
;
j
<countO;
j++)
{
if(data[zeros[j]].feature[i]
>max)
max=data[zeros[j]].feature[i];
if(data[zeros[j]].feature[i]
<min)
min=data[zeros[j]].feature[i];
}
the_fitness+=
(max
-min);
}
}
for(i
=0;
i
<FEATURE_LENGTH;
i++)
{
if(countl
!=0)
{
max=data[ones[0]].feature[i];
min=data[ones[0]].feature[i];
for(j
=1
;
j
<countl;
j++)
{
if(data[ones[j]].feature[i]
>max)
max=data[ones[j]].feature[i];
if(data[ones[j]].feature[i]
<min)
min=data[ones[j]].feature[i];
}
the_fitness
+=(max
-min);
}
}
for(i
=0;
i
<FEATURE_LENGTH; i++)
{
if(count2
!=0)
{
max=data[twos[0]].feature[i];
min=data[twos[0]].feature[i];
for(j
=1
;
j
<count2;
j++)
{
if(data[twos[j]].feature[i]
>max)
max=
data[twos[j]].feature[i];
if(data[twos[j]].feature[i]
<min)
min=
data[twos[j]].feature[i];
}
the_fitness
+=(max
-min);
}
}
for(i
=0;
i
<FEATURE_LENGTH;
i++)
{
if(count3
!=0)
{
max=data[threes[0]].feature[i];
min=data[threes[0]].feature[i];
for(j
=1
;
j
<count3;
j++)
{
if(data[threes[j]].feature[i]
>max)
max=
data[threes[i]].feature[i];
if(data[threes[j]].feature[i]
<min)
min=data[threes[j]].feature[i];
}
thefitness+=
(max
-min);
}
}
for(i
=0;
i
<FEATURE_LENGTH;
i++)
{
if(count4
!=0)
{
max=data[fours[0]].feature[i];
min=data[fours[0]].feature[i];
for(j
=1
;
j
<count4;
j++)
min=
data[fours[j]].feature[i];
}
the_fitness
+=(max
-min);
}
}
for(i
=0;
i
<FEATURE_LENGTH; i++)
{
if(count5
!=0)
{
max=data[fives[0]].feature[i];
min=data[fives[0]].feature[i];
for(j
=1
;
j
<count5;
j++)
{
if(data[fives[j]].feature[i]
>max)
max=data[fives[j]].feature[i];
if(data[fivesO]].feature[i]
<min)
min=data[fives[j]].feature[i];
}
the_fitness
+=(max
-min);
}
}
for(i
=0;
i
<FEATURE_LENGTH; i++)
{
if(count6
!=0)
{
max=data[sixes[0]].feature[i];
min=data[sixes[0]].feature[i];
for(j
=1
;
j
<count6;
j++)
{
if(data[sixes[j]].feature[i]
>max)
max=data[sixes[j]].feature[i];
if(data[sixes[j]].feature[i]
<min)
min=data[sixes[j]].feature[i];
}
the_fitness+=
(max
-min);
}
}
for(i
=0;
i
<FEATURE_LENGTH;
i++)
if(data[sevens[j]].feature[i]
>max)
max=data[sevens[j]].feature[i];
if(data[sevens[j]].feature[i]
<min)
min=data[sevens[j]].feature[i];
}
the_fitaess
+=(max
-min);
}
}
for(i
=0;
i
<FEATUREJJENGTH; i++)
{
if(count8
!=0)
{
max=data[eights[0]].feature[i];
min=data[eights[0]].feature[i];
for(j
=1
;
j
<count8;
j++)
{
if(data[eights[j]].feature[i]
>max)
max=
data[eights[j]].feature[i];
if(data[eights[j]].feature[i]
<min)
min=
data[eights[j]]. feature
[i];
}
the_fitness+=
(max
-min);
}
}
for(i
=0;
i
<FEATUREJJENGTH;
i++)
{
if(count9
!=0)
{
max=data[nines[0]].feature[i];
min=data[nines[0]].feature[i];
for(j
=1
;
j
<count9;
j++)
{
if(data[nines[j]].feature[i]
>max)
max=
data[nines
fj]]. feature
[i];
if(data[nines[j]].feature[i]
<min)
min=
data[nines[j]].feature[i];
}
thefitness
+=(max
-min);
}
}
if(count0
>13
||
countO<8)
the_fitness
+=2000;
if(countl
>13
||
countl <8)
the
fitness
+=2000;
if(count2
>13
||
count2 <8)
the
Jitness
+=2000;
if(count3
>13
||
count3 <8)
thejitness
+=2000;
if(count4
>13
||
count4 <8)
thejitness
+=2000;
if(count5
>13
||
count5 <8)
the_fitness
+=2000;
if(count6
>13
||
count6<8)
the_fitness
+=2000;
if(count7
>13
||
count7 <8)
thejitness
+=2000;
if(count8
>13
||
count8 <8)
the
fitness
+=2000;
if(count9
>13
||
count9 <8)
the
Jitness
+=2000;
the_fitness
=-thejitness;
if(theJitness
=0)
the
Jitness
=-10000;
if(
print_every
Jitness
)
{
printf(
"%4d
fitness:
%d\n",
count,
the
Jitness
);
for(j
=0;j<100;j++)
printf("%d",p[who]0]);
putcha^V);
}
if(
thejitness
>hero
)
{
hero
=thefitaess;
if(
print_every_hero){
printf( "New
hero %4d
%d\n",
count, the
Jitness);
for(j=0;j<100;j++)
printf("%d\n",
p[who]0]);
}
}
if
(
hero
>=MAX_HERO
)
{
printf( "Maximum
hero
reached:%d,
fitness
evaluation:%d\n",
hero,
count);
}
return(
thejitness
);