© 2002
Scottish Institute for Residential Child Care
Published by
The Scottish Institute for Residential Child Care
University of Strathclyde
76 Southbrae Drive
5
thFloor
1
ACKNOWLEDGEMENTS
This report has been written by Liz Frondigoun (Research Assistant) and Kirstie Maclean
with assistance from Andrew Hosie (Lecturer) and Professor Andrew Kendrick. The
process of organising the visits to units and schools, data collecting and support of the
consultants was managed by Andrew Hosie and undertaken by eight consultants – Tracey
Armstrong, Danny Butcher, Angus Cameron, Peter Cassidy, Scott Dunbar, Brian Fearon,
Margaret Graham and Struan McCallum – and by Andrew Hosie and Neil Munro
(Lecturer, the Robert Gordon University). A number of other Scottish Institute for
Residential Child Care lecturing staff were involved in undertaking some joint visits with
the consultants to quality assure the process. Roy Wilson (Database Clerk) input most of
the data on to the computer.
None of these were easy tasks. In some units, forms were lost or visits cancelled. As
with any self-completion form, the answers were not always easy to understand or even
read. In spite of all the difficulties, the team remained committed and cheerful. I would
like to thank everyone involved very much for their patience and hard work. I would also
like to thank the organisations in Scotland which provide residential child care, for
allowing us to visit their units and schools, and the staff in the units and schools who
co-operated readily with the process. Responsibility for the end product, of course, rests
with SIRCC, but I hope that they will feel satisfied that we have done justice to their
efforts.
Kirstie Maclean
Director
April 2002
SIRCC National Office
5
thFloor
Sir Henry Wood Building
University of Strathclyde
76 Southbrae Drive
Jordanhill
3
CONTENTS
1 INTRODUCTION
7
2
THE PROCESS OF UNDERTAKING THE QUALIFICATIONS AUDIT 8
3 THE
FINDINGS
10
Introduction
10
Characteristics of the workforce
10
Qualifications which are currently recognised by most employers
12
Geographical
variations
14
Qualifications which may be recognised in certain settings
19
Qualifications that may be relevant but are less likely to be recognised
21
General educational levels of unqualified staff
21
Overview of findings
22
4
THE FINDINGS IN CONTEXT
31
5
IMPLICATIONS OF THE QUALIFICATIONS AUDIT
35
The nature of residential child care
35
The historical context
37
Effectiveness of qualifying courses
38
6
PROPOSALS TO THE SCOTTISH EXECUTIVE AND THE
SCOTTISH SOCIAL SERVICES COUNCIL CONCERNING
QUALIFICATIONS
42
An optimum framework
42
An
interim
framework
43
Other factors of which account needs to be taken
45
4
8 CONCLUSIONS
49
APPENDIX 1: QUALIFICATIONS AUDIT FORM
50
APPENDIX 2: ORGANISATIONS WHICH PROVIDE RESIDENTIAL
5
TABLES
1
Gender numbers by sector
10
2
Type of employment contract held by respondents in each of the
three sectors
11
3
Number of responses from each type of establishment by sector
12
4 Qualifications
held
13
5
Qualifications currently being undertaken that might be recognised 14
6
Percentage of staff who have or are currently undertaking a likely
to be recognised qualification in the North of Scotland
15
7
Percentage of staff who have or are currently undertaking a likely
to be recognised qualification in the South East of Scotland
16
8
Percentage of staff who have or are currently undertaking a likely
to be recognised qualification in Tayforth
17
9
Percentage of staff who have or are currently undertaking a likely
to be recognised qualification in the West of Scotland
18
10
Number of staff holding or undertaking a qualification that may be
recognised in certain settings
19
11
Staff with qualifications that may be recognised in certain settings
by type of establishment
20
12
Staff holding or undertaking a relevant but less likely to be
recognised qualification
21
13
General educational levels of unqualified staff
22
14
Qualifications held by employment position
24
15
Qualifications currently being undertaken by employment position
25
16
Qualifications held which are likely to be recognised by employment
6
17
Qualifications currently being undertaken by employment contract
27
18
Qualifications held and currently being undertaken by sector
28
19
Staff qualifications in 1990
31
20
Residential child care staff (FTE) by sector 1989 – 2000
32
7
1. INTRODUCTION
The Residential Child Care Qualifications Audit was commissioned from the Scottish
Institute for Residential Child Care by the Scottish Executive. It was one of the objectives
outlined in the “Invitation to apply for a grant for the education and training of residential
child care workers in Scotland Initiative”
1and was intended to provide essential information
for the Scottish Social Services Council as it develops its qualifications framework, and also,
more widely, as a published document for residential child care providers.
Whilst the Scottish Executive publishes statistics on the qualifications of workers employed
by local authority social work departments, there are no comparable statistics for residential
workers employed by the voluntary and private sectors, nor for residential workers employed
in residential schools by education departments. The statistics which are published by the
Scottish Executive are less detailed than those we have produced. In particular, we hoped
that by finding out about the general education level of residential child care workers likely
to be deemed unqualified, a clearer picture would emerge of potential capacity to achieve
qualifications.
The audit started in October 2000 when letters were sent to 74 organisations in Scotland
which provide approximately 220 residential establishments (see Appendix 1 for list of the
organisations), asking their permission to visit these establishments and outlining the
purposes of the visits. By October 2001, 241 visits had been completed (some schools are
divided into a number of living units – where this was the case, a visit was planned to each
unit) and 22 remained outstanding. This report is based on information concerning 2,971
residential child care workers’ qualifications, or lack of them, collected from those visits.
This report outlines the level and range of the qualifications found and the very major
challenges for achieving a fully qualified workforce posed by them; some of the implications
of the findings; some of the wider considerations of which account needs to be taken if a
strategy for achieving qualifications is to be successful; some of the unknown, and in some
cases, unknowable, factors which will complicate planning and lead to a need for flexibility
and adaptability; proposals for a qualifications framework which we consider is the minimum
needed if the quality of care for looked after young people is to be improved; and some
suggestions for how a fully qualified work force might be achieved.
1
8
2. THE PROCESS OF UNDERTAKING THE
QUALIFICATIONS AUDIT
Every agency offering residential child care
2in Scotland was written to by SIRCC in October
2000 to advise them that we intended to undertake a qualifications audit on behalf of the
Scottish Executive. The staff to be included were all care staff and any managers of care
staff who were unit or school based; teachers, clerical and domestic staff, external managers
and agency staff were excluded. Simultaneously with the collection of the qualifications
audit, we intended to undertake a training needs analysis, collect a variety of other
information concerning the units and schools and tell staff about the services SIRCC
provides. We considered that face-to-face contact with staff would both allow them the
opportunity to ask any questions they wanted and lead to a much higher rate of return of the
qualifications audit and training needs analysis forms than would have occurred had the
exercise been undertaken by post.
Written permission was sought from the organisations’ directors for visits to be made to the
units and schools. Senior managers in the organisations were offered a preliminary meeting,
if they wanted to find out more about the process, prior to visits being made to units and
schools. Approximately 20% took up this offer. With the benefit of hindsight, we consider it
would have been helpful to have undertaken such a visit to all organisations. Once
permission was received, the data collection began. We envisaged that this might take 4
months – January to April 2001. However, although there was surprisingly little wariness,
and no hostility, to overcome, the process of receiving permission and getting firm
commitments from units and schools for visits to proceed was long drawn out in a significant
number of cases. In some cases, this was due to serious internal difficulties, or impending
closures or changes; in others to the fact that our visit was not seen as a high priority or the
paperwork being lost.
There were in November 2001 approximately 220 residential child care
establishments/schools, comprising 263 units, in Scotland. These establishments range in
size from the smallest, which have 2 – 4 residents, to large residential schools with 75
residents. The larger providers are often divided into a number of smaller living units.
Where this was the case, we stated our willingness to visit all the units. To undertake this
volume of work, SIRCC employed eight consultants and they, together with two SIRCC staff
members, carried out the visits. Each consultant had at least one of their early visits quality
assured by a member of SIRCC staff. Two hundred and forty one units were visited (92% of
the planned total), some more than once, by the cut-off date for data collection which was the
end of September 2001. A few more have been visited since.
2
9
The qualifications audit forms (see Appendix 1 for a sample) were sent to establishments
approximately six weeks before the consultant’s visit. It was hoped that the forms would be
completed prior to the visit, with the consultant mainly providing advice where queries or
difficulties had arisen. The process went according to plan in many cases, but in others the
audit process had not started by the time the consultant visited and the consultant needed to
provide further explanation and encouragement, sometimes agreeing to return at a later date
to collect completed forms. Unfortunately, this still did not always result in forms being
completed. Four agencies decided not to follow this process, each deciding to provide data
from their own personnel records. In all four cases this has meant that the data given is in a
somewhat different format and generally less detailed than the data collected by our chosen
method. We have, however, managed to accommodate these differences, and their data is
included in our analysis.
Completed returns were initially collated and entered on to a File Maker Pro database. At
this stage in the process any ambiguities or uncertainties in how the returns had been
completed were dealt with. Once we were satisfied with the accuracy of the information we
had received and recorded, it was exported directly from File Maker Pro into Statistical
Package for Social Sciences (SPSS) for statistical analysis.
10
3. THE FINDINGS
Introduction
At present our records show that there are 4,601 child care staff employed in
residential child
care. This figure is taken from SIRCC's records, which were compiled during the period of
the study. Initially all units and schools were requested to state the number of care staff
working in their unit or school on the 1
stJanuary, 2001. However, the reality was, in some
cases at least, that these forms were not completed until the consultant's visit which took
place between January and September 2001. Therefore, these figures should be taken as an
indication of the number likely to be working in residential child care and may be subject to
some variation – people leave and new employees are taken on in a continuous process.
We hoped for a high response rate given the strength of the support we received and the face
to face nature of the audit. At 3
rdOctober, 2001, 2,971 returns had been received, a 64.6%
response rate. Returns were received from 168 units and schools (63.9% of units and schools)
within Scotland managed by 59 organisations (79.7% of relevant organisations). As 241
units and schools were visited by consultants, this means that they were unsuccessful in
obtaining qualification audits on 30.3% of visits by the cut off date.
Characteristics of the work force
[image:13.612.67.535.519.680.2]Of the total respondents, 1,389 (46.8%) were from local authorities, 1,468 (49.4%) from the
voluntary/independent sector and 114 (3.8%) from the private sector. Responses were
received from 945 males (34.5%) and from 1,792 females (65.5%). Findings on gender are
set out in more detail in Table 1. Similarly, Table 2 sets out figures on employment patterns
and Table 3 findings on type of unit/school.
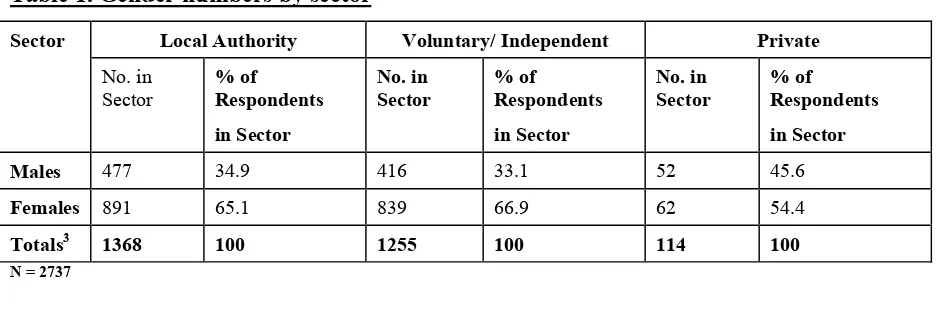
Table 1. Gender numbers by sector
N = 2737
3
Totals in Tables do not necessarily add up to 2971 (the total number of returns) as not all respondents provided all the information requested.
Local Authority Voluntary/ Independent Private Sector
No. in Sector
% of
Respondents in Sector
No. in Sector
% of
Respondents in Sector
No. in Sector
% of Respondents in Sector
Males 477 34.9 416 33.1 52 45.6
Females 891 65.1 839 66.9 62 54.4
11
Table 1 shows that the local authority and the voluntary/independent sector have a similar
gender representation of approximately 2 females (65.1% and 66.9%) employed for every
1 male (34.9% and 33.1%). However in the private sector, which has only a small
representation (approx. 4%) in this study, the above gender distinction is not so evident.
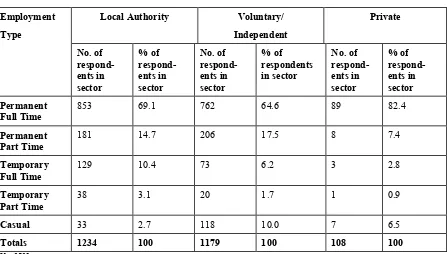
Table 2. Type of employment contract held by respondents
in each of the three sectors
Local Authority Voluntary/ Independent
Private Employment
Type
No. of respond-ents in sector
% of respond-ents in sector
No. of respond-ents in sector
% of respondents in sector
No. of respond-ents in sector
% of respond-ents in sector Permanent
Full Time
853 69.1 762 64.6 89 82.4
Permanent
Part Time 181 14.7 206 17.5 8 7.4
Temporary Full Time
129 10.4 73 6.2 3 2.8
Temporary
Part Time 38 3.1 20 1.7 1 0.9
Casual 33 2.7 118 10.0 7 6.5
Totals 1234 100 1179 100 108 100
N = 2521
[image:14.612.90.537.179.433.2]12
[image:15.612.87.512.122.451.2]Table 3 below shows the number of responses from each type of establishment by sector.
Table 3: Number of responses from each type of establishment by sector
Local Authority
Voluntary/ Independent
Private Unit/School Type
No. in Sector
% in Sector
No. in Sector
% in Sector
No. in Sector
% in Sector Res. Home (without Educ.) 1032 74.3 205 14.0 - -
Res.Home/School (with Educ.)
105 7.6 408 27.8 103 90.4
Res. Home: Disability (without Educ.)
21 1.5 92 6.3 - -
Res.Home/School:
Disability(with Educ.) 28 2.0 363 24.7 11 9.6
Care Leavers 45 3.2 - - - -
Respite Care 73 5.3 226 15.4 - -
Secure Care 85 6.1 124 8.4 - -
Close Support Unit4 - - - -
Young Homeless - - 50 3.4 - -
Totals 1389 100 1468 100 114 100
N = 2971
Almost three quarters (74%) of the respondents in local authority units work in residential
homes (without education), whereas just over 90% of employees in the private sector
work in residential homes/schools (with education), although it should be noted that only
two types of provision have been recorded for the small private sector. In the voluntary/
independent sector there is less of a concentration on one particular type of care. The
four largest percentages – 28%, 25%, 15% and 14% - have been recorded for residential
home/school (with education), residential home/school: disability (with education),
respite care and residential home (without education) respectively.
Qualifications which are currently recognised by most employers
In order to analyse how many staff are likely to be recognised as qualified, we have had
to make some assumptions as to which qualifications the Scottish Social Services Council
(SSSC) might recognise. Whilst there will undoubtedly be debate as to whether all of the
4
13
qualifications listed here should be recognised, we suggest that the qualifications listed
are those most likely to be
considered
for recognition as they already have widespread
recognition from employers. There is not, however, uniformity across the sector. A
small number of employers have been striving for a fully Diploma in Social Work
(DipSW) qualified residential child care workforce. Some employers will only recognise
SVQ3 if it is underpinned by an HNC or vice versa - a position discussed more fully later
in this report.
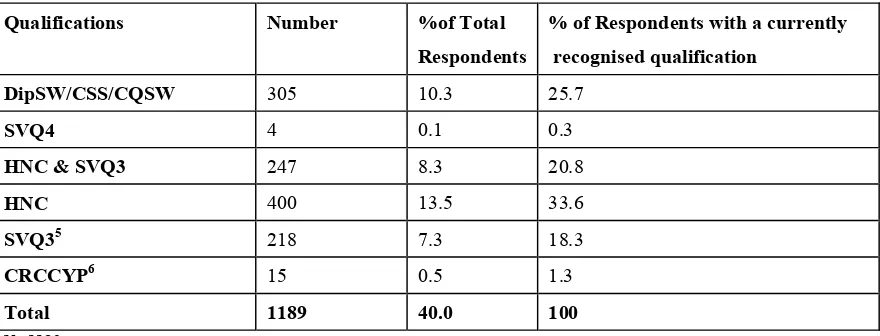
[image:16.612.87.528.260.434.2]Of the 2,971 records, 1189 staff (40.0%) indicated that they have such a qualification.
Table 4 below shows the qualifications held by the highest qualification indicated by the
respondent.
Table 4: Qualifications held
Qualifications Number %of Total
Respondents
% of Respondents with a currently recognised qualification
DipSW/CSS/CQSW 305 10.3 25.7
SVQ4 4 0.1 0.3
HNC & SVQ3 247 8.3 20.8
HNC 400 13.5 33.6
SVQ35 218 7.3 18.3
CRCCYP6 15 0.5 1.3
Total 1189 40.0 100
N= 1189
The most commonly held qualification is an HNC – 21.8% of all staff and 54.4% of all
staff with a currently recognised qualification hold this one. This is followed by SVQ3 -
15.6% of all staff and 39.1% of staff with a currently recognised qualification. However,
there is overlap between these groups. In total, 29.1% of all staff have one or both of
these qualifications. Over 10% (10.3%) of all staff have a DipSW, CSS or CQSW. Only
a tiny percentage of staff (0.1%) hold an SVQ4 and slightly more (0.5%) a CRCCYP.
The latter qualification was discontinued in 1979 and numbers holding it will inevitably
diminish over time. It was not recognised by CCETSW as equivalent to DipSW.
However, it is the only extant residential child care qualification and, therefore, merits
serious consideration for recognition at least at HNC level.
As well as recording the qualifications held, the respondents were also asked to indicate if
they were undertaking any study at present and, if so, to indicate which qualifications.
5
SVQ 3 may be in "Care", "Caring for Children and Young people" or "Promoting Independence". A small number of workers have indicated that they have 2 SVQ3 qualifications –SVQ3 in Care and SVQ3 Caring for Children & Young People. They have only been counted once under SVQ3 as it is the level of educational achievement that is recorded and not the number of qualifications each individual has. 6
[image:16.612.88.528.264.432.2]14
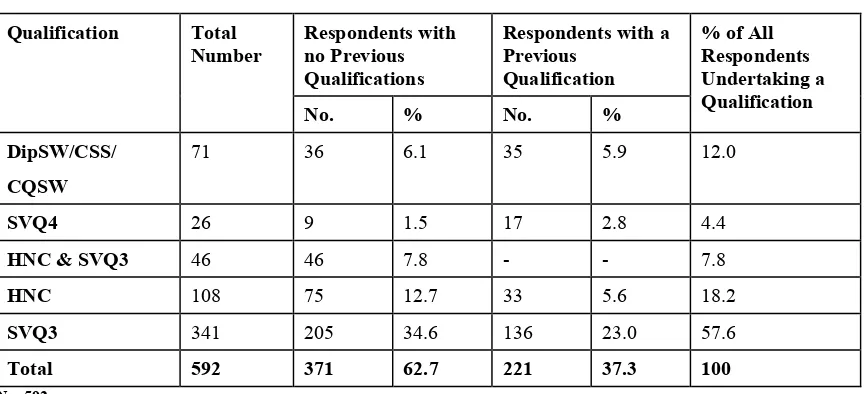
[image:17.612.92.525.176.373.2]Table 5 below shows that 592 respondents (19.9%) are currently undertaking a
qualification, 371 of whom (62.7%) had no previous qualifications that might be
recognised. Two hundred and twenty one respondents (37.3%) do have a previous
qualification that might be recognised, the majority (136) of whom had an HNC and are
now undertaking an SVQ3.
Table 5: Qualifications currently being undertaken that might be recognised
7Respondents with no Previous Qualifications
Respondents with a Previous
Qualification Qualification Total
Number
No. % No. %
% of All Respondents Undertaking a Qualification
DipSW/CSS/ CQSW
71 36 6.1 35 5.9 12.0
SVQ4 26 9 1.5 17 2.8 4.4
HNC & SVQ3 46 46 7.8 - - 7.8
HNC 108 75 12.7 33 5.6 18.2
SVQ3 341 205 34.6 136 23.0 57.6
Total 592 371 62.7 221 37.3 100
N = 592
Nearly 20% of total staff are currently undertaking qualifications. Providing they
successfully complete their qualifications, this is an encouraging figure. It is also one
that is likely to increase, given the uptake of SIRCC qualifying courses since the audit
was undertaken. The majority, approximately 13% of total staff
and over half (65.4.%)
of those currently undertaking a qualification, are undertaking SVQ3. Significantly the
numbers currently involved in undertaking the other qualifications that might be
recognised are relatively small.
A different picture emerges for those currently undertaking a qualification from those
who already hold a qualification that may be recognised. In place of the HNC, which
was the most widely held qualification, 54.4% of staff with a qualification, 65.4% of
those undertaking a qualification are doing SVQ3 either on its own or in partnership with
HNC. However, only a small number (46) are doing the latter.
Geographical variations
We decided to identify any geographical differences in the levels of qualifications either
held or being undertaken both to gain a more detailed view of the workforce and because
it will have implications for the level of provision of qualifying courses in different
7
15
regions. For the purpose of this piece of work the regions were identified as – North of
Scotland, South East Scotland, Tayforth and West of Scotland.
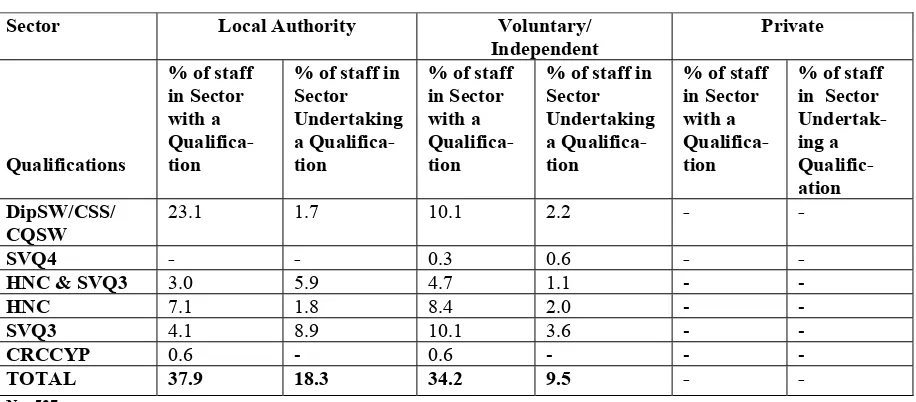
8NORTH OF SCOTLAND
[image:18.612.87.545.259.460.2]The total number of returns in the North was 527 (representing 17.7% of total returns in
the audit) of which 169 (32.1%) were from the local authority, 358 (67.9%) from the
voluntary/independent sector, and none from the private sector. Table 6 below shows the
percentage of respondents in each of these sectors who either have or are undertaking a
currently recognised qualification.
Table 6: Percentage of staff who have or are currently undertaking a
likely to be recognised qualification in the North of Scotland
Sector Local Authority Voluntary/
Independent Private
Qualifications
% of staff in Sector with a Qualifica- tion
% of staff in Sector Undertaking a Qualifica- tion
% of staff in Sector with a Qualifica- tion
% of staff in Sector Undertaking a Qualifica- tion
% of staff in Sector with a Qualifica- tion
% of staff in Sector Undertak-ing a Qualific- ation DipSW/CSS/ CQSW
23.1 1.7 10.1 2.2 - -
SVQ4 - - 0.3 0.6 - -
HNC & SVQ3 3.0 5.9 4.7 1.1 - -
HNC 7.1 1.8 8.4 2.0 - -
SVQ3 4.1 8.9 10.1 3.6 - -
CRCCYP 0.6 - 0.6 - - -
TOTAL 37.9 18.3 34.2 9.5 - - N = 527
In the North of Scotland, 35.0% of respondents, (37.9% of staff in the local authority
sector and 34.2% of staff in the voluntary/independent sector) have indicated that they
hold a currently recognised qualification. There are differences in the levels of
qualifications between the sectors; for example, the local authority has a considerably
higher percentage of staff who are DipSW qualified than the voluntary/independent
sector. Percentages for those who are currently undertaking a qualification (13.5% of all
staff in the North) are considerably less than the national average. There are almost twice
as many staff in the local authority sector (18.3%) undertaking a qualification as in the
8
The geographical groupings used to record data are the same as those used by SSSC consortia and cover any units or schools located in:-
North of Scotland -Aberdeen, Aberdeenshire, Moray, Highland, Western Isles, Shetland, Orkney
South East Scotland - City of Edinburgh, East Lothian, Midlothian, West Lothian, Scottish Borders
Tayforth - Angus, Dundee, Perth & Kinross, Fife, Stirling, Clackmannan, Falkirk
16
voluntary/independent sector (9.5%). In both sectors, the majority of those currently
undertaking one of the recognised qualifications are doing so at HNC and/or SVQ3 level .
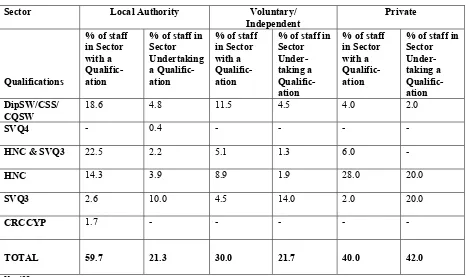
SOUTH EAST SCOTLAND
The total number of returns in the South East of Scotland was 438 (representing 14.7% of
the total number of returns) of which 231 (52.7%) were from local authorities, 157
(35.9%) were from the voluntary/independent sector, and 50 (11.4 %) were from the
private sector. The table below shows the percentage of respondents in each sector who
are either undertaking or have a currently recognised qualification.
Table 7: Percentage of staff who have or are currently undertaking a
likely to be recognised qualification in the South East of Scotland
Sector Local Authority Voluntary/
Independent Private
Qualifications
% of staff in Sector witha Qualific- ation
% of staff in Sector Undertaking a Qualific- ation
% of staff in Sector with a Qualific- ation
% of staff in Sector Under- taking a Qualific-ation
% of staff in Sector with a Qualific-ation
% of staff in Sector Under-taking a Qualific-ation DipSW/CSS/
CQSW 18.6 4.8 11.5 4.5 4.0 2.0
SVQ4 - 0.4 - - - -
HNC & SVQ3 22.5 2.2 5.1 1.3 6.0 -
HNC 14.3 3.9 8.9 1.9 28.0 20.0
SVQ3 2.6 10.0 4.5 14.0 2.0 20.0
CRCCYP 1.7 - - - - -
TOTAL 59.7 21.3 30.0 21.7 40.0 42.0
N = 438
In the South East of Scotland 46.8% of all respondents have a currently recognised
qualification and another 23.8% are currently undertaking one or more of these
qualifications. Here we find that there are considerably higher percentages of staff in the
local authority who hold a currently recognised qualification (59.7%) than in either the
voluntary/independent (30.0%) or private sectors (40.0%). Similarity can be found
between the local authority (21.3%) and voluntary/independent (21.7%) sectors for
qualifications currently being undertaken but the private sector (42.0%) has a much larger
proportion of its staff currently undertaking qualifications. As in the North, we find that
the qualifications most commonly being undertaken are HNC and/or SVQ3.
[image:19.612.86.552.279.556.2]17
TAYFORTH
[image:20.612.86.560.237.505.2]The total number of returns in Tayforth was 370 (representing 12.5% of total returns in
the audit) of which 164 (44.3%) were from local authorities, 169 (45.7%) from the
voluntary/independent sector, and 37 (10%) were from the private sector. Table 8 below
shows the percentage of respondents in each sector who either have, or are undertaking, a
currently recognised qualification.
Table 8: Percentage of staff who have or are currently undertaking a
likely to be recognised qualification in Tayforth
Sector Local Authority Voluntary/
Independent Private
Qualifications
% of staff in Sector with a Qualifica- tion
% of staff in Sector Undertaking a Qualifica- tion
% of staff in Sector with a Qualifica- tion
% of staff in Sector Undertaking a Qualifica- tion
% of staff in Sector with a Qualifica- tion
% of staff in Sector Undertaking a Qualifica- tion DipSW/CSS/
CQSW 18.3 3.0 10.7 5.9 8.1 -
SVQ4 - 0.6 1.2 - - -
HNC & SVQ3 13.4 1.2 2.4 1.8 - 13.5
HNC 14.6 1.8 15.4 3.6 5.4 2.7
SVQ3 7.3 20.7 4.7 4.1 18.9 8.1
CRCCYP - - - - - -
TOTAL 53.6 27.3 34.4 15.4 32.4 24.3
N = 370
18
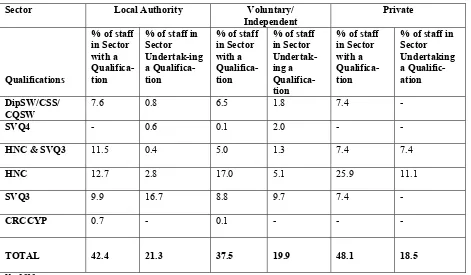
WEST OF SCOTLAND
The total number of returns in the West of Scotland was 1636 representing 55.1% of total
returns in the audit of which 825 (50.4%) were from local authorities, 784 (47.9%) from
the voluntary/independent sector, and 27 (1.7%) were from the private sector. The
following table shows the percentage of respondents in each sector who have or are
undertaking a currently recognised qualification.
Table 9: Percentage of staff who have or are currently undertaking a
likely to be recognised qualification in the West of Scotland
Sector Local Authority Voluntary/
Independent Private
Qualifications
% of staff in Sector with a Qualifica- tion
% of staff in Sector Undertak-ing a Qualifica- tion
% of staff in Sector with a Qualifica- tion
% of staff in Sector Undertak- ing a Qualifica- tion
% of staff in Sector with a Qualifica-tion
% of staff in Sector Undertaking a Qualific- ation DipSW/CSS/ CQSW
7.6 0.8 6.5 1.8 7.4 -
SVQ4 - 0.6 0.1 2.0 - -
HNC & SVQ3 11.5 0.4 5.0 1.3 7.4 7.4
HNC 12.7 2.8 17.0 5.1 25.9 11.1
SVQ3 9.9 16.7 8.8 9.7 7.4 -
CRCCYP 0.7 - 0.1 - - -
TOTAL 42.4 21.3 37.5
19.9 48.1 18.5
N = 1636
In the West of Scotland 40.2% of all respondents have indicated that they hold a
qualification which is likely to be recognised, with some 20.6% currently undertaking
one or more of these qualifications. Here we see that the private sector (48.1%) has a
higher percentage of qualified staff than the local authority (42.4%) or
voluntary/independent (37.5%) sectors. A considerably lower proportion of staff in the
West hold a qualification at DipSW level than the other three regions. There is more
consistency across all three sectors in the West when looking at those who are currently
undertaking a qualification: 18.5% in the private sector, 19.9% in the
voluntary/independent sector and 21.2% in local authorities. As with the previous
regions, the overall tendency is towards staff undertaking qualifications at HNC and/or
SVQ level 3.
[image:21.612.85.556.221.496.2]19
Qualifications which may be recognised in certain settings
Residential childcare is not provided in homogeneous settings and staff remits and roles
vary considerably. Children and young people of different ages, abilities, difficulties,
cultures and life histories live in large, medium or small establishments, with or without
education on the premises, for short, long or respite periods, in conditions of openness or
security, and run by organisations with different philosophies, faiths or belief systems.
Such diversity is generally a strength and provides the possibility of real choice. It also
means that staff may require different knowledge and skills for different settings. The
following qualifications are ones which may be considered appropriate, and recognisable,
in some settings but less so or not at all in other settings. Table 10 below gives the
number of staff who hold only these qualifications. There are a number of staff who have
these qualifications but they also have another qualification which might be recognised
and they have, therefore, been included previously.
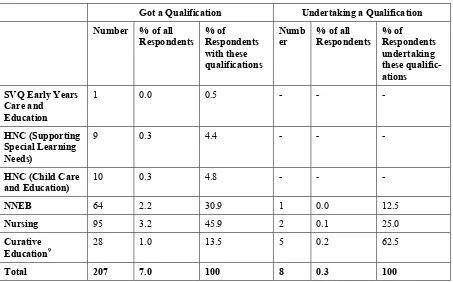
Table 10: Number of staff holding or undertaking a qualification that may be
recognised in certain settings
Got a Qualification Undertaking a Qualification
Number % of all
Respondents % of Respondents with these qualifications
Numb
er % of all Respondents % of Respondents undertaking these qualific-ations SVQ Early Years
Care and Education
1 0.0 0.5 - - -
HNC (Supporting Special Learning Needs)
9 0.3 4.4 - - -
HNC (Child Care
and Education) 10 0.3 4.8 - - -
NNEB 64 2.2 30.9 1 0.0 12.5
Nursing 95 3.2 45.9 2 0.1 25.0
Curative
Education9 28 1.0 13.5 5 0.2 62.5
Total 207 7.0 100 8 0.3 100
N = 215
Some 215 (7.3%) of staff have indicated that they are either holding (207) or undertaking
(8) a qualification that may be recognised in certain settings. The settings where these
qualifications might be recognised are as follows:
9
[image:22.612.86.539.322.604.2]20
•
Two and a half percent of all staff currently hold either an SVQ Early Years Care
and Education, an HNC (Child Care and Education) or an NNEB qualification.
These qualifications might be considered as a recognisable qualification in units
and/or schools working with groups of younger children or young women with their
babies.
•
Four and a half percent of all staff hold or are undertaking either a nursing, curative
education or HNC (Supporting Special Learning Needs) qualification. They might
find that they are considered to hold a recognised qualification in units/schools for
children with disabilities.
[image:23.612.86.529.320.630.2]The classification used by SIRCC for types of units and schools does not provide the
level of detail necessary to discover whether staff with SVQ Early Years Care and
Education, HNC (Child Care and Education) or NNEB qualifications are working with
“appropriate” children. However, it is possible to see where staff with nursing or other
qualifications for working with children with disabilities are based - see table 11 below:
Table 11: Staff with a qualification that might be recognised in certain settings by
type of establishment
Nursing Curative Education HNC
(Supporting Special Learning Needs) Qualification
Type of Unit/School
No. % No. % No. % Residential Home without
Education. 17 17.9 - - 2 22.2
Residential Home/School with Education
6 6.3 - - 1 11.1
Residential Home Disability
without Education. 10 10.5 - - - -
Residential Home/School
Disability with Education 29 30.5 28 100 1 11.1
Care Leavers 1 1.1 - - - -
Respite Care 26 27.4 - - 5 55.6
Close Support Unit 4 4.2 - - - -
Young Homeless 2 2.1 - - - -
Total 95 100 28 100 9 100
N = 132
21
Qualifications that may be relevant but are less likely to be recognised
[image:24.612.84.529.302.479.2]There are significant numbers – 196 or 6.6% - of care staff who have (191) or are
undertaking (5) higher qualifications in subjects which are related or relevant to
residential child care but where the curriculum and/or the lack of assessed placements
mean that the qualifications are less likely to be recognised. These include teaching,
community education, youth and community and degrees
10which might be considered
relevant. The small number of staff holding the Advanced Certificate in Residential
Child Care, who have no other relevant qualifications, are also included here. This
certificate course was provided at M level for a number of years by Glasgow University.
Unfortunately, it was not submitted to CCETSW for approval and so its standing is
uncertain. Nevertheless, holders might be able to submit it for accreditation of prior
learning. Details of staff holding/undertaking such qualifications are given below.
Table l2: Staff holding or undertaking a relevant but less
likely to be recognised qualification
Got a Qualification Undertaking A Qualification Qualification
No. % No %
Teaching 31 16.2 1 20.0
Community Education 22 11.5 4 80.0
Youth and Community 14 7.3 - -
Other Degrees which might
be relevant 118 61.8 - -
Advanced Certificate in Residential Childcare
6 3.1 - -
Total 191 100 5 100
N = 196
We are aware that staff holding the above qualifications are sometimes currently required
to undertake HNC's and SVQ's in order to become 'qualified'. We consider that it would
make much more sense for them to be enabled to achieve a 'fast track' DipSW or
equivalent and make proposals for this later in this report.
General educational levels of unqualified staff
We attempted through the audit to gain information concerning general educational levels
of residential childcare staff who do not have a recognisable or relevant qualification.
Our aim was to consider how straightforward or difficult unqualified staff might find it to
gain a qualification and whether some, e.g. existing degree holders, were more likely to
aspire to a degree/diploma level qualification rather than an HNC/SVQ level
10
22
qualification. We classified the levels using a modified version of the Scottish Credit and
Qualifications Framework.
11The findings were as follows:
Got a Qualification Undertaking a Qualification
Number % Number %
Degrees, Masters, and PhDs
(equivalent to SCQF 9-12) 42 4.0 13 59.1
Dip HE, HND, SVQ level 4
(equivalent to SCQF 8) 20 1.9 2 9.1
HNC, Advanced Highers, Cert HE (equivalent to SCQF 7)
32 3.1 - -
Highers, SVQ3 (equivalent to SCQF 6)
83 7.9 1 4.6
Standard Grades, SVQ2, SVQ1 (equivalent to SCQF 3-5)
131 12.5 3 13.6
Other Qualifications12 90 8.6 3 13.6
Incomplete/Unclassifiable
Information13 37 3.5 - -
No Educational Qualifications Recorded
613 58.5 - -
Total 1048 100 22 100
[image:25.612.84.524.108.414.2]N=1070
Table 13: General educational levels of unqualified staff
It is apparent that the majority of currently unqualified staff do not have a high general
level of education. Six hundred and thirteen (58.5%) of this group did not record any
qualifications whatever, whereas only 177 (16.9%) had general educational qualifications
at the equivalent of Highers or above. Some of the latter group might be eligible for
direct admission to Degree/Diploma level courses. The former group may well need
basic educational assistance in order to achieve a qualification. Some of those in this
group may prove unable to achieve a qualification.
Overview of findings
Knowing the overall picture does not necessarily mean that all organisations and sectors
share the same experience in relation to the number of qualified staff, or staff in training
that they employ. Staff at different levels, or with different employment patterns, are not
uniform in their pattern of qualifications.
11
An Introduction to the Scottish Credit and Qualifications Framework. Scottish Executive (9/2001). Enterprise and Lifelong Learning Department
12
e.g. D33, D34, K100, practice teaching, CALM, TCI. 13
23
Tables 14 & 15 show the number of staff holding or currently undertaking a qualification
by employment position. Unsurprisingly, there are significant differences between
management staff and other staff. If, as seems possible, the DipSW (or equivalent) is
established as the recognised qualification for Heads of Care, Unit/House Managers,
Depute Unit/House Managers and Senior Residential Care Workers, then there is still a
very considerable proportion of these staff who will be required to achieve these
qualifications. At the other end of the scale, and again unsurprisingly, it can be seen that
Night Care and Sessional/Casual Workers are least likely to hold any qualifications that
may be recognised.
Variation is also evident in the type of employment contract held by staff. Tables 16 and
17 show the number of staff presently holding or undertaking a currently recognised
qualification by the type of employment contract they hold. Just under half (49.3%) of
full time permanent staff and less than one quarter (22.7%) of permanent part time staff
hold a currently recognised qualification; whilst just over one quarter (25.4%) of
temporary full time staff and just over one eighth (13.6%) of temporary part time staff
also hold one of these qualifications
.
Only 15.0% of those employed on a casual contract
have indicated that they hold such a qualification. The majority of staff with a currently
recognised qualification have either an HNC or SVQ3 or a combination of both of these
qualifications; although, in the case of permanent full time staff there is a more even
distribution of qualifications held between DipSW, HNC, SVQ3 or a combination of
HNC with SVQ3.
24
DIPSW SVQ 4 HNC &SVQ3 HNC SVQ3 CRCCYP QUALIFICATIONS
WHICH MAY BE RECOGNISED IN CERTAIN
SETTINGS
RELEVANT BUT LESS LIKELY TO BE RECOGNISED QUALIFICATIONS
ALL OTHER
RESPONDENTS14 TOTALS
Employment Position
No. % of Respon- dents in each Position
No. % of Respon- dents in each Position
No. % of Respon- dents in each Position
No. % of Respon- dents in each Position
No. % of Respon- dents in each Position
No. % of Respon- dents in each Position
No. % of Respon- dents in each
Position
No. % of Respon- dents in each
Position
No. % of Respon- dents in each Position
No. % of Respon- dents in each Position Head of Care
[based on site]
27 56.2 1 2.1 - - 1 2.1 - - 3 6.3 9 18.7 2 4.2 5 10.4 48 100
Unit/House Manager/ Leader/OIC/ Senior Co-worker
95 47.3 - - 4 2.0 10 5.0 13 6.5 3 1.5 37 18.4 8 4.0 31 15.4 201 100
Depute Unit /House Manager /OIC
53 28.8 2 1.2 28 15.2 26 14.1 6 3.3 - - 12 6.5 8 4.3 49 26.6 184 100
Senior Residential Care Worker
26 10.4 - - 37 14.7 36 14.3 33 13.1 3 1.2 12 4.8 16 6.4 88 35.1 251 100
Residential Care Worker/ Co-worker
94 5.1 1 0.1 112 6.1 265 14.4 137 7.5 5 0.3 47 2.5 137 7.5 1040 56.5 1838 100
Night Care Worker
8 2.4 - - 21 6.2 36 10.6 20 5.9 1 0.3 10 2.9 9 2.6 235 69.1 340 100
Casual/
Sessional 1 2.3 - - - - 9 20.9 2 4.7 - - - - 1 2.3 30 69.8 43 100
[image:27.612.30.771.109.433.2]N = 2905
Table 14: Qualifications held by employment position
14
25
DIPSW SVQ 4 HNC &SVQ3 HNC SVQ3 CRCCYP QUALIFICATIONS
WHICH MAY BE RECOGNISED IN CERTAIN
SETTINGS
RELEVANT BUT LESS LIKELY TO BE RECOGNISED QUALIFICATIONS
ALL OTHER
RESPONDENTS15 TOTALS
Employment Position
No % of Respon- dents in each Position
No % of Respon- dents in each Position
No % of Respon- dents in each Position
No % of Respon- dents in each Position
No % of Respon- dents in each Position
No % of Respon- dents in each Position
No % of Respon- dents in each Position
No % of Respon- dents in each Position
No % of Respon- dents in each Position
No % of Respon- dents in each Position Head of Care
[based on site]
2 4.1 - - - - - - - - - - - - - - 46 95.9 48 100
Unit/House Manager/ Leader/OIC/ Senior Co-worker
7 3.5 7 3.5 - - 4 2.0 6 3.0 - - 1 0.5 - - 176 87.6 201 100
Depute Unit/ House Manager/ leader/OIC
13 7.1 7 3.7 1 0.5 2 1.1 16 8.7 - - - - - - 145 78.8 184 100
Senior Residential Care Worker
4 1.6 1 0.4 3 1.2 10 4.0 27 10.7 - - - - - - 206 82.1 251 100
Residential Care Worker /Co-worker
42 2.3 10 0.5 36 2.0 78 4.2 231 12.6 - - 6 0.3 3 0.2 1432 77.9 1838 100
Night Care Worker
2 0.7 1 0.3 3 0.9 12 3.5 40 11.7 - - - - 1 0.3 281 92.4 340 100
Casual/ Sessional
1 2.3 - - - - 2 4.7 - - - - - - - - 40 93.0 43 100
[image:28.612.42.769.109.422.2]N = 2905
Table 15: Qualifications currently being undertaken by employment position
15
26
DIPSW SVQ 4 HNC &SVQ3 HNC SVQ3 CRCCYP QUALIFICA-
TIONS WHICH MAY BE RECOGNISED IN CERTAIN SETTINGS RELEVANT BUT LESS LIKELY TO BE RECOGNISED QUALIFICA- TIONS ALL OTHER RESPONDENTS 16 TOTALS Employment Position
No % of Respon- dents in each Position
No % of Respon- dents in each Position
No % of Respon- dents in each Position
No % of Respon-dents in each Position
No % of Respon- dents in each Position
No % of Respon- dents in each Position
No % of Respon- dents in each Position
No % of Respon- dents in each Position
No % of Respon- dents in each Position
No % of Respon- dents in each Position
Permanent
Full Time 237 16.0 3 0.2 156 9.1 241 14.1 155 9.1 13 0.8 81 4.7 97 5.7 721 42.3 1704 100
Permanent
Part Time 18 4.5 - - 18 4.5 37 9.4 17 4.3 - - 26 6.6 28 7.1 251 63.6 395 100
Temporary
Full Time 11 5.4 - - 13 6.3 21 10.3 7 3.4 - - 6 2.9 29 14.1 118 57.6 205 100
Temporary
Part Time 3 5.1 - - 1 1.7 5 8.5 1 1.7 - - 1 1.7 6 10.1 42 71.2 59 100
Casual 2 1.7 - - - - 12 10.0 4 3.3 - - 1 0.8 7 5.8 94 78.4 120 100
[image:29.612.25.775.112.394.2]N = 2483
Table 16: Qualifications held which are likely to be recognised by employment contract
16
27
DIPSW SVQ 4 HNC Only HNC&SVQ3 SVQ3ONLY CRCCYP QUALIFICA-
TIONS WHICH MAY BE RECOG- NISED IN CERTAIN SETTINGS RELEVANT BUT LESS LIKELY TO BE RECOG- NISED QUALIFICA- TIONS ALL OTHER
RESPONDENTS17 TOTALS
Employment Position
No % of Respon- dents in each Position
No % of Respon- dents in each Position
No % of Respon- dents in each Position
No % of Respon-dents in each Position
No % of Respo-ndents in each Positio n
No % of Respon- dents in each Position
No % of Respon-dents in each Position
No % of Respon- dents in each Position
No % of Respon- dents in each Position
No % of Respon-dents in each Position
Permanent
Full Time 36 2.1 21 1.2 70 4.1 32 1.9 238 14.0 - - 3 0.2 2 0.1 1302 76.4 1704 100
Permanent
Part Time 10 2.5 - - 19 4.8 6 1.5 39 9.9 - - 1 0.3 2 0.5 318 80.5 395 100
Temporary
Full Time 3 1.5 - - 1 0.5 3 1.5 16 7.8 - - 3 1.5 1 0.5 178 86.8 205 100
Temporary
Part Time 1 1.7 - - 5 8.5 - - 2 3.4 - - - - - - 51 86.4 59 100
Casual 4 3.3 - - 5 4.2 2 1.7 1 0.8 - - - - - - 108 90.0 120 100
[image:30.612.31.770.112.387.2]N = 2483
Table 17: Qualifications currently being undertaken by employment contract
17
28
As can be seen in the table 18 below, there is also variation between the currently recognised qualifications held, and being undertaken, by sector.
Local Authority Voluntary/Independent Private
Got a
qualification Undertaking a qualification Got a qualification Undertaking a qualification Got a qualification Undertaking a qualification No. of Staff in Sector % of Staff in Sector No. of Staff in Sector % of Staff in Sector No. of Staff in Sector % of Staff in Sector No. of Staff in Sector % of Staff in Sector No. of Staff in Sector % of Staff in Sector No. of Staff in Sector % of Staff in Sector
DipSW 175 12.6 32 2.3 123 8.4 39 2.7 7 6.1 1 0.9
SVQ 4 - - 7 0.5 4 0.3 18 1.2 - - - -
HNC &
SVQ 3 174 12.5 20 1.4 68 4.6 19 1.3 5 4.4 7 6.1
HNC 174 12.5 38 2.7 203 13.8 56 3.8 23 20.2 14 12.3
SVQ 3 109 7.8 210 15.1 101 6.9 118 8.0 10 8.8 13 11.4
CRCCYP 11 0.8 - - 4 0.3 - - - -
Totals 643 46.2 307 22.0 503 34.3 250 17.0 45 39.5 35 30.7
[image:31.612.71.558.137.415.2]N = 1783
Table 18: Qualifications held and currently being undertaken by sector
What emerges here is that the voluntary/independent sector has both the lowest level of qualified staff and of staff undertaking qualifications as compared to the local authority and private sectors.
Regardless of the differences in the numbers of qualifications held and undertaken, there is consistency across all sectors in the levels of qualifications presently being undertaken. The HNC and the SVQ3 are most favoured. Amongst those who already hold a currently recognised qualification there is variation to be found between the local authority sector and both the private and voluntary/independent sectors. Local authorities have virtually equal numbers of staff who hold a DipSW (175), an HNC stand-alone qualification (174) or a combination HNC/SVQ3 qualification (174). However, in the voluntary/independent and private sectors much the highest numbers are to be found with an HNC stand-alone qualification – 203 and 23 respectively.
Arriving at a precise figure for the percentages of those who are qualified, or who have embarked on a qualifying course and are likely to qualify in the near future, depends on a number of factors:
29
ii) The percentage of staff who successfully complete the qualifying courses or awards which they are currently undertaking. For the examples given below, the percentage is assumed to be 90%.
iii) The individuals, units/schools and organisations which responded to the audit being typical of the sector as a whole. We cannot categorically say that this is the case without further analysis, but the high rate of return leads us to have reasonable confidence that they are typical. An analysis of the organisations and units/schools which did not make a return shows an over-representation of private organisations – less than half of private organisations made a return. However, the private sector is very small and this is unlikely to have a significant effect on the overall results. The rest of the non-returns were split equally between local authority units, including one secure unit, and voluntary/independent units and schools. Geographically, almost half of the non-returns were in the West, the area with the highest number of returns.
We have worked out some examples to illustrate the results if different qualifications are recognised:
Example 1
All the qualifications described as ‘may be recognised’ (DipSW/CSS/CQSW, SVQ4, HNC and SVQ3, HNC, SVQ3, CRCCYP) and ‘may be recognised in certain settings’ (nursing, curative education, SVQ Early Years Care and Education, NNEB, HNC (Child Care and Education), HNC (Supporting Special Learning Needs)) are recognised by the SSSC. A ‘fast track’ diploma qualification is available for those with relevant higher educational qualifications. This would result in:
♦ 47.0% of current staff being recognised as qualified
♦ 11.5% of current staff achieving a recognised qualification in the near future
♦ 6.4% of current staff who hold relevant but not recognised qualification being eligible to achieve a 'fast track' qualification
♦ 35.1% of current staff being considered unqualified or failing or withdrawing from a qualifying course/award which they are currently undertaking
Example 2
Only those staff who have obtained DipSW, HNC and SVQ3/4, or CRCCYP are recognised as qualified. Nursing and curative education qualifications are recognised in units/schools for children with disabilities. A ‘fast track’ Diploma level qualification is available for those with relevant higher education qualifications. This would result in:
♦ 22.2% of current staff being recognised as qualified
30
♦ 6.4% of current staff who hold relevant but not recognised qualifications being eligible to achieve a ‘fast track’ qualification
31
4.THE FINDINGS IN CONTEXT
It is important to compare our findings with other published findings concerning residential child care workers’ qualifications, both to consider how much progress has been achieved and to see whether different methods of data collection throw up different results.
[image:34.612.106.509.263.436.2]The data used in Another Kind of Home18 relates to 1990 and 1991. The data published by the then Social Work Services Group, was as follows:
Table 19: Staff qualifications in 1990
Total Social Work
Qualified1 OtherQualifications
2 None of these
No. % No. % No. %
Officers
in Charge 110 45 41 34 31 31 28
Assistant Officers in Charge
211 63 30 39 18 109 52
Teachers 76 15 20 61 80 0 -
Other
Staff 214 17 8 19 9 178 83
1
CQSW and CSS
2
Other social service, nursing, nursery nurse, occupational therapy, youth and community qualifications, teaching and instructor’s qualifications.
The survey commissioned to provide information for Another Kind Of Home19 also covered voluntary and private establishments. Overall, 83% of staff had no relevant qualifications and only 14% had a Diploma in Social Work or equivalent.
In 1989, there were 2,994 whole time equivalent residential child care workers in Scotland. Although the number of children and young people accommodated in residential units and schools has decreased, there has been a very major increase in staffing to 4,220 whole time equivalents in March 2000. 20 (Our figure for 1 January 2001 is 4,600 but this counts all staff rather than whole time equivalents). This
18
Another Kind of Home, HMSO (1992)
19
op cit (1992)
20
32
increase may, in part, explain why it has proved so hard to meet the qualifications targets set in Another Kind of Home.21
A further notable change has been the increasing number and proportion of residential child care staff based in the voluntary and private sectors.
1989 1994 1998 1999 2000
No. % No. % No. % No. % No. %
Local Authority 2,090 70 2,344 69 2,320 65 2,048 57 2,246 53
Voluntary/Private 904 30 1,057 31 1,260 35 1,530 43 1,973 47
[image:35.612.110.506.143.230.2]Total 2,994 100 3,402 100 3,580 100 3,578 100 4,220 100
Table 20: Residential child care staff (FTE) by sector 1989 – 2000
The staffing figures found in this audit, which counted all staff rather than FTE, appear to show a further development in this trend. We found 46.8% of respondents working in local authorities and 53.2% in the voluntary/private sectors.
The targets established in Another Kind of Home22 were as follows:-
Recommendation 47: Local authorities and independent organisations should aim to achieve a position in which 30% of all residential child care staff, and 90% of all senior residential child care staff hold a diploma in social work or equivalent.
Recommendation 48: Local authorities and independent organisations should aim to achieve a position, in which 60% of all residential child care staff are assessed as competent at HNC/SVQ level 3.
The following comments from Another Kind of Home23 remain pertinent. “Residential child care establishments are faced with meeting needs which are amongst the most complex and challenging of any social work service… It is generally accepted that field social workers should all be fully qualified, and it is far from clear that they have more demanding or complex responsibilities. When young people or children are admitted to residential care it should be because they need the special care and skills available; the staff should, therefore, be equipped to deliver skilled care…. The introduction of the specific grant for social work training in local authorities has included a proposed target of 30% of residential child care staff holding a Diploma in Social Work or equivalent. This is appropriate, but the longer
21
op cit (1992)
22
op cit (1992)
23
33
term aim should be that 60% of residential care staff are qualified at this level; that may not be achievable before the next decade.”24
Unfortunately, this target proved far from achievable over the next decade. Targets were re-established in 1999.25 It was anticipated that 65% of officers in charge and deputes would have a DipSW or equivalent by 2000 and 90% by 2003 and that 50% of care staff would have an HNC/SVQ3 or equivalent by 2000 and 50% by 2003. Whilst numbers holding a Diploma in Social Work have significantly increased, their proportion in the overall staff group has actually fallen from 14% to 10%. However, somewhat more encouragingly, 41% of officers in charge and deputes now hold a DipSW or equivalent Likewise the target of 60% of the workforce being HNC/SVQ 3 qualified has not been achieved. Only 8% of the workforce holds both qualifications and 29% either one or both.
The statistics on qualifications collected by the then Social Work Services Group (SWSG) and subsequently the Scottish Executive, only relate to the local authority sector. The most recently published figures were collected in 1999.26 It proved difficult to compare these with the data we collected in this audit as the Scottish Executive count all qualifications held, rather than highest qualifications held, so considerable numbers of staff are double, or possibly even treble counted. They also have a category “Other Social Services Qualifications” which 3% of staff hold (although possibly in combination with other qualifications). We offered this as a category in this audit but found most of the qualifications listed, such as D33 and D34 or K100 were ones that were highly unlikely to be recognised as stand-alone qualifications. Consequently, we listed these staff, where they held no other qualifications, as unqualified. We also, unlike the Scottish Executive, listed those with non-relevant degrees and post-graduate qualifications as unqualified.
Given the above caveats, we were able to compare some qualifications as follows:
DipSW/CCS/CQSW HNC and/or SVQ3/4 Total holding a
currently recognised qualification Qualifications held by
staff in this qualifications audit
12.6% 33% 45.6% 27
Qualifications held as reported by SWSG in 1999
[image:36.612.103.512.457.556.2]11% 26% 37% 27
Table 21: Levels of qualifications held by local authority staff
It would appear that over the period 1999 – 2001 there has been a modest increase in the percentage of local authority staff who hold a qualification. Given the current
24
op cit (1992)
25
Specific Grant for Social Work Training Circular, SWSG 1999
26
Staff of Scottish Local Authority Social Work Departments 1999, Scottish Executive (2001)
27
34