Int. J. Electrochem. Sci., 14 (2019) 1093 – 1106, doi: 10.20964/2019.02.48
International Journal of
ELECTROCHEMICAL
SCIENCE
www.electrochemsci.orgCatalytic Activity of Ni-YSZ composite as Anode for Methane
Oxidation in Solid Oxide Fuel Cells
Yanting Tian1,*, Zhe Lü2,*, Xiang Guo1, Pingping Wu1
1 College of Physics and Optoelectronics, Taiyuan University of Technology, Taiyuan 030024, China 2 Department of Physics, Harbin Institute of Technology, Harbin 150001, China
*E-mail: [email protected], [email protected]
Received: 4 September 2018 / Accepted: 12 November 2018 / Published: 5 January 2019
Natural gas has been exploited as an available energy source for solid oxide fuel cells in recent years. However, the problem of carbon deposition that forms on nickel-based anodes by using direct methane results in performance failure of cells. It is well known that the catalytic partial oxidation of methane is a good solution to suppress carbon formation. Herein, we present an investigation of the catalytic activity of Ni/YSZ cermet anodes as a function of the CH4/O2 flow rate ratio (1 ≤ Rin ≤ 5). The behavior of
methane catalytic activity was characterized using mass spectrometry (MS) and temperature-programmed oxidation (TPO). The catalytic activity of methane oxidation at 700 °C showed that Ni oxidation occurred at Rin ≤ 1.67. A basic equilibrium to prevent carbon deposition and Ni oxidation
occurred at Rin = 2.5, which exhibited the best activity among the Ni/YSZ electrodes. Through the
electrochemical measurements and impedance spectroscopy analysis of the cell, it was proved that the cell possessed the lowest ohmic resistance and optimized output performance at Rin = 2.5. In addition, a
stable cell operation at 0.9 V was guaranteed without serious degradation.
Keywords: Solid Oxide Fuel Cells, Catalytic Activity, CH4/O2 Ratio, Ni-YSZ Anode, Partial
Oxidation
1. INTRODUCTION
Solid oxide fuel cells (SOFCs) have attracted particular attention recently due to their environmental friendliness, high energy conversion efficiency and fuel flexibility [1]. In addition to hydrogen, hydrocarbon fuels, carbon monoxide, and solid carbon can all be used as potential fuels for SOFCs [2]. Hydrocarbon fuels are more widely available and are more safely stored and transported than hydrogen. Additionally, using hydrocarbon as fuel can further reduce the cell operating cost by eliminating the external reforming process. Specifically, methane (CH4), which has an abundant and
As the commonly used anode material in SOFCs, Ni-based cermet has excellent electrical conductivity and good catalytic properties for fuel oxidation. However, hydrocarbon fuels can form carbon deposits on Ni catalysts, which are deposited in the internal pores of the anode and block the fuel diffusion into the porous electrode. As a result, the gas diffusion resistance of the cell is increased and the electrochemical catalytic activity of the Ni-based cermet is deactivated [6-8]. Significant efforts have been spent on preventing carbon formation over Ni-based anodes. When methane is adopted as the fuel for SOFCs, it is typically reformed to H2 and CO by indirect reforming processes, such as steam
reforming, dry reforming and catalytic partial oxidation (CPOX) [9-11]. The addition of oxygen-containing gases into the anodic feeding gas mixture could increase the O/C ratio and therefore thermodynamically avoid carbon formation [12]. In this sense, the catalytic partial oxidation of CH4 over
the Ni catalyst could be a better cost- and energy-efficient way to restrain carbon formation and obtain a high CH4 conversion efficiency.
Existing studies have showed the potential superiority of adding air to the anodic feeding gas mixture. Pillai et al. [13] reported that the stability of the cell performance could be increased by using air as an additive to methane. Aslannejad et al. [14] explored the impact of the addition of air to methane for the Ni/YSZ anode supported SOFCs. The optimal gas component of a 1:5 air to methane addition was determined. Through impedance spectroscopy analysis and voltage measurements, it was proved that both carbon deposition and anode delamination were avoided under this condition. Lee et al. [15] demonstrated that robust CPOX-based SOFCs fueled by CH4 could restrain carbon deposition and Ni
oxidation. Adding oxygen to methane could fundamentally prevent carbon deposition, while Ni oxidation was prevented by (electro)catalytic reaction controls and oxygen ionic conductors. To date, however, few studies have truly investigated the subject of the catalytic partial oxidation approach with O2 added to methane on the performance of SOFC anodes since the partial O2 pressure in the gas chamber
should be maintained below 10-18 atm to achieve an electrochemical potential gradient of the SOFC [15]. In addition, an excessive O2 content in the anode gas chamber may result in Ni oxidation [16-17].
In the present work, we focused on the study of the catalytic activity of Ni/YSZ electrodes as a function of the incoming CH4/O2 flow rate ratio (Rin). The behavior of methane catalytic oxidation was
characterized by mass spectrometry (MS) as a function of the consumption of methane and the resulting yields of H2, CO and CO2. The carbon deposition and Ni oxidation were investigated. The
electrochemical performances and impedance spectroscopy analysis of the single cell were also tested under various CH4/O2 gas flow rates.
2. EXPERIMENTAL
2.1 Catalyst preparation
activity tests.
2.2 Catalytic activity measurements
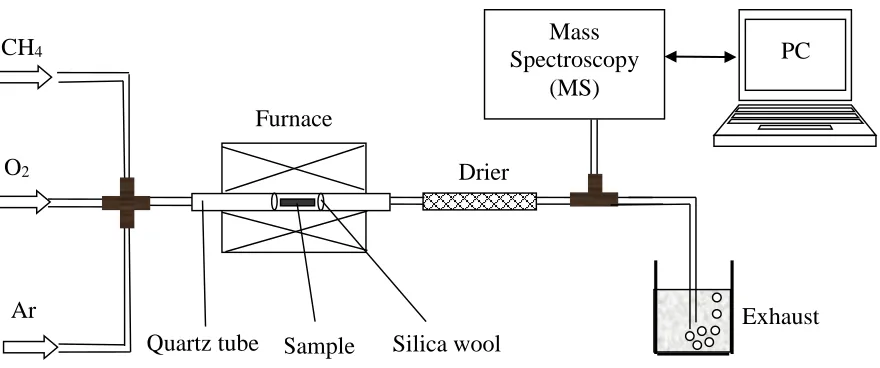
[image:3.596.79.519.257.441.2]The catalytic activity of the nickel-based samples was tested under various gas mixtures. Fig. 1 presents the schematic diagram of the experimental apparatus. The catalytic tests were performed using a fixed-bed quartz reactor (inner diameter: 8 mm). The inlet and outlet gas compositions were analyzed using an LC-D100 mass spectrometer (Ametek, America). The as-prepared Ni/YSZ catalyst samples were inserted into the middle of the quartz tube between quartz wools.
Figure 1. Schematic diagram of the experimental apparatus used for the mass spectrometer tests The carbon depositions of the Ni/YSZ electrodes under direct methane without oxygen were measured. The samples were treated under flowing CH4 (25 vol.% in Ar, 100 sccm) at 650 °C, 700 °C
and 750 °C for 2 h. The temperature was increased from 50 °C to the testing temperatures with a linear heating rate of 8 °C/min under an Ar atmosphere. Temperature-programmed oxidation (TPO) was employed to measure the amount of carbon deposition on the Ni/YSZ anodes operating in the CH4
atmosphere. The total feed flow rate was 100 sccm (10 vol.% O2 in Ar) and was controlled using mass
flow controllers.
Catalytic activity tests of the Ni/YSZ catalysts under CH4/O2 gas mixtures were conducted using
temperature-programmed reactions performed in continuous-flow methane/oxygen mixtures as a function of the CH4/O2 flow rate ratio (1 ≤ Rin ≤ 5, see Table 1). The temperature was raised from room
temperature to 850 °C at a heating rate of 10 °C/min. The CH4, CO, CO2 and H2 evolutions were recorded
as a function of the temperature. The carbon deposition behavior was characterized by temperature-programmed oxidation tests.
PC Furnace
Mass Spectroscopy
(MS)
Exhaust Sample
Quartz tube Silica wool Drier CH4
O2
Table 1. The various flow compositions of the gas mixture
Gas Rin Ar (sccm) CH4 (sccm) O2 (sccm)
1 5 70 25 5
2 2.5 65 25 10
3 1.67 60 25 15
4 1.25 55 25 20
5 1 50 25 25
The catalytic oxidation of methane under various CH4/O2 flow rate ratios at 700 °C was tested
for 5 h. The weights of the samples before and after catalytic activity measurements were recorded. The temperature-programmed oxidation tests were also employed for carbon deposition.
2.3 Fabrication and characterization of single cells
The anode-supported cells composed of Ni/YSZ anodes, YSZ electrolyte films and modified La0.7Sr0.3MnO3 (LSM) cathodes were fabricated. The anode substrates were prepared in the same way as
the NiO/YSZ catalysts calcined at 1000 °C. YSZ films were spin-coated on the anode substrates and sintered at 1400 °C for 4 h [18]. The LSM cathodes were pasted on the YSZ films with a size of 0.14 cm2, which were followed by impregnating in the Sm
0.2Ce0.8(NO3)x (SDC) solution [19]. The anode
[image:4.596.139.449.455.612.2]substrates were reduced in hydrogen at 700 °C before electrochemical performance tests.
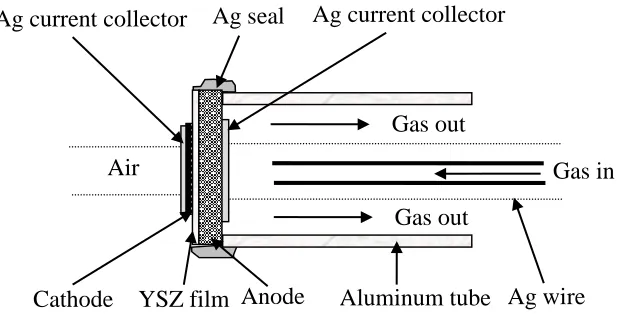
Figure 2. Schematic diagram of the cell testing arrangement
Silver paste (DAD-87, Shanghai Research Institute of Synthetic Resin, China) was used to fix and seal the fuel cell to an aluminum tube. The schematic diagram of the cell testing arrangement was shown in Fig. 2. The fuel cell was tested by the four-probe method in a furnace at 700 °C. The methane/oxygen mixtures and ambient air were used as the fuel and oxidant, respectively. The cell performances and electrochemical impedance spectra were measured by a BiStat potentiostat (Bio-logic SAS, France). The frequency ranged from 91 kHz to 0.1 Hz with a signal amplitude of 10 mV.
Gas out
Gas in Gas out
Air
3. RESULTS AND DISCUSSION
3.1 Catalytic activity of Ni/YSZ catalysts under methane fuel
The amount of carbon deposited on the anode catalyst was dependent on the evolved carbon dioxide, which was monitored by the TPO testing. Fig. 3a shows the TPO profiles of the Ni/YSZ catalysts after being in a 25% CH4-75% Ar gas mixture at different testing temperatures for 2 h. As can
be seen, the carbon dioxide peaks were found in the temperature range from 450 to 700 °C when the catalyst was programmed at 700 °C.
[image:5.596.109.483.241.523.2]
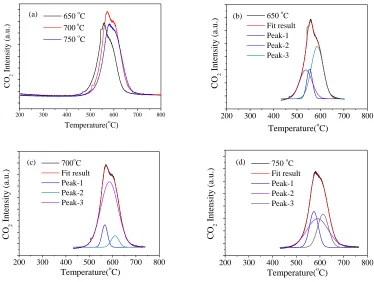
Figure 3. (a) TPO profiles of the Ni/YSZ catalyst operated at different temperatures, (b-d) The fitting results of the TPO profiles programmed at 650 °C, 700 °C and 750 °C
The TPO curves of the Ni/YSZ catalyst programmed at 750 °C possessed the same temperature range to remove the carbon deposits. However, the lower carbon dioxide peaks of 750 °C indicated a lower carbon deposit amount. The temperature to remove the carbon deposits was significantly reduced when the catalyst was programmed at 650 °C, and the carbon dioxide peaks were also lower than that programmed at 700 °C. The reactive performance of carbon oxidation could be obtained by the TPO curves. The temperature at which the carbon dioxide peak had a maximum value depended on the reactivity of the deposit; the higher the peak temperature was, the lower the carbon reactivity toward oxidation was [20]. These results indicated that the deposit had higher reactivity and the amount of deposited carbon was decreased when the Ni/YSZ catalysts were programmed at 650 °C.
The fitting results of each TPO profile are shown in Figs. 3b-3d. It is found that the carbon dioxide peaks of each TPO profile can be divided into three peaks, and the temperatures at which the
200 300 400 500 600 700 800
CO
2
In
te
n
sit
y
(a.
u
.)
Temperature(oC) 650 oC 700 oC 750 oC (a)
200 300 400 500 600 700 800
CO
2
Inte
nsity
(a.
u.
)
Temperature(oC) 650 oC
Fit result Peak-1 Peak-2 Peak-3 (b)
200 300 400 500 600 700 800
CO
2
Inte
nsity
(a.
u.
)
Temperature(oC) 700oC
Fit result Peak-1 Peak-2 Peak-3 (c)
200 300 400 500 600 700 800
(d) 750 oC
Fit result Peak-1 Peak-2 Peak-3
CO
2
Inte
nsity
(a.
u.
)
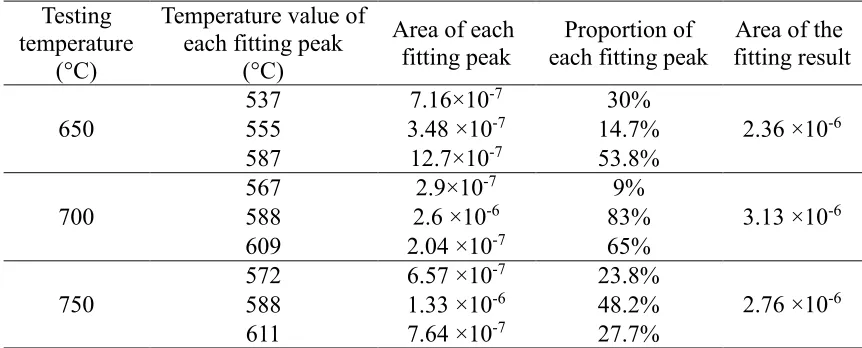
peaks have a maximum value and the area proportions of each fitting peak are shown in Table 2. The temperature values of the carbon dioxide peaks tested at 650 °C were 537, 555 and 587 °C, and the peak at 587 °C had the highest proportion of 53.8%. The temperature values of the fitting peaks tested at 700 °C and 750 °C were essentially the same. The highest proportions of 700 °C and 750 °C were both obtained at the peak of 588 °C, the same as that tested at 650 °C. By comparing the areas under the fitting curves, it was found that the TPO profile tested at 700 °C had the largest area, which had the highest amount of deposited carbon. Caine et al. [21] tested Ni/ZrO2 anodes in a dry methane/helium
[image:6.596.82.513.285.459.2]gas mixture from room temperature to 900 °C. They found that the rate of methane adsorption over the Ni/ZrO2 anodes had a maximum value at 700 °C, which was consistent with our results.
Table 2. Fitting results of the TPO tests Testing
temperature (°C)
Temperature value of each fitting peak
(°C)
Area of each
fitting peak each fitting peak Proportion of fitting result Area of the
650
537 7.16×10⁻⁷ 30%
2.36 ×10⁻⁶
555 3.48 ×10⁻⁷ 14.7%
587 12.7×10⁻⁷ 53.8%
700
567 2.9×10⁻⁷ 9%
3.13 ×10⁻⁶
588 2.6 ×10⁻⁶ 83%
609 2.04 ×10⁻⁷ 65%
750
572 6.57 ×10⁻⁷ 23.8%
2.76 ×10⁻⁶
588 1.33 ×10⁻⁶ 48.2%
611 7.64 ×10⁻⁷ 27.7%
3.2 Catalytic activity of Ni/YSZ catalysts under CH4/O2 gas mixtures
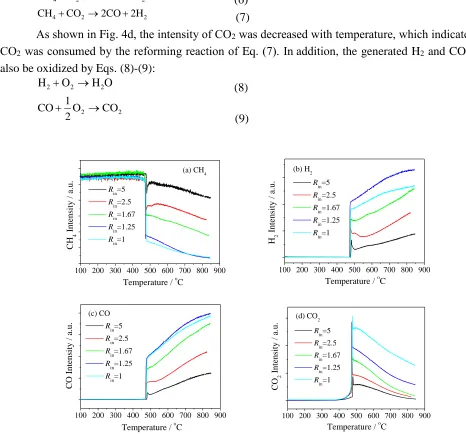
Fig. 4 presents the influence of the CH4/O2 flow rate ratio (1 ≤ Rin ≤ 5) on the catalytic activity
of Ni/YSZ catalysts with various temperatures. The components of the incoming gas mixtures are given in Table 1. The MS signals of the exit gas species (CH4, H2, CO and CO2) during the catalytic testing
were analyzed as a function of Rin. It can be seen that the dissociative methane adsorption occurred at
temperatures above 490 °C. The methane conversion rate was found to be increased with the increasing temperature, while the yields of H2 and CO were increased correspondingly. Although the catalytic
oxidation reactions involve a complex series of reaction mechanisms, some chemical reactions could possibly exist in the partial oxidation of methane (Eqs. (1)-(4)) [22-23]:
2 2
4 O CO 2H
2 1
CH (1)
O H H CO O
CH4 2 2 2 (2)
2 2 2
4 O CO 2H
CH (3) O
2H CO O
2 3
CH4 2 2
O 2H CO 2O
CH4 2 2 2 (5)
Steam reforming (Eq. (6)) and CO2 reforming (Eq. (7)) may generate syngas [23]:
2 2
4 HO CO 3H
CH (6)
2 2
4 CO 2CO 2H
CH (7)
As shown in Fig. 4d, the intensity of CO2 was decreased with temperature, which indicated that
CO2 was consumed by the reforming reaction of Eq. (7). In addition, the generated H2 and CO could
also be oxidized by Eqs. (8)-(9):
O H O
H2 2 2 (8)
2 2 CO
O 2 1
CO
[image:7.596.50.516.118.552.2](9)
Figure 4. Catalytic activity of Ni/YSZ catalysts in CH4/O2 mixtures with varying temperatures: (a) CH4,
(b) H2, (c) CO and (d) CO2
The conversion of methane was increased gradually with the increasing oxygen content. The yields of H2 and CO were also increased with the increasing oxygen content. However, the intensities of
H2 and CO at Rin = 1 were less than those at Rin = 1.25, while the amount of CO2 generated at Rin = 1 was
obviously higher than that at Rin = 1.25. These results indicated that the reaction rate of complete
oxidation (Eq. (5)) was higher than that of partial oxidation at Rin = 1. The complete oxidation reaction
of methane (Eq. (5)) was the dominant reaction at Rin = 1, and the reaction at Rin ≥ 1.25 was dominated
by the partial oxidation of methane. The TPO profiles of the Ni/YSZ catalysts after being in various methane/oxygen mixtures are shown in Fig. 5. The amount of CO2 detected by TPO was found to
100 200 300 400 500 600 700 800 900
CH 4 Inte nsity / a. u.
Temperature / oC Rin=5
Rin=2.5 Rin=1.67 Rin=1.25 Rin=1
(a) CH
4
100 200 300 400 500 600 700 800 900 H2 Inte nsity / a. u.
Temperature / oC Rin=5
Rin=2.5 Rin=1.67 Rin=1.25 Rin=1 (b) H2
100 200 300 400 500 600 700 800 900
CO
Inte
nsity
/
a.
u. Rin=5 Rin=2.5
Rin=1.67 Rin=1.25 Rin=1
Temperature / oC (c) CO
100 200 300 400 500 600 700 800 900
CO 2 Inte nsity / a. u.
decrease with the increasing oxygen content in the gas mixture, which indicated that the deposited carbon decreased gradually. When the flow rates of O2 in the mixture were 10 and 15 sccm (Rin = 2.5 and 1.67),
the temperature range of the TPO was between 430 to 670 °C and the peak value appeared at 560 °C. When the O2 flow rates were increased to 20 and 25 sccm (Rin = 1.25 and 1), the peak value was reduced
[image:8.596.173.414.212.402.2]to 530 °C. With the increasing oxygen content, the temperature to eliminate the deposited carbon decreased, which indicated that the elimination of the deposits became easier. The effect of oxygen on the reforming reactions of methane is favorable to inhibit the carbon deposition on the Ni/YSZ anode.
Figure 5. TPO profiles of Ni/YSZ catalysts after being in various methane/oxygen mixtures
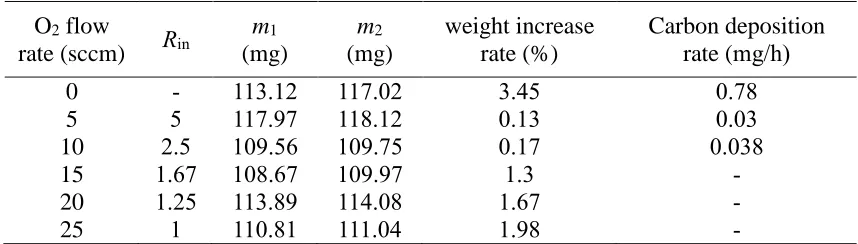
Table 3. Carbon deposition of the anode under various CH4/O2 ratios at 700 °C for 5 h
O2 flow
rate (sccm) Rin
m1
(mg)
m2
(mg)
weight increase rate (%)
Carbon deposition rate (mg/h)
0 - 113.12 117.02 3.45 0.78
5 5 117.97 118.12 0.13 0.03
10 2.5 109.56 109.75 0.17 0.038
15 1.67 108.67 109.97 1.3 -
20 1.25 113.89 114.08 1.67 -
25 1 110.81 111.04 1.98 -
The catalytic activity of Ni/YSZ catalysts was tested under various CH4/O2 ratios at 700 °C for
5 h. The weights of the catalysts before and after catalytic activity tests were measured for carbon deposition. As shown in Table 3, m1 and m2 represent the quality of the catalysts before and after the
catalytic activity tests, respectively. It was found that the catalyst that was exposed to the methane atmosphere without oxygen for 5 h (CH4 25 sccm-Ar 75 sccm) had the highest weight increase rate of
3.45%, and the carbon deposition rate was 0.78 mg/h. When methane was mixed with 5 sccm and 10 sccm oxygen, the weight increase rate decreased to 0.13% and 0.17%, respectively. With the oxygen flow rate continued to increase, the weight increase rate of the catalysts increased gradually. The greater
100 200 300 400 500 600 700 800 900
CO
2
In
te
n
sit
y
(a.
u
.)
Temperature (oC)
Rin=5 Rin=2.5 R
in=1.67 Rin=1.25 R
[image:8.596.83.512.488.610.2]
the oxygen content, the higher the weight increase rate.
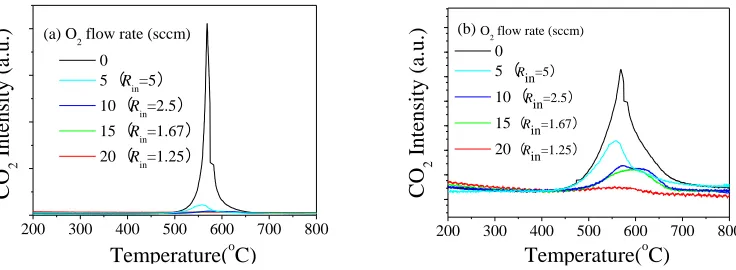
The TPO profiles of the deposited carbon after reforming reactions at 700 °C are shown in Fig. 6a. When the Ni/YSZ catalyst was exposed to a methane atmosphere without oxygen, the temperature range was between 450 to 700 °C and the peak value appeared at 567 °C. When methane was loaded with 5 sccm oxygen, the carbon dioxide peak was significantly decreased.
Figure 6. TPO profiles of Ni/YSZ after being exposed to various CH4/O2 gas mixtures at 700 °C for 5h:
(a) initial data and (b) using the Log function on the ordinate axis
This result indicated that the addition of O2 inhibited the carbon deposits in the anode. As the
amount of oxygen content continued to increase, CO2 was hardly detected in the TPO profiles. Therefore,
the vertical axis was processed using the logarithm, as shown in Fig. 6b. The amounts of deposited carbon at Rin = 2.5 and Rin = 1.67 were basically the same. A weak peak of CO2 was observed at Rin =
1.25, indicating that the carbon accumulation was extremely small. It can be explained from the TPO results that the increased weight of the catalyst at Rin ≤ 1.67 given in Table 3 was not due to carbon
deposition, but rather due to the oxidation of the metal Ni at the anode (Eq. (10)) with excessive oxygen content [24-25]:
2NiO O
2Ni 2 (10)
The CH4/O2 mixture is an important determinant of the coexistence of two phases of Ni and NiO
[24]. The ratio of CH4/O2 controls the content of Ni and NiO in the anode. Excessive amounts of O2 lead
to the formation of NiO, thus resulting in the loss of catalytic activity of the anode. Furthermore, the excessive O2 content also increases the direct oxidation of the fuel, thereby resulting in an increase in
the production of CO2 and a reduction in the fuel utilization. The results given by table 3 and the TPO
tests indicated that Ni oxidation occurred at Rin ≤ 1.67. Meanwhile, Rin = 2.5 was an equilibrium since
both carbon deposition and Ni oxidation were not obvious, which was an optimal gas proportion.
3.3 Electrochemical performance of single cells
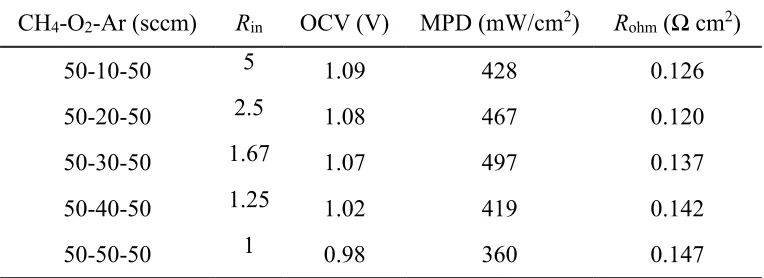
flow rates were fixed at 50 sccm. The open-circuit voltage (OCV) reached 1.09 V at the oxygen flow rate of 10 sccm. When the oxygen flow rate increased from 30 sccm to 40 sccm, the OCV decreased significantly from 1.07 V to 1.02 V, as shown in Table 4. A decrease of the OCV occurred with the
200 300 400 500 600 700 800
Temperature(oC)
CO
2
Int
ensit
y (a
.u.
)
0 5(Rin=5) 10(Rin=2.5) 15(Rin=1.67) 20(Rin=1.25) O2 flow rate (sccm) (a)
200 300 400 500 600 700 800
Temperature(oC)
CO
2
Int
ensit
y (a
.u.
)
0 5(Rin=5)
10(Rin=2.5)
15(Rin=1.67)
20(Rin=1.25) O2 flow rate (sccm)
[image:9.596.112.480.187.322.2]
increasing oxygen content. The increase of the partial oxygen pressure on the anode led to the decrease of the local oxygen concentration gradient between the cathode and anode, and resulted in a decrease of the OCV. When the flow rate of oxygen reached 50 sccm, the OCV was reduced to below 1 V. The maximum power densities (MPDs) were 428, 467 and 497 mW/cm2 at Rin = 5, 2.5 and 1.67, respectively.
However, the concentration polarization phenomenon appeared under high current of the discharge curve at Rin = 1.67. According to the analysis in section 3.2, the reaction at Rin = 1.67 was dominated by
the partial oxidation of methane. It seemed that electrochemical complete oxidation of methane (Eq. (11)) existed under high current, which caused the concentration polarization phenomenon due to the formation of H2O and CO2.
4O CO 2H O 8e
CH4 2 2 2 (11)
[image:10.596.96.485.230.461.2](c)
Figure 7. (a) Output performance of the cell under CH4/O2 gas mixtures, (b) Impedance spectra of the
single cells under open-circuit conditions, and (c) The equivalent circuit of the impedance spectra
By continuing to increase the oxygen content to 40 and 50 sccm (Rin = 1.25 and 1), the
concentration polarization phenomenon under high currents become more obvious. This is because with the increased oxygen concentration, more non-electrochemical active products (CO2 and H2O) are
generated from the complete oxidation reaction, which are deleterious to the electrochemical oxidations of H2 and CO. The concentration overpotential under high current seriously limits the output
performance of the cell. In addition, with the oxygen surface concentration increased, the NiO formed by the reaction of oxygen atoms with Ni metal resulted in an interruption of the anode current pathway and a lower cell performance. The maximum power densities were significantly reduced to 419 and 360 mW/cm2 at Rin = 1.25 and 1, respectively. The I-V and I-P curves confirmed that Rin = 2.5 was appropriate
for the cell performance.
The AC impedance spectra of the cells measured under the open circuit voltage condition are shown in Fig. 7b. These spectra were fitted using an equivalent circuit in Fig. 7c with two semicircles, LRohm(R1CPE1)(R2CPE2). In this circuit, L is the inductance, which is mainly attributed to silver
voltage-current probes; Rohm is the ohmic resistance, including the electrolyte resistance, contact resistances, and
0.0 0.4 0.8 1.2 1.6 0.0 0.2 0.4 0.6 0.8 1.0 1.2 0.0 0.1 0.2 0.3 0.4 0.5 0.6 0.7 50-10-50 50-20-50 50-30-50 50-40-50 50-50-50
(a) CH4-O2-Ar(sccm)
Vol ta g e (V ) Power d en sit y (W cm -2 )
Current density (A cm-2)
0.0 0.5 1.0 1.5 2.0 -0.5
0.0 0.5 1.0
1.5 50-10-50 50-20-50 50-30-50 50-40-50 50-50-50 -Z'' ( c m 2 )
electrode ohmic resistance; and (R1CPE1) and (R2CPE2) correspond to the high- and low-frequency arcs,
respectively. The high frequency resistance R1 is attributed to the charge-transfer polarization, while the
low frequency resistance R2 is mainly due to the gas dissociative adsorption and/or surface diffusion
resistance [26]. The ohmic resistance is determined by the actual temperature of the cell [27]. From the fitting results of the impedance spectra in Table 4, the cell tested at Rin = 2.5 had the lowest ohmic
resistance of 0.120 Ω·cm2, which presented direct evidence of a higher temperature. When continuing
to increase the oxygen content, the ohmic resistance increased obviously. The temperature dropped due to the inferior catalytic effectiveness of NiO for exothermic reactions. It can be seen from the impedance spectra that the low frequency semicircle of the gas diffusion impedance increased with the increasing oxygen content, which was related to the H2O and CO2 in the reaction products that were unfavorable to
[image:11.596.108.490.314.453.2]the electrochemical reaction of the anode.
Table 4. Output performance of the cells under various CH4/O2 gas mixtures
CH4-O2-Ar (sccm) Rin OCV (V) MPD (mW/cm2) Rohm (Ω cm2)
50-10-50 5 1.09 428 0.126
50-20-50 2.5 1.08 467 0.120
50-30-50 1.67 1.07 497 0.137
50-40-50 1.25 1.02 419 0.142
50-50-50 1 0.98 360 0.147
The major issue for the active electrodes is their stability during long-term operation at the working temperature. The cell voltage at Rin = 2.5 was stable at 0.9 V with a current density of 100
mA/cm2, as shown in Fig. 8. Oscillation was not observed during the test. Zhang et al. [28-29] reported that the oscillatory behaviors during the partial oxidation of methane could be affected by the feed gas composition. Napporn and co-workers [30] showed a performance degradation with OCV oscillation due to the redox reaction of Ni in oxygen-rich gas mixtures. Kellogg et al. [31] also believed that the oscillatory behavior was caused by the redox reaction that occurred on the Ni-anode. According to our measurements under the different operating conditions and all the property characterizations, Rin = 2.5
was determined to provide the outcomes of interest for SOFC operation optimization. A basic equilibrium of Ni oxidation and NiO reduction occurred at Rin = 2.5. Ni did not lose its catalytic activity
and the partial oxidation of methane continued to provide H2 and CO for the anode, which made the cell
Figure 8. Voltage-time curve at a current density of 100 mA/cm2 at 700 °C
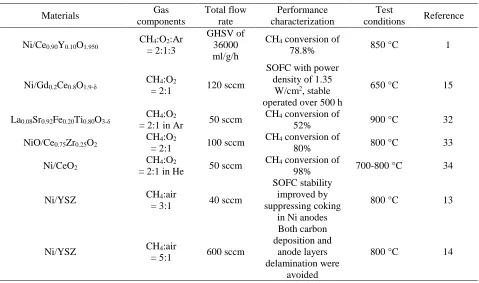
Table 5. Materials and gas components for methane oxidation reported in the literature
Materials Gas
components
Total flow rate
Performance characterization
Test
conditions Reference
Ni/Ce0.90Y0.10O1.950
CH4:O2:Ar
= 2:1:3
GHSV of 36000 ml/g/h
CH4 conversion of
78.8% 850 °C 1
Ni/Gd0.2Ce0.8O1.9-δ CH4:O2
= 2:1 120 sccm
SOFC with power density of 1.35
W/cm2, stable
operated over 500 h
650 °C 15
La0.08Sr0.92Fe0.20Ti0.80O3-δ CH4:O2
= 2:1 in Ar 50 sccm
CH4 conversion of
52% 900 °C 32
NiO/Ce0.75Zr0.25O2
CH4:O2
= 2:1 100 sccm
CH4 conversion of
80% 800 °C 33
Ni/CeO2 CH4:O2
= 2:1 in He 50 sccm
CH4 conversion of
98% 700-800 °C 34
Ni/YSZ CH4:air
= 3:1 40 sccm
SOFC stability improved by suppressing coking
in Ni anodes
800 °C 13
Ni/YSZ CH4:air
= 5:1 600 sccm
Both carbon deposition and
anode layers delamination were
avoided
800 °C 14
Until recently, most of the studies of the catalytic oxidation of methane in SOFCs were focused on the methane-to-oxygen ratio of 2, which is the stoichiometric value for the partial oxidation of methane. Table 5 lists the anode materials and gas components reported in the literature. Few papers considered the effect of adding air to methane on the methane oxidation behavior. According to Aslannejad et al. [14], the anodic feeding compositions of the methane (500 sccm) dilution with air flow
0 1 2 3 4 5 6 7 8 9 10 11
0.0 0.2 0.4 0.6 0.8 1.0
Time / h
Volta
ge
/
V
100 mA/cm [image:12.596.62.541.374.657.2]
rates of 50-800 sccm were explored for Ni/YSZ anode supported cells at 800 °C. Experimental results showed that 1:5 air to methane addition was the optimal gas composition. Both carbon deposition and anode delamination were avoided. A stable cell operation at 0.6 V was guaranteed. Gong et al. [35] demonstrated a SOFC module coupled with a catalytic partial oxidation reformer with Rh supported by Al2O3 as the catalyst. Methane and air gas mixtures of 40 sccm were applied to evaluate the performance
of the reformer with various C/O ratios. The optimal C/O ratio of 0.8 was obtained at 800 °C with a maximum reforming efficiency of 86.1%. Based on our findings, the methane addition with oxygen carriers with a ratio of 2.5 was found to be a good solution to restrain carbon deposition and Ni oxidation for the Ni/YSZ anodes.
4. CONCLUSION
This paper studied the catalytic activity of methane oxidation over Ni/YSZ anodes fueled under various methane-oxygen mixtures. The following conclusions can be drawn. The catalytic activity tests of Ni/YSZ catalyst indicated that the complete oxidation reaction of methane was the dominant reaction at Rin = 1, and the reaction at Rin ≥ 1.25 was dominated by the partial methane oxidation. Catalytic reforming
reactions of methane at 700 °C showed that Ni oxidation occurred at Rin ≤ 1.67. Through experimental
activity under different operating conditions and suitable performance characterizations, Rin = 2.5 was
determined to exhibit the best activity among the Ni/YSZ electrodes.
ACKNOWLEDGEMENT
This work was supported by the National Natural Science Foundation of China (Nos. 51602213, 11604236 and 61575139) and the Youth Foundation of the Taiyuan University of Technology (No. 2015QN071).
References
1. S.H. Zeng, L. Wang, M.C. Gong and Y.Q. Chen, J. Nat. Gas Chem., 19 (2010) 509.
2. J.W. Yun, S.P. Yoon, H.S. Kim, J. Han and S.W. Nam, Int. J. Hydrogen Energy, 37 (2012) 4356. 3. J.H. Koh, Y.S. Yoo, J.W. Park and H.C. Lim, Solid State Ionics, 149 (2002) 157.
4. K. Kendall, C.M. Finnerty, G. Saunders and J.T. Chung, J. Power Sources, 106 (2002) 323. 5. W. Wang, C. Su, Y. Wu, R. Ran and Z. Shao, Chem. Rev., 113 (2013) 8104.
6. A. Gunji, C. Wen, J. Otomo, T. Kobayashi, K. Ukai and Y. Mizutani, J. Power Sources, 131 (2004) 285.
7. R.J. Gorte and J.M. Vohs, J. Catal., 216 (2003) 477. 8. S. Mclntosh and R.J. Gorte, Chem. Rev., 104 (2004) 4845.
9. B.S. Barros, D.M.A. Melo, S. Libs and A. Kiennemann, Appl. Catal. A-Gen., 378 (2010) 69. 10.M.R. Cesário, B.S. Barros, C. Courson, D.M.A. Melo and A. Kiennemann, Fuel Process Technol.,
131 (2015), 247.
11.Y. Wang, X. Hong, B. Li, W. Wang and D. Wang, J. Nat. Gas Chem., 17 (2008) 344.
12.G.J. Offer, J. Mermelstein, E. Brightman and N.P. Brandonz, J. Am. Ceram. Soc., 92 (2009) 763. 13.M. Pillai, Y. Lin, H. Zhu, R.J. Kee and S.A. Barnett, J. Power Sources, 195 (2010) 271.
15.D. Lee, J. Myung, J. Tan, S-H. Hyun, J. TS. Irvine, J. Kim and J. Moon, J. Power Sources, 345 (2017) 30.
16.X. Jacques-Bedard, T.W. Napporn, R. Roberge and M. Meunier, J. Electrochem. Soc., 154 (2007) B305.
17.Z. Wang, Z. Lü, B. Wei, K. Chen, X. Huang, W. Pan and W. Su, Electrochim. Acta, 56 (2011) 6688.
18.K.F. Chen, Z. Lu, N. Ai, X.Q. Huang, Y.H. Zhang, X.S. Xin, R.B. Zhu and W.H. Su, J. Power Sources, 160 (2006) 436.
19.B. Wei, Z. Lu, X.Q. Huang, M.L. Liu, K.F. Chen and W.H. Su, J. Power Sources, 167 (2007) 58. 20.J. Macek, B. Novosel and M. Marinsek, J. Eur. Ceram. Soc., 27 (2007) 487.
21.C.M. Finnerty, N.J. Coe, R.H. Cunningham and R.M. Ormerod, Catal. Today, 46 (1998) 137. 22.I. Riess, J. Power Sources, 175 (2008) 325.
23.M. Kuhn and T.W. Napporn, Energies, 3 (2010) 57.
24.S. Savoie, T.W. Napporn, B. Morel, M. Meunier and R. Roberge, J. Power Sources, 196 (2011) 3713.
25.V.Y. Bychkov, V.P. Tyulenin, V.N. Korchak and E.L. Aptekar, Appl. Catal. A-Gen., 304 (2006) 21.
26.T. Suzuki, P. Jasinski, V. Petrovsky, H.U. Anderson and F. Dogan, J. Electrochem. Soc., 151 (2004) A1473.
27.B. Morel, R. Roberge, S. Savoie, T. Napporn and M. Meunier, Appl. Catal. A-Gen., 323 (2007) 181.
28.X.L. Zhang, D.O. Hayward and D.M.P. Mingos, Catal. Lett., 86 (2003) 235.
29.X.L. Zhang, C.S.M. Lee, D.O. Hayward and D.M.P. Mingos, Catal. Today, 105 (2005) 283. 30.X. Jacques-Bedard, T.W. Napporn, R. Roberge and M. Meunier, J. Power Sources, 153 (2006)
108.
31.I.D. Kellogg, U.O. Koylu, V. Petrovsky and F. Dogan, Int. J. Hydrogen Energy, 34 (2009) 5138. 32.J.S. Yoon, E.J. Yi, B.H. Choi, M-J. Ji and H. J. Hwang, Ceram. Int., 40 (2014) 1525.
33.V.R. da Silveira, D.M.A. Melo, B.S. Barros, J.A.C. Ruiz and L.O.A. Rojas, Ceram. Int., 42 (2016) 16084.
34.G. Pantaleo, V. La Parola, F. Deganello, R.K. Singha, R. Bal and A.M. Venezia, Appl. Catal. B-Environ., 189 (2016) 233.