Int. J. Electrochem. Sci., 14 (2019) 2372 – 2382, doi: 10.20964/2019.03.20
International Journal of
ELECTROCHEMICAL
SCIENCE
www.electrochemsci.org
Effect of Drying Time on Electrochemical Properties of
Li
1.2Mn
0.54Ni
0.13Co
0.13O
2Cathode Material
Changkun Song2, Wangjun Feng 1,2,*, Wenxiao Su2, Linjing Chen2, Miaomiao Li2,
1 State Key Laboratory of Advanced Processing and Recycling Nonferrous Metals, Lanzhou University
of Technology, Lanzhou 730050, China;
2 School of Science, Lanzhou University of Technology, Lanzhou 730050, China *E-mail: [email protected]
Received: 7 October 2018 / Accepted: 29 November 2018 / Published: 7 February 2019
Li-rich layered cathode materials were synthesized by the sol-gel method with acetate and citric acid. The effect of drying time on the structure, morphology and electrochemical properties of the prepared material were carefully studied with X-ray diffraction (XRD), scanning electron microscopy (SEM), cyclic voltammetry (CV), electrochemical impedance spectroscopy (EIS) and electrochemical characterization. The results show that the Li1.2Mn0.54Ni0.13Co0.13O2 sample had a uniform particle size
distribution and outstanding electrochemical performance at 24 h drying time. It delivered the largest initial discharge capacity of 262.5 mAh/g and coulombic efficiency of 77.66% at 0.1 C. Furthermore, it showed a high discharge capacity of 200.1 mAh/g and 158.9 mAh/g at 0.5 C and 2 C and a capacity retention of 80.46% and 84.14% after 100 cycles, respectively.
Keywords: Li-rich; Lithium-ion batteries; drying time; capacity retention
1. INTRODUCTION
In recent years, with the continuous development of electrochemical energy storage technology, rechargeable batteries have received worldwide attention. Lithium-ion batteries are widely used in portable storage devices due to their high energy density and environmental friendliness [1-4]. However, conventional cathode materials, such as layered LiCoO2, Li[Mn1/3Ni1/3Co1/3]O2, spinel type
LiMn2O4 and olivine type LiFePO4, are unable to meet the requirements of higher capacity and higher
energy density required for practical applications [5,6]. Hence, it is a major challenge to explore the new generation of high-capacity cathode materials [7].
specific capacity reaches 230-285 mAh/g, which has been widely studied for practical applications [8,9]. Among these materials, Li1.2Mn0.54Ni0.13Co0.13O2 has a theoretical specific capacity of 377
mAh/g. It has high initial coulombic efficiency and excellent rate performance [10]. According to the study, Li1.2Mn0.54Ni0.13Co0.13O2 can also rewritten 0.5Li2MnO3·0.5LiNi1/3Co1/3Mn1/3O with
two-component notation, which can provide an initial discharge capacity of up to 250 mAh/g between 2.0 and 4.8 V at room temperature [11].
Generally, the electrochemical properties of prepared electrode materials are affected by purity, phase crystallinity, particle size and distribution. These influencing factors are mainly determined by the preparation methods [12]. At present, researchers mainly use the sol-gel method [4], solid phase method [13,14], coprecipitation method [15], hydrothermal method [16] and other synthetic methods to prepare lithium-rich layered materials. The sol-gel method is highly preferred for the synthesis of LLMO by combining with transition metal ions at sub-atomic levels of the starting sol to synthesize uniform, stoichiometric nanoparticles [8].
In this work, we first studied the morphology and electrochemical properties of Li1.2Mn0.54Ni0.13Co0.13O2 by varying the drying time of the gel, namely at 12 h, 24 h and 36 h. The
results show that the morphology of the material is optimal and has the best performance when the drying time is 24 h. The initial discharge specific capacity at the optimal condition is as high as 262.5 mAh/g, which is much higher than the other two drying times, whose first discharge specific capacity at 0.5 C and 2 C reaches 200.1 mAh/g and 158.9 mAh/g, respectively. The capacity at 0.5 C and 2 C remains at 161.0 mAh/g and 133.7 mAh/g after 100 cycles, respectively.
2. EXPERIMENTAL PROCEDURE
2.1. Material preparation
In this experiment, the Mn(CH3COO)2·4H2O, Ni(CH3COO)2·4H20, and Co(CH3COO)2·4H2O
molar ratios of 54:13:13 were first dissolved in a certain amount of deionized water and recorded as a TM solution. CH3COOLi·2H2O and C6H8O7·H2O were then dissolved in deionized water at a molar
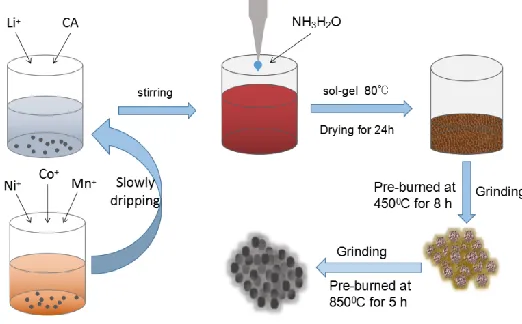
Figure 1. Schematic diagram of the formation process of materials.
2.2 Material characterization
X-ray diffraction (XRD) measurements were performed using a Bruker D8 Advance diffractometer with Cu Kα radiation. The range of diffraction data collection was 10°<2θ<80°. The morphological characteristics of the samples were observed using a JSM-6700F scanning electron microscope (SEM), and the accelerating voltage was 20 KV. The TEM (JEM-2100F) images of the samples were collected at 200 KV.
2.3 Preparation of cathode and electrochemical analysis
The positive electrode of the battery consists of 80% Li1.2Mn0.54Ni0.13Co0.13O2 composites, 10%
acetylene black as the conductive material and 10% polyvinylidene fluoride (PVDF) as the binder by adding a certain amount of 1-methyl-2-pyrrolidone (NMP) as the solvent. The slurry was then uniformly applied to an aluminium foil and placed in a dry box. The battery assembly consisted of a positive electrode material and a lithium metal negative electrode separated by a Celgard 2400 polyethylene/polypropylene membrane. The electrolyte was made of 1 mol/L LiPF6 dissolved in
EC/DMC/DEC (1:1:1 by volume). The battery was assembled in a sealed argon-filled glove box. The charge and discharge test of the battery was carried out using the LAND-CT2001A Battery Test System (Wuhan, China) between 2.0 V and 4.8 V at room temperature. Electrochemical impedance spectroscopy (EIS) and cyclic voltammetry (CV) studies were performed at electrochemical workstations. The EIS was recorded in the frequency range of 10-2 Hz to 105 Hz when the potential
difference signal amplitude was 5 mV. The CV test voltage range was 2.0-4.8 V, and the scan rate was 0.1 mV/s.
3. RESULTS AND DISCUSSION
3.1. Crystalline structure analysis
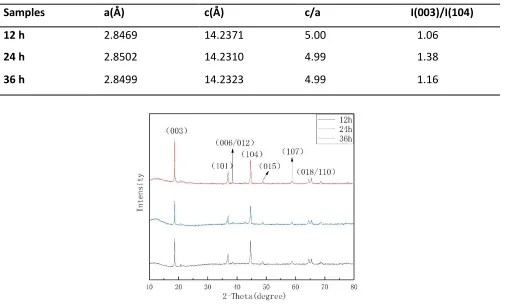
spectra of the Li1.2Mn0.54Ni0.13Co0.13O2 material at different drying times. The spectra do not contain
any impurity phases, and the diffraction peaks are sharp and strong, indicating a high crystallinity and pure phase content. The apparent splitting of the (006)/(102) and (108)/(110) peaks in the XRD spectrum indicates that the material had a well-organized layered structure [17,18]. The peak splitting of the dried 24 h sample in Fig. 2 is most pronounced, so the corresponding material had the best layered structure.
[image:4.596.52.557.356.662.2]The lattice parameters a and c are related to the average metal-metal intra-slab and inter-slab distance, respectively. A crystalline layer structure formed when the c/a values of all samples were larger than 4.899. [6] The ratio of I(003)/I(104) in the XRD pattern is an important factor in the degree of cation mixing in the material; when I(003)/I(104)<1.2, the degree of cation mixing in the material is high. If the ratio of I(003)/I(104) is larger, the degree of cation mixing is low [19-21]. By calculating the I(003)/I(104) values at different drying times (Table 1), we found that I(003)/I(104)>1.2, and the I(003)/I(104) value is the largest when the drying time was 24 h. Therefore, when the drying time is 24 h, the cation mixing degree is the lowest and the electrochemical performance is optimal.
Table 1. Lattice parameters of the different drying time samples.
Samples a(Å) c(Å) c/a I(003)/I(104)
12 h 2.8469 14.2371 5.00 1.06
24 h 2.8502 14.2310 4.99 1.38
[image:4.596.171.425.364.657.2]36 h 2.8499 14.2323 4.99 1.16
Figure 2. XRD patterns of various Li1.2Mn0.54Ni0.13Co0.13O2 at different drying times.
3.2 Morphological observation
electrochemical performance. Fig. 3 (a) and (b) shows SEM images of the Li1.2Mn0.54Ni0.13Co0.13O2
material at a drying time of 24 h. The samples were all ellipsoidal, and the particle size was approximately uniform. The smaller the particle size of the material, the shorter the diffusion path of the lithium ions inside the material, which is beneficial for improving the shuttle of lithium ions in the material [17,22,23].
Figure 3. (a) and (b) SEM images of Li1.2Mn0.54Ni0.13Co0.13O2; (c) and (d) TEM images of
[image:5.596.164.432.170.369.2]Li1.2Mn0.54Ni0.13Co0.13O2.
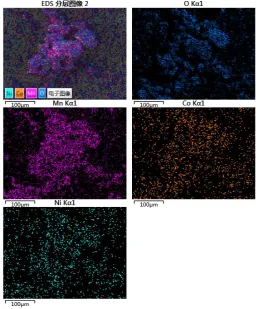
Figure 4. EDS mapping of Ni, Co and Mn based on the Li1.2Mn0.54Ni0.13Co0.13O2 material at a drying
[image:5.596.169.426.413.722.2]The sample consisted of uniform particles with a size in the range of 100-300 nm. It had better electrochemical performance. Fig. 3 (c) and (d) shows TEM images of the Li1.2Mn0.54Ni0.13Co0.13O2
material at a drying time of 24 h. Single-phase, well-surfaced octahedral crystallites are observed with sizes ranging from 100 nm to 400 nm. Fig. 4 is a schematic diagram of EDS mapping of Li1.2Mn0.54Ni0.13Co0.13O2 particles based on the inset of Fig. 3. As shown in Fig. 4, the chemical was
directly related to the strength of the element. Ni, Co and Ma were evenly and consistently distributed . The EDS element mapping image clearly shows that Ni, Co and Mn elements were uniformly distributed in the Li1.2Mn0.54Ni0.13Co0.13O2 sample [8,24].
3.3 Electrochemical performance
Fig. 5 is the first charge and discharge curve of each sample at 0.1 C rate. The first charging process for the lithium-rich manganese-based solid solution materials can be divided into two steps: an S-shaped curve below 4.5 V and an L-shaped platform above 4.5 Below 4.5 V, lithium ions were removed from the LiMO2 component of the material, and above 4.5 V, Li2O was removed from the
Li2MnO3 component [6,25]. Due to the appearance of the 4.5 V platform, a capacity that exceeds the
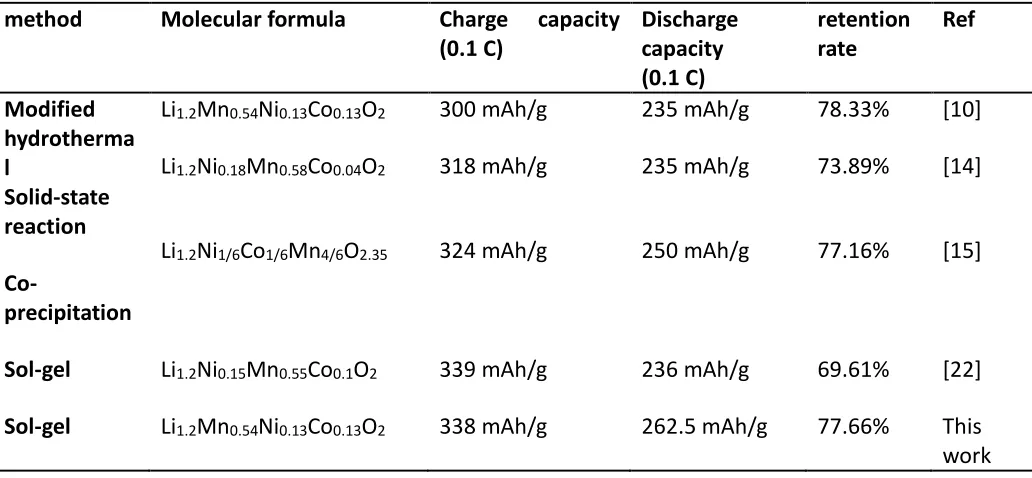
[image:6.596.48.564.516.755.2]redox calculation of the transition metal element in the layered material was produced. A specific capacity of more than 200 mAh/g was maintained in the next charge and discharge (2 to 4.8 V). As shown in Fig. 5, the three different drying times correspond to different first charge and discharge capacities. Among them, the charge-discharge specific capacity of drying for 24 hours was the highest, reaching 338.0 and 262.5 mAh/g, and the capacity retention rate was 77.66%. Compared with the positive electrode materials prepared by other methods, the positive electrode material obtained by this method had more attractive properties. (Table 2)
Table 2. Performance comparison of materials obtained by various methods
method Molecular formula Charge capacity
(0.1 C) Discharge capacity (0.1 C) retention rate Ref Modified hydrotherma l
Solid-state reaction Co -precipitation Li1.2Mn0.54Ni0.13Co0.13O2 Li1.2Ni0.18Mn0.58Co0.04O2 Li1.2Ni1/6Co1/6Mn4/6O2.35 300 mAh/g 318 mAh/g 324 mAh/g 235 mAh/g 235 mAh/g 250 mAh/g 78.33% 73.89% 77.16% [10] [14] [15]
Sol-gel Li1.2Ni0.15Mn0.55Co0.1O2 339 mAh/g 236 mAh/g 69.61% [22]
Sol-gel Li1.2Mn0.54Ni0.13Co0.13O2 338 mAh/g 262.5 mAh/g 77.66% This
Figure 5. The first charge and discharge curve of the sample.
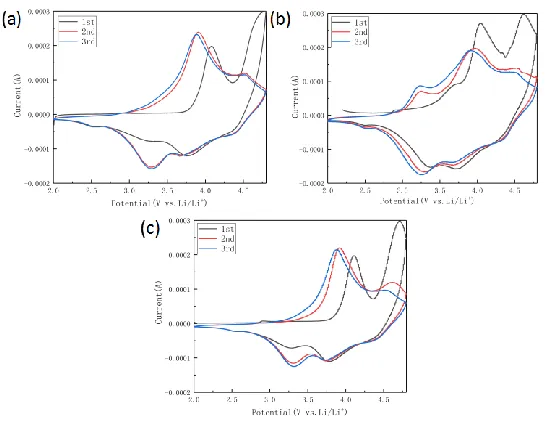
To compare the electrochemical redox reactions of the three samples, cyclic voltammetry (CV) measurements were performed. As shown in Fig. 6, two distinct platforms emerged during the first charging process, corresponding to the platforms of the two charging curves in Fig. 5. Two peaks of 3.9 V and 4.6 V appeared on the first CV scan curve, which may be due to the oxidation of Ni2+ and
Co3+ and the removal of Li+ ions in the structure, accompanied by the release of oxygen. Two distinct
reduction peaks of approximately 3.7 V and 3.3 V can be clearly observed in the reverse scan, which can be attributed to the reduction of Ni3+ and Mn4+ [7,26].
Figure 6. Cyclic voltammetry (CV) curves at different drying times. (a) 12 h, (b) 24 h, and (c) 36 h.
The oxidation peak of 4.5 V is obvious and sharp, and the main reason for this is that Li+
continuously escaped with the release of oxygen and finally came out of the Li2MnO3 component of
[image:7.596.163.437.452.665.2]reaction is irreversible [27]. The samples dried in the first cycle for 24 h had partial changes with drying for 12 h and 36 h. First, there is a significant difference in the relative proportions of these two oxidation peaks at 3.9 V and 4.6 V. The ratio of the oxidation peak current I(4.6V)/I(3.9V) is defined as R,
and the lower I(4.6V)/I(3.9V) value represents a stable structure. It is clear that the sample dried for 24 h
[image:8.596.189.407.311.493.2]had the most stable structure [28].
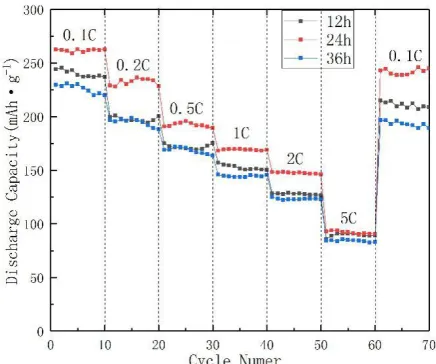
Figure 7 is a graph showing the rate performance of Li1.2Mn0.54Ni0.13Co0.13O2 after drying for
[image:8.596.108.475.507.644.2]12 h, 24 h and 36 h. The electrochemical test voltage was adjusted from 2.0 V to 4.8 V at different current densities of 0.1 C, 0.2 C, 0.5 C, 1 C, 2 C, 5 C and back to 0.1 C (1 C=200 mAh/g). A charge and discharge test was performed. As seen from the figure, the sample with a drying time of 24 h had a better rate performance. It can be seen from the figure that the discharge capacity of all the samples decreased as the charge and discharge current increased. At the same charge and discharge current, especially at high currents (1.0 C and 2.0 C), the sample having a drying time of 24 hours had a higher discharge specific capacity.
Figure 7. The rate capability of samples synthesized with different drying times.
Figure 8. Cycle performance of the different drying times materials. (a) 0.5 C and (b) 2 C.
Fig. 8 is a graph comparing the discharge specific capacity of a synthetic material at a voltage range of 2-4.8 V and a current density of 0.5 C and 2 C for 100 cycles at different drying times. The discharge specific capacity of the sample gradually increased during the first three cycles due to the extension of the 3.5 V high voltage, indicating that it took several cycles to fully activate the Li2MnO3
and the discharge specific capacity was the highest after drying for 24 hours after 100 weeks of cycling, reaching 161.0 mAh/g and 133.7 mAh/g at 0.5 C and 2 C, respectively. For the first discharge capacity, the capacity retention rates were 80.46% and 84.14% at 0.5 C and 2 C, respectively.
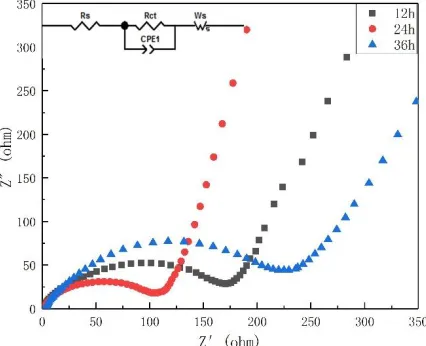
To better observe the effect of drying time on the electrochemical performance of the material, all samples were tested for AC impedance in the uncharged cycle, as shown in Fig. 9. The impedance spectra of all samples consisted of a semicircle in the mid-high frequency region and a diagonal line in the low-frequency region. The semicircle corresponds to the charge transfer resistance (Rct) between the material and the electrolyte interface, while the oblique line is related to the Warburg impedance (Ws), which is related to the transfer of Li+ in the active material [15,30]. The sample dried for 24 h
[image:9.596.192.405.280.453.2]had the lowest charge transfer impedance, which indicates that lithium ions can be quickly deintercalated through the material interface, consistent with the results in the rate performance test.
Figure 9. AC impedance of samples synthesized with different drying times.
4. CONCLUSIONS
In this work, a material was prepared by a sol-gel method by controlling different drying times. XRD showed that the drying time had a significant effect on the layered structure of the material and the degree of cation mixing. By testing CV, it was found that the material structure for drying for 24 hours was the most stable. The results of the electrochemical tests show that the Li1.2Mn0.54Ni0.13Co0.13O2 material had the best electrochemical performance when the drying time was
24 h. The first discharge specific capacity at 0.1 C is as high as 262.5 mAh/g, and its first efficiency was 77.66%. The discharge-specific capacity was maintained at 161.0 mAh/g and 133.7 mAh/g after cycling for 100 cycles at high current (0.5 C and 2.0 C). Its capacity retention rate reached 80.46% and 84.14% at 0.5 C and 2.0 C, respectively. We hope that these studies will play an important role in the further development of lithium-rich manganese-based materials.
ACKNOWLEDGEMENTS
No.11264023) and the Natural Science Foundation of Gansu Province, China (Grant No. 1210ZTC035)
References
1. J.-L. Shi, D.-D. Xiao, X.-D. Zhang, Y.-X. Yin, Y.-G. Guo, L. Gu and L.-J. Wan, Nano Res., 10 (2017) 4201.
2. Y. Zhang, Y. Li, X. Niu, D. Wang, D. Zhou, X. Wang, C. Gu and J. Tu, J. Mater. Chem. A, 3 (2015) 14291.
3. W. X. Su, W. J. Feng, Y. Cao, L. J. Cheng, M. M. Li, C. K. Song, J. Electrochem. Sci., 13 (2018) 6005.
4. M. C. Kim, K.-W. Nam, E. Hu, X.-Q. Yang, H. Kim, K. Kang, V. Aravindan, W.-S. Kim and Y.-S. Lee, ChemSusChem, 7 (2014) 829.
5. X. Hou, Y. Huang, S. Ma, X. Zou, S. Hu and Y. Wu, Mater. Res. Bull., 63 (2015) 256.
6. T.-F. Yi, W. Tao, B. Chen, Y.-R. Zhu, S.-Y. Yang and Y. Xie, Electrochimica Acta, 188 (2016) 686. 7. Y. Liu, D. Ning, L. Zheng, Q. Zhang, L. Gu, R. Gao, J. Zhang, A. Franz, G. Schumacher and X. Liu,
J. Power Sources, 375 (2018) 1.
8. L. Li, M. Xu, Z. Chen, X. Zhou, Q. Zhang, H. Zhu, C. Wu and K. Zhang, Electrochimica Acta, , 174 (2015) 446.
9. S. J. Shi, J. P. Tu, Y. Y. Tang, X. Y. Liu, Y. Q. Zhang, X. L. Wang and C. D. Gu, Electrochimica Acta, 88 (2013) 671.
10. L. Zhang, K. Jin, L. Wang, Y. Zhang, X. Li and Y. Song, J. Alloys Compd., 638 (2015) 298.
11. Y. Bai, Y. Li, C. Wu, J. Lu, H. Li, Z. Liu, Y. Zhong, S. Chen, C. Zhang, K. Amine and F. Wu, Energy Technol., 3 (2015) 843.
12. H.-W. Lee, P. Muralidharan, R. Ruffo, C. M. Mari, Y. Cui and D. K. Kim, Nano Lett., 10 (2010) 3852.
13. L. Yu, W. Qiu, F. Lian, J. Huang and X. Kang, J. Alloys Compd., 471(2009) 317. 14. J. Wang, B. Qiu, H. Cao, Y. Xia and Z. Liu, J. Power Sources, 218 (2012) 128.
15. J. Wang, G. Yuan, M. Zhang, B. Qiu, Y. Xia and Z. Liu, Electrochimica Acta, 66 (2012) 61. 16. A. Tiwari, V. Singh and T. C. Nagaiah, J. Mater. Chem. A, 6 (2018) 2681.
17. H. Xu, S. Deng and G. Chen, J Mater Chem A, 2 (2014) 15015.
18. Y. Xiang, Z. Sun, J. Li, X. Wu, Z. Liu, L. Xiong, Z. He, B. Long, C. Yang and Z. Yin, Ceram. Int., 43 (2017) 2320.
19. J. Li, R. Klöpsch, M. C. Stan, S. Nowak, M. Kunze, M. Winter and S. Passerini, J. Power Sources, 196 (2011) 4821.
20. L. F. Jiao, M. Zhang, H. T. Yuan, M. Zhao, J. Guo, W. Wang, X. D. Zhou and Y. M. Wang, J. Power Sources, 167 (2007) 178.
21. K. M. Shaju, G. V. Subba Rao and B. V. R. Chowdari, Electrochimica Acta, 48 (2002) 145. 22. T. Tang and H.-L. Zhang, Electrochimica Acta, 191 (2016) 263.
23. Y. Cao, W. J. Feng, W. X. Su, J. Electrochem. Sci., 13 (2018) 8022.
24. J.-Z. Kong, C.-L. Wang, X. Qian, G.-A. Tai, A.-D. Li, D. Wu, H. Li, F. Zhou, C. Yu, Y. Sun, D. Jia and W.-P. Tang, Electrochimica Acta, 174 (2015) 542.
25. J. Zheng, M. Gu, A. Genc, J. Xiao, P. Xu, X. Chen, Z. Zhu, W. Zhao, L. Pullan, C. Wang and J.-G. Zhang, Nano Lett., 14 (2014) 2628.
26. J.-H. Kim, C. W. Park, Y.-K. Sun, Solid State Ion., 164 (2003) 43.
7 (2015) 13014.
29. X.-Y. Liu, J.-L. Liu, T. Huang, A.-S. Yu, Electrochimica Acta, 109 (2013) 52.
30. H. Liu, C. Chen, C. Du, X. He, G. Yin, B. Song, P. Zuo, X. Cheng, Y. Ma and Y. Gao, J. Mater. Chem. A, 3 (2015) 2634.