This is a repository copy of
Using Knowledge Anchors to Facilitate User Exploration of
Data Graphs
.
White Rose Research Online URL for this paper:
http://eprints.whiterose.ac.uk/141069/
Version: Accepted Version
Article:
Al-Tawil, M, Dimitrova, V orcid.org/0000-0002-7001-0891 and Thakker, D (2019) Using
Knowledge Anchors to Facilitate User Exploration of Data Graphs. Semantic Web Journal
- Interoperability, Usability, Applicability. ISSN 1570-0844
https://doi.org/10.3233/SW-190347
This article is protected by copyright. This is an author produced version of a paper
accepted for publication in Semantic Web Journal - Interoperability, Usability, Applicability.
Uploaded in accordance with the publisher's self-archiving policy.
eprints@whiterose.ac.uk https://eprints.whiterose.ac.uk/ Reuse
Items deposited in White Rose Research Online are protected by copyright, with all rights reserved unless indicated otherwise. They may be downloaded and/or printed for private study, or other acts as permitted by national copyright laws. The publisher or other rights holders may allow further reproduction and re-use of the full text version. This is indicated by the licence information on the White Rose Research Online record for the item.
Takedown
If you consider content in White Rose Research Online to be in breach of UK law, please notify us by
Using Knowledge Anchors to Facilitate User
Exploration of Data Graphs
Editor(s): Krzysztof Janowicz, University of California, USA
Solicited review(s): Valentina Maccatrozzo, Vrije Universiteit Amsterdam, Netherlands; Bo Yan,University of California, USA;
Simon Scheider, Utrecht University, Netherlands.
Marwan Al-Tawila,b,*, Vania Dimitrovab, Dhavalkumar Thakkerc,b
a King Abdullah II School of Information Technology, University of Jordan, Amman, Jordan b School of Computing, University of Leeds, Leeds, UK
c Faculty of Engineering and Informatics, University of Bradford, Bradford, UK
Abstract. This paper investigates how to facilitate users’ exploration through data graphs. The prime focus is on knowledge utility, i.e. increasing a user’s domain knowledge while exploring a data graph, which is crucial in the vast number of user-facing semantic web applications where the users are not experts in the domain. We introduce a highly unique exploration support mechanism underpinned by the subsumption theory for meaningful learning. A core algorithmic component for operationalising the subsumption theory for meaningful learning is the automatic identification of knowledge anchors in a data graph (KADG). We present several metrics for identifying KADG which are evaluated against familiar concepts in human cognitive structures. The second key component is a subsumption algorithm that utilises KADG for generating exploration paths for knowledge ex-pansion. The implementation of the algorithm is applied in the context of a Semantic data browser in a music domain. The resultant exploration paths are evaluated in a task-driven experimental user study compared to free data graph exploration. The findings show that exploration paths, based on subsumption and using knowledge anchors, lead to significantly higher increase in the users’ conceptual knowledge and better usability than free exploration of data graphs. The work opens a new avenue in semantic data exploration which investigates the link between learning and knowledge exploration. We provide the first frame-work that adopts educational theories to inform data graph exploration for knowledge expansion which extends the value of exploration and enables broader applications of data graphs in systems where the end users are not experts in the specific domain. Keywords: Data graphs, knowledge utility, data exploration, meaningful learning, knowledge anchors, exploration paths.
1. Introduction
In recent years, RDF linked data graphs have be-come widely available on the Web and are being adopted in a range of user-facing applications offering search and exploration tasks. In contrast to regular search where the user has a specific need in mind and an idea of the expected search result [1], exploratory search is open-ended requiring significant amount of exploration [2], has an unclear information need [3], and is used to conduct learning and investigative tasks [4]. There are numerous examples from exploring re-sources in a new domain (like in academic research
*Corresponding author (E-mail: m.altawil@ju.edu.jo).
and may not be able to identify which exploration paths are most useful; this can lead to confusion, high cognitive load, frustration and feeling of being lost.
To overcome these challenges, appropriate ways to facilitate users’ exploration through data graphs are re-quired. Research on exploration of data graphs has come a long way from initial works on presenting linked data in visual or textual forms [5,6]. Recent studies on data graph exploration have brought to-gether research from related areas - Semantic Web, personalisation, adaptive hypermedia, and human-computer interaction - with the aim of reducing users’ cognitive load and providing support for knowledge exploration and discovery [7–9]. Several attempts have developed support for layman users, i.e. novices in the domain. Examples include: personalising the exploration path tailored to the user’s interests [10], presenting RDF patterns to give an overview of the domain [11], or providing graph visualisations to sup-port navigation [12]. However, existing work on facil-itating users’ exploration through data graphs has ad-dressed mainly investigative tasks, omitting important exploratory search tasks linked to supporting learning. The exploration of a data graph (if properly as-sisted) can lead to an increase in the user’s knowledge. This is similar to learning through search - an emerg-ing research area in information retrieval [13,14], which argues that “searching for data on the Web should be considered an area in its own right for future research in the context of search as a learning activity” [15]. In the context of data graphs, learning while searching/exploring has not been studied. The closest to learning is research on tools for exploration of in-terlinked open educational resources [16]. However, this is a very specific context, and does not consider the generic context of learning while exploring data graphs in any domain. This generic learning context is addressed here.
The work presented in this paper opens a new ave-nue that studies learning through data graph explora-tion. It addresses a key challenge: how to support peo-ple who are not domain experts to explore data graphs in a way that can lead to expanding their domain knowledge. We investigate how to build automated ways for navigating through data graphs in order to add a new value to the exploration, which we call ‘knowledge utility’ - expanding one’s domain knowledge while exploring a data graph1. Our earlier
1 We follow definitions of utility (i.e. reducing users’ cognitive load
in knowledge retrieval) and usability (i.e. supporting users’ sense making and information exploration and discovery) [103].
work showed that when exploring data graphs in un-familiar or partially un-familiar domains, users serendip-itously learn new things that they are unaware of [17– 19]. However, not all exploration paths can be benefi-cial for knowledge expansion: paths may not bring new knowledge to the user leading to boredom, or may bring too many unfamiliar things so that the user be-comes confused and overwhelmed [18].
The key contribution of this paper is a novel com-putational approach for generating exploration paths that can lead to expanding users’ domain knowledge. Our approach operationalises Ausbel’s subsumption theory for meaningful learning [20] which postulates that human cognitive structures are hierarchically or-ganised with respect to levels of abstraction, general-ity, and inclusiveness of concepts; hence, familiar and inclusive entities are used as knowledge anchors to subsume new knowledge. Consequently, our approach to generate exploration paths includes:
computational methods for identifying knowledge anchors in a data graph (KADG); and
algorithms for generating exploration paths by uti-lising the identified knowledge anchors.
To find possible knowledge anchors in a data graph, we utilise Rosch’s notion of Basic Level Objects (BLO) [21]. According to this notion, familiar cate-gory objects (e.g. the musical instrument Guitar) are at a level of abstraction called the basic level where the category’s members (e.g. Folk Guitar, Clas-sical Guitar) share attributes (e.g. both have a
neck and a bridge) that are not shared by members (e.g.
Grand Piano, Upright Piano) of another
cat-egory at the same level of abstraction such as Piano. We have adapted metrics from formal concept analy-sis for detecting knowledge anchors in data graphs. The KADG metrics are applied on an existing data
graph, and the output is evaluated against human Basic Level Objects in a Data Graph (BLODG) derived via
free-naming tasks.
have followed the suggested exploration paths, the in-crease of their knowledge was significantly higher and the usability was better.
The paper is structured as follows. Section 2 posi-tions the work in the relevant literature and presents relevant theories. Section 3 presents experimental and theoretical foundations, including the application con-text for algorithm validation and the theoretical under-pinning. Section 4 provides preliminaries with key definitions, followed by a formal description of met-rics for identifying KADG (Section 5). Sections 6
de-scribes an experimental study to validate the KADG
metrics against human BLODG. Section 7 describes a
subsumption algorithm for generating exploration paths for knowledge expansion; then Section 8 pre-sents a task-driven user study to evaluate the generated paths against free exploration. Section 9 discusses the findings, and Section 10 concludes the paper.
2.Related Work
We will review relevant research on data graph ex-ploration to justify the main contributions of our work, and will compare to existing approaches for identify-ing key entities and generatidentify-ing paths in data graphs. Since our work involves several evaluation steps, we review relevant evaluation approaches.
2.1.Exploration through Data Graphs
Semantic data exploration approaches are divided into two broad categories: (i) visualisation approaches [22–25] and (ii) text-based semantic data browsers [26–29]. Visualisation provides an important tool for exploration that leverages the human perception and analytical abilities to offer exploration trajectories. These approaches, in addition to intuitiveness, focus on the need for managing the dimensions in semantic data represented as properties, similarity and related-ness of concepts. The text-based browser approaches operate on semantically augmented data (e.g. tagged content) with layout browsing trajectories using rela-tionships in the underpinning ontologies. These ap-proaches adopt techniques from learning, human-computer interaction and personalisation to enhance the data exploration experience of users.
2.1.1.Visualisation Approaches for Data Graph Exploration
A state-of-the-art review of approaches that harness visualisation for exploratory discovery and analysis of
These visualization efforts are geared towards help-ing layman users to explore complex graph structures by hiding the complexity of semantic terminology. However, the effectiveness of any visualization de-pends on the user’s ability to make sense of the graph-ical representation which in many cases can be rather complex. Users who are new to the domain may strug-gle to grasp the complexity of the knowledge pre-sented in the visualisation. Our approach to automati-cally identify entities that are close to the human cog-nitive structures can be used as complementary to vis-ualisation approaches to simplify the data graph by pointing at entities that layman users can be familiar with. The prime focus of our approach is providing ex-ploration paths to augment users’ interaction in text-based data browsers by, which are reviewed next.
2.1.2.Text-based Semantic Data Browsers
Two types of semantic data browsers had emerged since the early days– (i) pivoting (or set-oriented browsing) browsers and (ii) multi-pivoting browsers. In a pivoting browser, a many-to-many graph brows-ing technique is used to help a user navigate from a set of instances in the graph through common links [26]. Exploration is often restricted to a single starting point and uses ‘a resource at a time’ to navigate anywhere in the data graph [27]. This form of browsing is re-ferred to as uni-focal browsing. Another type of browsing is multi-pivoting where the user starts from multiple points of interest, e.g. [28], [29], [34], [37].
A noteworthy variation of the pivoting approach is the use of facets for text-based data browsing of linked datasets. Faceted browsing is the main approach for exploratory search in many applications. The ap-proach employs classification and properties features from linked datasets as a mean to offer facets and con-text of exploration. Facet Graphs [38], gFacet [39], and tFacet [40], are early efforts in this area. More re-cent attempts include Rhizomer [41], which combines navigation menus and maps to provide flexible explo-ration between different classes; Facete [42], a visual-ization-based exploration tool that offers faceted fil-tering functionalities; Hippalus [43], which allows us-ers to rank the facets according to their preferences; Voyager [44], which couples faceted browsing with visualization recommendation to support users explo-ration; and SynopsViz [45], which provides faceted browsing and filtering RDF over classes and proper-ties. Although these approaches provide support for user exploration, layman users who are performing ex-ploratory search tasks to learn or investigate a new topic, can be cognitively overloaded, especially when
the facets provide many options (i.e. multiple links) for the users to explore. The authors in [11] proposed Sview, a browser that utilises a link pattern-based mechanism for entity-centric exploration over Linked Data. Link patterns describe explicit and implicit rela-tionships between entities and are used to categorise linked entities. A link pattern hierarchy is constructed using Formal Concept Analysis (FCA), and three measures are used to select the top-k patterns from the hierarchy. The approach does not consider the user perspective when identifying link patterns to support exploratory search, which would make browsing chal-lenging especially in unfamiliar domains.
Personalisation approaches consider the user’s pro-file and interests to adapt the exploration to the user’s needs. An approach that explicitly targets personalisa-tion in semantic data explorapersonalisa-tion using users’ interests is presented in [46]. Recent approaches aim to im-prove search efficiency over Linked Data graphs by considering user interests [47] or to diversify the user exploration paths with recommendations based on the browsing history [48]. A method for personalised ac-cess to Linked Data has been suggested in [49] based on collaborative filtering that estimates the similarity between users, and produces resource recommenda-tions from users with similar tastes. A graph-based recommendation methodology based on a personal-ised PageRank algorithm has been proposed in [50]. The approach in [51] allows the user to rate semantic associations represented as chains of relations to re-veal interesting and unknown connections between entities for personalised recommendations.
2.2.Identifying Key Entities in Data Graphs
The most recent statistics2 show that there are 3360 interlinked, heterogeneous datasets containing ap-proximately 3.9 billion facts. The volume and hetero-geneity of such datasets makes their processing for the purpose of exploration a daunting challenge. Utilisa-tion of various computaUtilisa-tional models makes it possi-ble to handle this challenge in order to offer fruitful exploration of semantic data. Finding key entities in a data graph is an important aspect of such computa-tional models and is generally implemented using on-tology summarization [52] and Formal Concept Anal-ysis (FCA) [53] techniques.
Ontology summarisation has been seen as an im-portant method to help ontology engineers to make sense of an ontology, in order to understand, reuse and build new ontologies [23,54,55]. Summarising an tology involves identifying the key concepts in an on-tology [56]. An onon-tology summary should be concise, yet it needs to convey enough information to enable ontology understanding and to provide sufficient cov-erage of the entire ontology [57]. Centrality measures have been used in [52] to identify key concepts and produce RDF summaries. The notion of relevance based on the relative cardinality and the in/out degree centrality of a node has been used in [58] to produce graph summaries. The approach presented in [57] ex-ploits the structure and the semantic relationships of a data graph to identify the most important entities using the notion of relevance, which is based on relative car-dinality (i.e. judging the importance of an entity from the instances it contains) and the in/out degree central-ity (i.e. the number and type of the incoming and out-going edges) of an entity.
The closest ontology summarisation approach to the context of our work deals with extracting key con-cepts in an ontology [59,60]. It highlights the value of cognitive natural categories for identifying key con-cepts to aid ontology engineers to better understand the ontology and quickly judge the suitability of an on-tology in a knowledge engineering project. The au-thors applies a name simplicity approach, which is in-spired by the cognitive science notion of Basic Level Objects (BLO) [21] as a way to filter entities with lengthy labels for the ontology summary. The work in [60] has utilised BLO to extract ontologies from col-laborative tags. A metric based on the category utility is proposed to identify basic concepts from collabora-tive tags, where tags of a concept are inherited by its
2 http://stats.lod2.eu/
sub-concepts and a concept has all instances of its de-scendants. However, these approaches focus on the experimental side, and do not adopt the formal defini-tions of BLO and cue validity described in [21,61] in the context of a data graph. Our work operationalises these formal definitions by developing several metrics for identifying knowledge anchors in a data graph.
Formal Concept Analysis (FCA) is a method for analysis of object-attribute data tables [53], where data is represented as a table describing objects (i.e. taxo-nomical concepts), attributes and their relationships. FCA has been applied in different application areas [62,63] such as Web mining and ontology engineering. In Web mining, FCA based approaches have been used to improve the quality of search results presented to the end users. For example, the work in [64] has de-veloped a personalised domain-specific search system that uses logs of keywords and Web pages previously entered and visited by other persons to build a concept lattice. More recently, FCA has been applied to con-struct a link pattern hierarchy to organise semantic links between entities in a data graph [11]. In ontology engineering, FCA has been used in two topics: ontol-ogy construction and ontolontol-ogy refinement. The work in [65] uses FCA to construct ad hoc ontologies to help the user to better understand the research domain. In [66] the authors present OntoComp, an approach for supporting ontology engineers to check whether an OWL ontology covers all relevant concepts in a do-main, and supports the engineers to refine (extend) the ontology with missing concepts. The psychological approaches to basic level concepts have been formally defined for selecting important formal concepts in a concept lattice by considering the cohesion of a formal concept [67]. This measures the pair-wise similarity between the concept’s objects based on common at-tributes. More recently, the work in [68] has reviewed and formalised the main existing psychological ap-proaches to basic level concepts. Five apap-proaches to basic level objects have been formalised with FCA [68]. The approaches utilise the validity of formal con-cepts to produce informative concon-cepts capable of re-ducing the user’s overload from a large number of concepts supplied to the user.
concepts which are likely to be familiar to users who are not domain experts. Focusing on layman users, we provide unique contribution that adopts Rosch’s sem-inal cognitive science work [21] to devise algorithms that identify (i) KADG that represent familiar graph
en-tities, and (ii) BLODG which correspond to human
cog-nitive structures over a data graph. Crucially, these al-gorithms are validated with layman users who are not domain experts.
2.3.Generating Paths in Data Graphs
In data graphs, the notion of path queries uses reg-ular expressions to indicate start and end entities of paths in data graphs [69]. For example, in a geograph-ical graph database representing neighborhoods (i.e. places) as entities and transport facilities (e.g. Bus, Tram) as edges, the user writes a simple query such as “I need to go from Place a to Place b”, and the user is then provided with different transportations facilities going through different routes (paths) starting from Place a to reach the destination Place b [69]. Another used notion is property paths which specify the possi-ble routes between two entities in a data graph. Prop-erty paths are used to capture associations between en-tities in data graphs where an association from entity
a to entity b comprises entity labels and edges [70]. However, in data graphs there are usually high num-bers of associations (i.e. possible property paths) be-tween the entities and ways to refine and filter the pos-sible paths, are required. To tackle this challenge, the work in [7] presented Explass3 for recommending pat-terns (i.e. paths) between entities in a data graph. A pattern represents a sequence of classes and relation-ships (edges). Explass uses frequency of a pattern to reflect its relevance to the query. It also uses informa-tiveness of classes and relationships in the pattern to indicate its informativeness by adding the informa-tiveness of all classes and relationships. Relfinder4 [71] provides an approach for helping users to get an overview of how two entities are associated together by showing all possible paths between these entities in the data graph. Discovery Hub [72] is another ap-proach that o ers faceted browsing and multiple re-sults explanations features to drive the user in unex-pected browsing paths. The work in [73] presents a linked data based exploratory search feature for re-trieving topic suggestions based on the user’s query and a set of heuristics, such as frequency of entities, events and places. The notions of knowledge patterns
3 http://ws.nju.edu.cn/explass/
and type-property paths have been used in [74] to sup-port querying RDF datasets. Central types and proper-ties in paths are extracted based on their centrality in the RDF graph and used to construct a knowledge ar-chitecture of the graph. More recently, the work in [75] proposes a serendipity model to extract paths be-tween items in the graph based on novelty of items, which is used for serendipitous recommendations.
While several approaches address the problem of supporting users’ exploration through data graphs, none of them aims at supporting layman users who are not domain experts. Many of the existing approaches may not be suitable for layman users, who may be-come confused or overloaded with too much unfamil-iar entities. None of the existing approaches offers ex-ploration paths to help users to expand their domain knowledge. Several approaches generate paths that link graph entities specified by the user, and are there-fore suitable for tasks where the users are familiar with the domain. Instead, we provide paths for uni-focal ex-ploration where the user starts from a single entry point and explores the data graph. The unique feature of our work is the explicit consideration of knowledge utility of exploration paths. We are finding entities that are likely to be familiar to the user and using them as knowledge anchors to gradually introduce unfamiliar entities and facilitate learning. This can enhance the usability of semantic data exploration systems, espe-cially when the users are not domain experts. There-fore, our work can facilitate further adoption of linked data exploration in the learning domain. It can also be useful in other applications to facilitate the exploration by users who are not familiar with the domain pre-sented in the graph.
2.4.Data Exploration Evaluation Approaches
In the context of ontology summarisation, there are two main approaches for evaluating a user-driven on-tology summary [54]: gold standard evaluation, where the quality of the summary is expressed by its similar-ity to a manually built ontology by domain experts, or corpus coverage evaluation, in which the quality of the ontology is represented by its appropriateness to cover the topic of a corpus. The evaluation approach used in [59] included identifying a gold standard by asking ontology engineers to select a number of concepts they considered the most representative for summarising an ontology. In this paper, we evaluate algorithms for
identifying KADG by comparing the algorithms’
out-puts versus a benchmarking set of BLO identified by humans. To the best of our knowledge, there are no evaluation approaches that consider key concepts in data graphs which correspond to cognitive structures of users who are not domain experts. Our evaluation approach that identifies BLODG through an
experi-mental method adapting Cognitive Science methods is novel and can be applied to a range of domains.
Evaluation of data exploration applications usually considers the exploration utility from a user’s point of view or analyses the application’s usability and per-formance (e.g. precision, recall, speed etc.) [22]. The prime focus is assessing the usability of semantic Web applications, while assessing how well the applica-tions help the users with their data exploration tasks is still a key challenge [76]. Task driven user studies have been utilised to assess whether a data exploration application provides useful recommendations for ac-complishing users exploration tasks [36]. A task driven benchmark for evaluating semantic data explo-ration has been presented in [76]. The benchmark pre-sents a set of information-seeking tasks and metrics for measuring the effectiveness of completing the tasks. The evaluation approach in [77] aims to identify whether the simulated exploration paths information networks are similar to those produced by human ex-ploration. We will adopts the established task-based approach and will utilise an educational taxonomy for assessing conceptual knowledge to assess knowledge utility and usability of the generated exploration paths.
3.Experimental and Theoretical Foundation
3.1.Application Context
Our novel data graph exploration approach includes several algorithms which are formally defined and are independent from the domain and the data graph used. In order to validate the approach and evaluate the al-gorithms, we need a concrete application context. We will utilise MusicPinta - a semantic data browser in the music domain [18]. MusicPinta provides a uni-focal interface for users to navigate through musical instru-ment information extracted from various linked da-tasets. The MusicPinta dataset includes several sources, including DBpedia5 for musical instruments and artists, extracted using SPARQL CONSTRUCT
5 http://dbpedia.org/About.
6 http://dbtune.org/.
[image:8.612.323.521.439.507.2]queries. The DBTune6 dataset is utilised for music-re-lated structured data. Among the datasets on DBTune.org we utilise: (i) Jamendo which is a large repository of Creative Commons licensed music; (ii) Megatune is an independent music label; and (iii) Mu-sicBrainz is a community-maintained open source en-cyclopaedia of music information. The dataset coming from DBTune.org (such as MusicBrainz, Jamendo and Megatunes) already contains the “sameAs” links be-tween them for linking same entities. We utilise the “sameAs” links provided by DBpedia to link Mu-sicBrainz and DBpedia datasets. In this way, DBpedia is linked to the rest of the datasets from DBtune.org, enabling exploration via rich interconnected datasets. The MusicPinta dataset has 2.4M entities and 19M triple statements, taking 2GB physical space, includ-ing 876 musical instruments entities, 71k (perfor-mances, albums, records, tracks), and 188k music art-ists. The dataset is made available on sourceforge7. All datasets in MusicPinta are available as a linked RDF data graph and the Music ontology8 is the ontology used as the schema to interlink them.
Table 1.Main characteristics of MusicPinta data graph. The data graph includes five class hierarchies. Each class hierarchy has
number of classes linked vie the subsumption relationship
rdfs:subClassOf . DBpedia categories are linked to classes via the dcterms:subject relationship, and classes are linked via domain-specific relationship MusicOntology:instrum ent to musical performances. The depth of a class hierarchy is
the maximum depth value for entities in the class hierarchy. Instrument class
hierarchy classes No. of No. of DBpe-dia categories performances No. of music Depth
String 151 255 348 7
Wind 108 161 1539 7
Percussion 82 182 127 5
Electronic 16 7 11 1
Other 7 0 2 1
The MusicPinta dataset provides an adequate setup since it is fairly large and diverse, yet of manageable size for experimentation. The music ontology provides sufficient class hierarchy for experimentation. For in-stance, the class hierarchies for the String and
Wind musical instruments have depths of 7, which is considered ideal for applying the cognitive science no-tion of basic level objects [21] on data graphs, as this notion states that objects within a hierarchy are classi-fied at least three different levels of abstraction (super-ordinate, basic, subordinate). Figures 1 - 3 show ex-amples of the user interface in the MusicPinta seman-tic data browser.
Fig. 1. Semantic search interface in MusicPinta where a user in-serts a name of a musical instrument (e.g. Xylophone).
Fig. 2. Description page of the entity 'Xylophone' in Mu-sicPinta, extracted from DBpedia using CONSTRUCT queries.
Fig. 3. Semantic Links (i.e. predicates) related to entity Xylo-phone presented in Features and Relevant Information. Fea-tures include semantic relationships rdf:type (e.g. Xylo-phone is an instrument), rdfs:subclassOf (e.g. subClass
Xylophone belongs to superClass Tuned Percussion) and dcterms:subject (e.g. Xylophone belongs to DBpedia category Greek loanwords). Relevant Information
include rdfs:subclassOf(e.g.Celesta is subClassOf Xylophone).
3.2.Knowledge Utility of an Exploration Path
To approximate the knowledge utility of an explo-ration path, we need a systematic approach. For this, we adapt the well-known taxonomy by Bloom [78] which is used for assessing conceptual knowledge.
The taxonomy identifies a set of progressively com-plex learning objectives that can be used to assess learning experiences over information seeking and search tasks [79]. It suggests linking knowledge to six cognitive processes: remember, understand, apply, an-alyze, evaluate, and create. Among these, remember
and understand are directly related to browsing and exploration activities. The remaining processes re-quire deeper learning activities, which usually happen outside a browsing tool, in our case Semantic data browser, and hence will not be considered. The pro-cess remember is about retrieving relevant knowledge from the long-term memory, and includes recognition (locating knowledge) and recall (retrieving it from memory) [78]. The process understand is about con-structing meaning; the most relevant to our context are
categorise (determine entity membership) and com-pare (detect similarities) [78].
To approximate the knowledge utility of an explo-ration path, we employ schema activation - it was ap-plied for assessing user knowledge expansion when reading text [80]. To assess the user’s knowledge of a target domain concept (X), the user is asked to name concepts that belongs to and are similar to the target concept X. A schema activation test is conducted be-fore an exploration and after an exploration, using three questions related to the cognitive processes re-member, categories, and compare:
-Q1 [remember]What comes in your mind when you
hear the word X?;
-Q2 [categorise]What musical instrument categories does X belong to?;
-Q3 [compare] What musical instruments are
similar to X?
The number of accurate concepts named (e.g. nam-ing an entity with its exact name, or with a parent or with a member of the entity) by the user before and after exploration is counted, and the difference indi-cates the knowledge utility of the exploration. For ex-ample, if a user could name correctly two musical in-struments similar to the musical instrument Biwa
(Q3) before an exploration and then the user could name correctly six names of musical instruments sim-ilar to the instrument Biwa after the exploration, then the effect of the exploration on the cognitive process
3.3.Subsumption Theory Underpinning Exploration
In a scoping user study, we examined user explora-tion of musical instruments in MusicPinta to identify what strategies would lead to paths with high knowledge utility (details of the study are given in [81]). We examined two dimensions - the user’s famil-iarity with the domain and the density of entities in the data graph. Paths which included familiar and dense entities and brought unfamiliar entities led to increas-ing the users’ knowledge. For example, when a partic-ipant was directed to explore the entity Guitar
which he/she was familiar with, the participant could see unfamiliar entities linked to Guitar such as
Resonator Guitar and Dobro. The entity
Guitar served as an anchor from where the user
made links to new concepts (Resonator Guitar
and Dobro). We also noted that the dense entities, which had many subclasses and were well-connected in the graph, provided good potential anchors that could serve as bridges to learn new concepts.
While the scoping study provided us with useful in-sights, it did not give solid theoretical model for de-veloping an approach that generalises across domains and data graphs. The study findings directed us to Au-subel’s subsumption theory for meaningful learning [20] as a possible theoretical underpinning model for generating exploration paths. This theory [20,82–84] has been based on the premise that a human cognitive structure (i.e. individual’s organisation, stability, and clarity of knowledge in a particular subject matter field) is the main factor that influences the learning and retention of new knowledge [84]. In relation to meaningful learning, the subsumption process postu-lates that a human cognitive structure is hierarchically organised with respect to levels of abstraction, gener-ality, and inclusiveness of concepts. Highly inclusive concepts in the cognitive structure can be used as
knowledge anchors to subsume and learn new, less in-clusive, sub-concepts through meaningful relation-ships [20,83,85,86]. Once the knowledge anchors are identified, attention can be directed towards identify-ing the presentation and sequential arrangement of the new subsumed content [84]. Hence, to subsume new knowledge, anchoring concepts are first introduced to the user, and then used to introduce new concepts.
3.4.Basic Level Objects
To identifying knowledge anchors in data graphs, we need to find entities that can be highly inclusive and familiar to the users. For this, we will adopt the
Basic Level Objects (BLO) notion which was intro-duced by Cognitive science research. It states that do-mains of concrete objects include familiar categories that exist at an inclusive level of abstraction in human cognitive structures (called the basic level). Most peo-ple are likely to recognise and identify objects at the basic level. An example from the experimental studies from Rosch et al. [21] of a BLO in the music domain is Guitar. Guitar represents a familiar category that is neither too generic (e.g. musical instru-ment) nor too specific (e.g. Folk Guitar – sub-class of the category Guitar).
Rosch, et al [21], define BLO as: categories that “carry the most information, possess the highest cate-gory cue validity, and are, thus, the most differentiated from one another”. Crucial for identifying basic level categories is calculating cue validity: “the validity of a given cue x as a predictor of a given category y (the conditional probability of y/x) increases as the fre-quency with which cue x is associated with category y
increases and decreases as the frequency with which cue x is associated with categories other than y in-creases” [21]. A members of a BLO share many fea-tures (attributes) together, and hence they have high similarity values in terms of the feature the BLO mem-bers share. Consequently, two approaches can be ap-plied to identify BLO in a domain taxonomy:
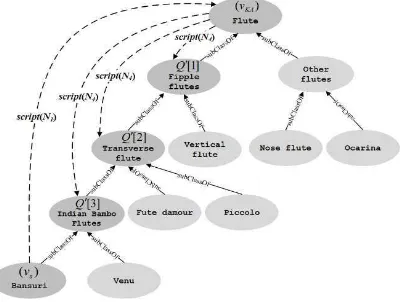
Distinctiveness (highest cue validity). This fol-lows the formal definition of cue validity (given above). It identifies most differentiated category ob-jects in a domain. A differentiated category object has most (or all) of its cues (i.e. attributes) linked to its members (i.e. subclasses of the category object) only, and not linked to other category objects in the taxon-omy. Each entity linked to one (or more) members of the category object will have a single validity value used as a predictor for the distinctiveness of the cate-gory among other catecate-gory objects in the taxonomy. For example, the category object v2 in Figure 4 has four entities (u3,u4,u5,u6) linked to its members (v21,v22,v23,v24). The validity of entity u4 as predictor of category v2 is higher than entity u3, since u4 is only linked to members of the category v2 whereas entity u3 is linked to members of the categories v1 and v2.
number of entities shared by its members. The homo-geneity value for a category object considers the pair-wise similarity values between the category’s mem-bers. For example in Figure 4, the category entity v2 considers the pairwise similarities between its mem-bers (e.g. similarity between [v21,v22], [v21, v23], [v21,v24]). The higher the similarity between members of that category, the more likely that the category is at the basic level.
In the following sections, we will utilise Ausbel’s subsumption theory to generate exploration paths through data graphs based on knowledge anchors. We will split this into two stages: (i) identifying knowledge anchors in data graphs, and (ii) using the knowledge anchors to subsume new knowledge.
4.Preliminaries
We provide here the main definitions that will be used in the formal description of the algorithms.
RDF describes entities and attributes (edges) in the data graph, represented as RDF statements. Each state-ment is a triple of the form <Subject - Predicate - Ob-ject> [87]. The Subject and Predicate denote entities in the graph. An Object is either a URI or a string. Each Predicate URI denotes a directed attribute with
Subject as a source and Object as a target.
Definition 1 [Data graph]. Formally, a data graph is a labelled directed graph DGV,E,T, depict-ing a set of RDF triples where:
- V {v1,v2,...,vn}is a finite set of entities; - E{e1,e2,...,em}is a finite set of edge labels;
- T {t1,t2,..., tk}is a finite set of triples where each triple is a proposition in the form of vu,ei,vo
with vu,voV , where vu is the Subject (source
en-tity) and
v
ois the Object (target entity); and eiEis the Predicate (edge label).
In our analysis of data graphs, the set of entities V
will mainly consist of the concepts of the ontology and can also include individual objects (instances of con-cepts). The edge labels will correspond to semantic re-lationships between concepts and individual objects. These labels include the subsumption relationship
rdfs:subclassOf and the rdf:type
relation-ship. For a given entity vi, we will be interested
pri-marily in its direct and inferred subclasses, and in-stances. The set of entities V can be divided further by
using the rdfs:subclassOf subsumption
rela-tionship denoted as
) and following its transitivity inference. This includes:-Root entity(
r
) which is superclass for all entities in the domain;-Category entities(C V ) which are the set of all inner entities (other than the root entity
r
), that have at least one subclass, and may also include some in-dividual objects;-Leaf entities(LV ) which are the set of entities that have no subclasses, and may have one or more individuals.
Starting from the root entity
r
, the class hierarchy in a data graph is the set of all entities linked via thesub-sumption relationship rdfs:subClassOf. The set
of entities in the class hierarchy include the root entity
r
, Category entities C and Leaf entities L.The set of edge labels E is divided further consid-ering two relationship categories:
-Hierarchical relationships(H)is a set of subsump-tion relasubsump-tionships between the Subject and Object
entities in the corresponding triples.
-Domain-specific relationships(D) represent rele-vant links in the domain, other than hierarchical links, e.g. in a music domain, instruments used in the same performance are related.
Definition 2 [Data Graph Trajectory]. A
trajec-tory J in a data graph DGV,E,T is defined as a sequence of entities and edge labels within the data graph in the form of Jv1,e1,v2...,vn,en,vn1, where:
- viV,i1,...,n1; - ejE,j1,...,n;
- v1 and vn1are the first and the last entities of the data graph trajectoryJ , respectively;
- nis the length of the data graph trajectoryJ . Definition 3 [Entity Depth]. The depth of an entity
v CUL is the length of the shortest data graph trajec-toryfrom the entity
v
to the root entityr
in the class hierarchy of the data graph.Definition 4 [Exploration Path]. An exploration path P in a data graph DG is a sequence of finite set
of transition narratives generated in the form of:
v1,n1,v2 , v2,n2,v3,...,vm,nm,vm1
P , where:
- viV,i1,...,m1;
-
v
1 andv
m1 are the first and last entities of the ex-ploration path P, respectively;- ni,i1,...,m is a text string that represents a
narra-tive script;
- vi,ni,vi1 presents a transition from vito vi1 ,
which is enabled by the narrative script ni . Note that an exploration path P is different from a data graph trajectoryJ in thatviandvi1inPmay not be
directly linked via an edge label, i.e. the transition fromvitovi1in P can be either via direct link, an edge, or through an implicit link, a trajectory.
Our ultimate goal is to provide an automated way to generate an exploration pathP. This is achieved in two steps: (i) identifying entities that can serve as knowledge anchors (described in section 5) and (ii) utilising these knowledge anchors and the sub-sumption strategy (described in section 3.3) to gener-ate an exploration path (described in section 7).
5.Identifying Knowledge Anchors in Data Graphs
In section 3 we highlighted and justified the need for two approaches to identify knowledge anchors in a data graph: distinctiveness and homogeneity. We adopt metrics from FCA to define such distinctiveness and homogeneity matrices.
5.1.Distinctiveness Metrics
This group of metrics aims to identify differentiated categories whose members are linked to distinctive en-tities that are shared amongst the categories’ members but not with other categories. Each category entity
V
v that is linked through an edge label eto mem-bers vv of the category entity vC will have a sin-gle validity value to distinguish v from the other cate-gory entities. We follow the definition of cue validity provided by Rosch et al [21] in identifying basic level objects. According to Rosch et al, “the cue validity of an entire category may be defined as the summation of the cue validities for that category of each of the at-tributes of the category”. This definition is similar to the approach used to identify key concepts in formal concept analysis [68] where they summed up the va-lidity of objects of a formal concept. Three distinctive-ness metrics were developed and presented in [90].
Attribute Validity (AV). The attribute validity def-inition corresponds to the cue validity defdef-inition in [21] and adopts the formula from [68]. We use ‘attrib-ute validity’ to indicate the association with data
graphs - ‘cues’ in data graphs are attributes of the en-tities and are represented as relationships in terms of triples. The AV value of an entity vCwith respect
to a relationship type e, is calculated as the aggrega-tion of the AV values for all entities ve linked to
sub-classes v:vv. The attribute validity value of ve
in-creases, as the number of relationships of type e be-tween ve and the subclasses v : vv increases;
whereas the attribute validity value of vedecreases as
the number of relationships of type e between ve and
all entities in the data graph increases. We define the set of entities W(v,e) that are related to the subclasses
v:vv as subjects via relationship of type e :
W(v,e){ve: v
vv ve,e,vT
} (1)Formula 2 defines the attribute validity metric for a given entity v with regards to a relationship type e.
) ,
( |{ , , : }|
| } : , , { | )
, (
e v W
v e a a
e
e v e v v V
v v v e v e
v
AV (2)
An example is provided in Figure 4. The AV value for category entity v2with regard the domain-specific relationshipDis the aggregation of the AV values of the subject entities u3,u4,u5,u6 linked to members of the category entity v2 (i.e. objectsv21,v22,v23,v24) via the
[image:12.612.322.520.434.575.2]edge label or predicate D.
Fig. 4. A data graph showing entities and relationship types between entities.
The AV value for the entity u3 equals the number of triples between the subject entity u3 and members of the category v2 (the object entities v21,v22) via the
AV values for entities u3,u4,u5,u6 will identify the AV value for the category entity v2.
Category Attribute Collocation (CAC). This
ap-proach was used in [88] to improve the cue validity metric by adding a homogeneity weight called cate-gory-feature collocation measure which takes into ac-count the frequency of the attribute within the mem-bers of the category. This gives preference to ‘good’ categories that have many attributes shared by their members (i.e. high similarity between members of the category). In our case, a good category will be an en-tity vCwith a high number of relationships of type
e between ve and the subclasses v:v v, relative
to the number of its subclasses. Formula 3 defines the category-attribute collocation metric for a given entity
v with regard to a relationship type e.
| | | } : , , { | | } : , , { | | } : , , { | ) , ( ) , ( V v v v e v V v v e v v v v e v e v CAC e e v W
v e a a
e e
(3)Considering the example in Figure 4 for identifying theAVvalue for the entity , and considering the
re-lationship D, the CACadds a weight of (the number of the triples between the subjectu3 and the members of v2 via the relationship D divided by the number of members of the category entity v2. Hence the CAC
of u3 will be the AV value of u3 (i.e., 2/3) multiplied by (2/4), equal to 0.33. The aggregation of individual
CACvalues for entities u3,u4,u5,u6 will identify the CACvalue for v2.
Category Utility (CU). This approach was pre-sented in [89] as an alternative metric for obtaining categories at the basic level object. The metric takes into account that a category is useful if it can improve the ability to predict the attributes for members of the category, i.e. a good category will have many attrib-utes shared by its members (as mentioned in the cate-gory-attribute collocation metric), and at the same time, it possess ‘unique’ attributes that are not related to many other categories in the graph. In other words, CU gives preference to a category that have unique at-tributes associated only with the category’s members. We adapt the formula in [68] for a data graph:
2 2 ) , ( | | ) |} : , , { | ( ) | | |} : , , { | ( | | | | ) , ( V V v v e v V v v v e v V V e v
CU e a a
e v W v e e
(4)Continuing the previous example from Figure 4 for calculating the AV and theCACvalues for entity u3; in addition to the category-feature collocation measure
9 The implementation algorithm can be found in [90].
used by the CAC value, the CU will also include the proportion of all triples between the subject entity u3 and all the object entities in the graph (i.e. entities v12,
21
v ,v22) linked via relationshipD (i.e. 3 triples) over the number of entities linked via subsumption
relation-ships (e.g. rdfs:subClassOf and rdf: type)
in the graph (i.e. total 11 entities). Hence the CU
value for u3will be: (2/4)2 - (3/11)2= 0.177. The
aggre-gation ofCU values for entities u3,u4,u5,u6, multiplied by the total number of members of category
v
2, di-vided by the total number of entities in the graph linked via the susbsumption relationships will result in the CU value forv
2.5.2.Homogeneity Metrics
These metrics aim to identify categories whose members share many entities among each other. In this work, we have utilised three set-based similarity met-rics9 [90]: Common Neighbours (CN), Jaccard (Jac), and Cosine (Cos). We have selected these similarity metrics, since they are well-known and have been pre-viously used for measuring similarity between entities in linked data graphs (e.g. Jaccard similarity was used in [7] to measure the similarity between two patterns in a linked data graph, and cosine similarity was used in [50] to measure the similarity between pairs of items in recommendation lists). In homogeneity met-rics we normalise the values of the pair-wise similarity between every two members of a category objects and then take the average value. This is similar to the ap-proach used in [67] for calculating the similarity be-tween members of a category in formal concept anal-ysis. For instance (see Figure 4), the Jaccard similar-ity between the pair-wise members (v21,v22)of the en-tity v2considering the edge label D is equal to the number of intersected subject entities (in this example one entity, i,e., u3) linked to themvia edge label D, divided by the number of union subject entities (in this example two entities, i.e., u3 ,and u4) linked to them via edge label D.
6.Evaluation of Knowledge Anchor Algorithms
compared to the knowledge anchors KADG obtained by applying the metrics from section 5.
6.1.Obtaining Human BLODG
As described in the preliminaries, the set of entities in a data graph can be divided into two types: (i) cate-gory entities, representing the inner entities in a class taxonomy that have at least one member, and (ii) leaf entities, representing the set of entities that have no subclasses, and may have one or more individuals. Therefore, we divide the free-naming task into two strategies that correspond to the two types of entities:
Strategy 1: the participants were shown an image of a leaf entity, and were asked to type its name.
Strategy 2: the participants were shown a group of images presenting the entities of a category, and were asked to type the name of the category.
To obtain a set of human BLODG used to benchmark
the KADG metrics, we conducted a user study with the
MusicPinta data graph.
Participants. The study involved 40 participants recruited on a voluntary basis, varied in gender (28 male and 12 female), their cultural background (1 Bel-gian, 10 British, 5 Bulgarian, 1 French, 1 German, 5 Greek, 1 Indian, 2 Italian, 6 Jordanian, 1 Libyan , 2 Malaysian, 1 Nigerian, 1 Polish, and 3 Saudi Arabian), and age (18 – 55, mean = 25). None of these partici-pants had any expertise in music.
Method. The participants were asked to freely name objects that were shown in an image stimuli, un-der limited response time (10 seconds) for each image. Overall, 364 taxonomical musical instruments were extracted from the MusicPinta dataset by running SPARQL queries over the triple-store hosting the da-taset to get all musical instrument entities linked via
rdfs:subclassOf relationship. There were 256
leaf entities and 108 category entities. For each leaf entity, we collected a representative image from the Musical Instrument Museums Online (MIMO)10 ar-chive to ensure that pictures of high quality were shown to participants11. We ran ten online surveys12: (i) eight surveys presented 256 leaf entities, each showed 32 leaves; and (ii) two surveys presented 108 category entities (54 categories each).
Each image was shown for 10 seconds on the par-ticipant's screen, and the participant was asked to type the name of the given object (for leaf entities) or the
10 http://www.mimo-international.com/MIMO/
11MIMO provided pictures for most musical instruments. In the
rare occasions when an image did not exist in MIMO, Wikipedia images were used instead.
category of objects (for category entities). The image allocation in the surveys was done randomly. Every survey had four respondents (i.e. each image was named by four different participants - overall there were 1456 total answers). Each participant was allo-cated to one survey (either leaf entities or category en-tities). Figures 5-8 show example images and partici-pants’ answers (Figure 5 from Strategy 1; Figures 6-8 from Strategy 2). Processing the answers, we identify two sets of human BLODG(see [91] for detailed
algo-rithm how the two sets were obtained).
Set1 [resulting from Strategy1]. We mark as accu-rate naming of a category entity (parent) when leaf en-tity that belongs to this category is identified. This is illustrated in the example in Figure 5 which shows an accurate naming of Flute. The overall count for
[image:14.612.319.523.326.392.2]Flute will include all cases when participants named Flute while seeing any of its leaf members.
Fig. 5. Example of accurate naming of a category following Strategy 1. The user names the category entity Flute when shown an image of the leaf entity Bansuri that belongs to the
category Flute.
Set2 [resulting from Strategy 2]. We mark as accu-rate naming of a category entity when its exact name or a name of its parent or subclass member is identi-fied. These cases are illustrated in figures 6, 7 and 8.
Fig. 6. Example of accurate naming of a category following Strategy 2. The user names the category entity Flute when shown images of leaf entities belonging to the category Indian
Bambo Flutes which is a subclass of Flute.
12 The study was conducted with Qualtrics (www.qualtrics.com).
[image:14.612.321.520.488.596.2]Fig. 7. Example of accurate naming of a category following Strategy 2. The user names the category entity Flute when
[image:15.612.91.293.311.452.2]shown images of leaf entities that belong to Flute.
Fig. 8. Example of accurate naming of a category following Strategy 2. The user names the category entity Flute when shown images of leaf entities that belong to Woodwind which is a
parent of Flute.
In each of the two sets, entities with frequency equal or above two (i.e. named by at least two different par-ticipants) were identified as human BLODG. The union
of Set1 and Set2 gives human BLODG. In total, we
identified 24 human BLODG. The full list of human
BLODG obtained from MusicPinta is available in [92].
6.2.Evaluating KADG Against Human BLODG
We used the human BLODG to examine the
perfor-mance of the KADG metrics. For each metric, we
ag-gregated (using union) the KADG entities identified
us-ing the hierarchical relationships (H). We noticed that the three homogeneity metrics have the same values.
13 The Jaccard similarity metric is widely used, and was used in
identifying basic formal concepts in the context of formal concept analysis [67].
Therefore, we chose one metric when reporting the re-sults, namely Jaccard similarity13.
A cut-off threshold point for the result lists with po-tential KADG entities was identified by normalizing the
output values to a range between 0 and 1 from each metric and taking the mean value for the 60th percen-tile of the normalised lists14. The KADG metrics evalu-ated included the three distinctiveness metrics plus the Jaccard homogeneity metric; each metric was applied over both families of relationships – hierarchical (H) and domain-specific (D).
As in ontology summarisation approaches [59], a name simplicity strategy based on data graphs was ap-plied to reduce noise when calculating key concepts (usually, basic level objects have relatively simple la-bels, such as chair or dog). The name simplicity ap-proach we use is solely based on the data graph. We identify the weighted median for the length of the la-bels of all data graph entities v V and filter out all entities whose label length is higher than the median. For the MusicPinta data graph, the weighted median is 1.2, and hence we only included entities which consist of one word. Table 2 illustrates precision and recall values comparing human BLODG and KADG derived
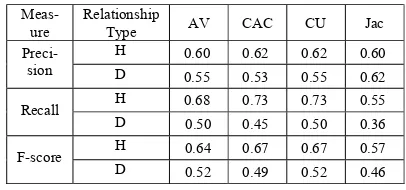
using hierarchical and domain specific relationships. We used Precision, Recall and F scores since we are dealing with a binary classification problem where all knowledge anchors identified by our KADG metrics are considered of same rank. All class entities above the 60th percentile are identified as knowledge anchors of same rank (i.e. knowledge anchors above the 60th per-centile are given the value of 1).
Table 2. MusicPinta: performance of the KADG algorithms
compared to human BLODG.
Meas-ure Relationship Type AV CAC CU Jac
Preci-sion H D 0.60 0.55 0.62 0.53 0.62 0.55 0.60 0.62
Recall H 0.68 0.73 0.73 0.55 D 0.50 0.45 0.50 0.36
F-score H 0.64 0.67 0.67 0.57 D 0.52 0.49 0.52 0.46
Hybridisation of Metrics. Further analysis of the False Positive (FP) and False Negative (FN) entities indicated that the metrics had different performance on different taxonomical levels in the graph. This led to the following hybridisation heuristics.
[image:15.612.321.524.494.589.2]Heuristic 1:Use Jaccard metric with hierarchical relationships for the most specific categories in the graph (i.e. the categories at the bottom quartile of the taxonomical level). There were FP entities (e.g.
Shawm and Oboe) returned by distinctiveness metrics using the domain-specific relationship
MusicOn-tology:Performance because these entities are
highly associated with musical performances (e.g.
Shawm is linked to 99 performances and Oboe is linked to 27 performance). Such entities may not be good knowledge anchors for exploration, as their hier-archical structure is flat. The best performing metric at the specific level was Jaccard for hierarchical attrib-utes - it excluded entities which had no (or a very small number of) hierarchical attributes.
Heuristic 2: Take the majority voting for all the other taxonomical levels. Most of the entities at the middle and top taxonomical level will be well repre-sented in the graph hierarchy and may include do-main-specific relationships. Hence, combining the values of all algorithms is sensible. Each algorithm represents a voter and provides two lists of votes, each list corresponding to hierarchical or domain-specific associated attributes (H, D). At least half of the voters should vote for an entity for it to be identified in KADG.
Examples from the list of KADG identified by applying
the above hybridisation heuristics included
Accor-dion, Guitar and Xylophone. The full KADG
list is available here [92]. Applying the hybridisation heuristics presented above improved Precision value
to 0.65 (average Precision in Table 2 = 0.59), Recall value to 0.68 (average Recall in Table 2 = 0.56), and F score to 0.66 (average F score in Table 2 = 0.57).
Examining the FP and FN entities for the hybridi-zation algorithm, led to the following observations about the possible use of KADG as exploration anchors.
Missing basic level entities due to unpopulated ar-eas in the data graph.We noticed that none of the met-rics picked FN entities (such as Harmonica,
Banjo or Cello) that belonged to the bottom
quartile of the class hierarchy and had a small number
of subclasses (e.g. Harmonica, Banjo and
Cello each have only one subclass and there are no domain-specific relationships with their members). Similarly, none of the metrics picked Trombone
(which is false negative) - although Trombone has three subclasses, it is linked only to one performance and is not linked to any DBpedia categories. While these entities belong to the cognitive structures of hu-mans and were therefore added in the benchmarking sets, one could doubt whether such entities would be
useful exploration anchors because they are not suffi-ciently presented in the data graph. These entities would take the user to ’dead-ends’ with unpopulated areas which may be confusing for exploration. We therefore argue that such FN cases could be seen as ‘good misses’ of algorithms.
Selecting entities that are superordinate of basic level entities. The FP included entities, such as
Tam-bura, Reeds, Bass, Brass, Castanets, and
Woodwind, which are well presented in the graph hierarchy (e.g. Reeds has 36 subclasses linked to 60 DBpedia categories, Brass has 26 subclasses linked to 22 DBpedia categories, Woodwind has 72 sub-classes linked to 82 DBpedia categories). Also, their members participate in many domain-specific rela-tionships (e.g. Reeds members are linked to 606 performances, Brass - 33, and Woodwind - 853). Although, these entities are not close to the human cognitive structures, they provide direct links KADG
entities from the benchmarking sets (e.g. Reeds links
to Accordion, Brass links to Trumpet and
Woodwind links to Flute).We therefore argue
that such FP cases could be seen as ‘good picks’ of the algorithms because they can provide exploration
bridges to reach BLO.
The generated KADG after applying hybridisation is
used for generating data graph exploration paths, as presented in the next section.
7.Exploration Strategies Based on Subsumption
In this section we describe how we use KADG to
generate navigation paths following on the subsump-tion theory for meaningful learning (see secsubsump-tion 3.3). To do this, we have to address two challenges:
Challenge 1: how to find the closest knowledge an-chor to the first entity of an exploration path? In uni-focal browsing (pivoting), a user starts his/her explo-ration from a single entity in the graph, also referred as a first entity (vs) of an exploration path. For example,
a user who wants to explore information about the mu-sical instrument Xylophone is directed to use Mu-sicPinta semantic data browser. The user starts his/her exploration by entering the name of Xylophone in MusicPinta Semantic search interface (see Figure 1).
knowledge anchors in a data graph; hence, we need a mechanism to identify the closest knowledge anchor
vKA to the first entity vs. We propose an algorithm to
find the closest and most relevant knowledge anchor, presented in section 7.1.
Challenge 2: how to use the closest knowledge an-chor to subsume new class entities for generating an exploration path? The closest knowledge anchor usu-ally can have many subclass entities at different levels of abstractions. It is important to identify which sub-classes to subsume and in what order while generating an exploration path for the user. Furthermore, we also need to identify appropriate narrative scripts between the entities in the exploration path to help layman us-ers to create meaningful relationships between famil-iar entities they already know. Our algorithm for gen-erating an exploration path and the corresponding transition narratives is presented in section 7.2.
7.1.Finding the Closest KADG
Let vs be the first entity of an exploration path. It
can be any class entity in the class hierarchy. If vsis a knowledge anchor (vs
KADG), then there is no needto identify the closest knowledge anchor, and the sub-sumption process can start immediately from vs.
How-ever, if vs is not a knowledge anchor (vs
KADG),then vs can be superordinate, subordinate, or sibling
of one or more knowledge anchors. Hence, an auto-matic approach for identifying the closest knowledge anchor vKA to vs is required. For this, we calculate the
semantic similarity between vs and every knowledge
anchor vi
KADG. The semantic similarity betweentwo entities in the class hierarchy is based on their dis-tances (i.e. length of the data graph trajectory between both entities). Due to the fact that class hierarchies ex-ist in most data graphs, we adopt the semantic similar-ity metric from [93] and used in [94] and apply it in the context of a data graph, where semantic similarity is based on the lengths between the entities in the class hierarchy. The semantic similarity between vs and a
knowledge anchor vi is calculated as:
) ( )
( ( ( , ))
. 2 : ) , (
i s
i s i
s v depthdepthv lcadepthv vv
v sim
(5)
where, lca(vs,vi) is the least common ancestor of vs
and vi, and depth(v) is a function for identifying the
depth of the entity v in the class hierarchy.
Algorithm I describes how the semantic similarity metric is applied to identify vKA. The algorithm takes a data graph, the first entityvs of an exploration path and
a set of knowledge anchors KADGas an input, and
identifies the closest knowledge anchor vKA KADG
with highest semantic similarity value to vs.
Algorithm I: Identifying Closest KADG Input: DGV,E,T, vsV, KADG{v1,v2,...,vi} Output: vKA – closest knowledge anchorwith highest semantic
similarity to vs
1. if vsKADG then // vs is a knowledge anchor
2. vKA:vs;
3. else // vs is NOT a knowledge anchor
4. S:{}; //list for storing similarity values
5. for allviKADG do //for all knowledge anchors
6. CA:{}; //list to store common ancestors of vs and vi
7. L:{}; //list for storing trajectory lengths
8. CAcommon_ancestors(vs,vi);
9. for allvcaCA //for all common ancestors 10. Llength(vca,vi); //length between vca and vi
11. end for;
12. vlca:vcawith least length in L; 13.
) ( )
( ( )
2
i s
lca v depth v depth
v depth S
;
14. end for;
15. vKA:viwith maximum similarity value in list S;
16. end if;
If the first entity vs belongs to the set of knowledge
anchors vs
KADG (line 1), then the first entity vs isidentified as the closest knowledge anchor vKA (line 2).
However, if the first entity vsdoes not belong to the set
of knowledge anchors (line 3), then the following steps are conducted:
-The algorithm initialises a list S to store semantic similarity values between vsand every knowledge
anchor vi
KADG (line 4).-For every knowledge anchor vi
KADG (line 5), thealgorithm initiates two lists: listCA for storing the common ancestors (i.e. common superclasses) of vs
and vi (line 6), and list
L
for storing the trajectorylengths between the common ancestors in list CA
and the knowledge anchor vi(line 7).
-The algorithm in (line 8) uses a function com-mon_ancestors(vs,vi) which retrieves all common
ancestors of vs and vi in the class hierarchy via the
following SPARQL, and stores them in list CA:
SELECT distinct ?common_ancestor
WHERE {
vs rdfs:subClassOf ?common_ancestor.