Int. J. Electrochem. Sci., 12 (2017) 8820 – 8831, doi: 10.20964/2017.09.08
International Journal of
ELECTROCHEMICAL
SCIENCE
www.electrochemsci.org
Direct Formation of Reduced Graphene Oxide and Graphene
Quantum dot Composites by Using Ascorbic Acid as
High-Performance Binder-Free Supercapacitor Electrodes
Yongjie Xu, Yukun Feng, Xinyu Li*, Guanghui Hu, Yi Luo, Lang Sun, Tao Tang, Jianfeng Wen, Heng Wang, and Ming Li*
College of Science & Ministry-province jointly-constructed cultivation base for state key laboratory of Processing for mom-ferrous metal and featured materials & Key Lab. of Nonferrous Materials and New Processing Technology, Guilin University of Technology, Guilin 541004, China.
*
E-mail: [email protected], [email protected]
Yongjie Xu and Yukun Feng contributed equally to this work.
Received: 25 May 2017 / Accepted: 29 June 2017 / Published: 13 August 2017
With unique structural features and hydrophilic functional groups, graphene quantum dots (GQDs) and graphene oxide (GO) are potential materials for supercapacitor electrodes. In this work, GQDs decorated with a GO hybrid and an interconnected nickel network are successfully fabricated and subjected to reduction treatment with ascorbic acid. GO and GQD composites (GO/GQDs) exhibit with different mass ratios of GO to GQDs (6:1, 3:1, 1:1) are also investigated. The specific capacitance (Csp) of the reduced GO (rGO)/GQD composites is higher than that of rGO. Among the composites with different mass ratios, the rGO/GQD composites with GO:GQDs=3:1 exhibit the highest electrochemical performance because the intercalation of GQDs into GO nanosheets can promote electron transportation and thus reduce the internal resistance and charge transfer resistance of the electrode. Additionally, the GQDs with large specific surface area can enhance the interfacial property among GO. It yields a Csp of 296 F g–1 at a current density of 0.5 A g–1 and 85% retention after 3,000 cycles of charge/discharge. Csp remarkably decreases when the mass ratio of GO to GQDs increases to 1:1 possibly because of blocked ion channels from a large amount of GQDs loaded on the GO surface.
Keywords: Graphene oxide quantum dots, Graphene oxide, Reduction, Supercapacitors, Composites
1. INTRODUCTION
increasing attention because of their longer cycle-life, higher power density, and more safty compare to lithium-ion battery.[1-7] Graphene-based materials are promising components for supercapacitors because of their unique electrical, chemical, and physical properties, such as high electrical conductivity and large surface area.[8-10] Pure carbon-based supercapacitors usually store charge through an electrochemical double-layer effect on an electrode surface.[11] For this application, reduced graphene oxide (rGO) nanosheets have been widely investigated because they can be cheaply produced from graphene oxides (GO) in a large scale. However, the intrinsic capacitance of as-prepared highly rGO is ≤100 F/g, which is below the expected theoretical value of 550 F/g.[12, 13] In practice, GO is directly used as a starting material, but the specific capacitance of graphene has been limited because of its restacking[14, 15] that inhibits electrolyte diffusion and decreases the surface area; as a result, supercapacitor performance is compromised.[16]
To explore the full potential of GO and enhance the electrochemical performance of graphene electrodes, we should place a spacer between chemically derived graphene sheets and thus minimize stacking and maximize the specific surface area.[17,18] “Stabilizers” or “spacers” have also been incorporated into graphene layers to inhibit the agglomeration of reduced graphene sheets. Wallace[19] proposed the use of polypyrrole (PPy) nanoparticles as spacers between graphene layers to generate free-standing films with high mechanical properties and large capacitance per area. Fan[20] prepared graphene or carbon black composites through ultrasonication and in-situ reduction of GO. As spacers, carbon black particles can inhibit graphene sheet agglomeration and consequently improve electrolyte– electrode accessibility. To an extent, energy density can be enhanced by incorporating pseudocapacitive materials, such as metal oxide nanoparticles, including RuO2, MnO2, Fe2O3, and
NiOx.[21-25] However, the high electrical resistance of transition metal oxides causes a poor rate
capability, and pseudocapacitive materials commonly exhibit poor stability and high resistance during charge/discharge process because of their relatively poor structural stability, active material loss, or excessive oxidative decomposition.[26]
materials used for supercapacitor electrodes show different electrochemical performance due to different preparation and reduction methods.[36-41]
In this study, GO was used as a graphene precursor to construct high-performance supercapacitors by utilizing well-functionalized single-crystalline GQDs with rich redox sites. GO can be easily dispersed in water because of its hydrophilic groups, such as carboxyl and carbonyl groups, attached on surfaces and edges.[42] GO can serve as a surfactant to disperse GQDs in water and consequently form GO/GQD suspension in the fabrication of electrodes. Once dried, GO can simultaneously form a membrane. As such, a binder is unnecessary to fabricate electrodes. To enhance conductivity and capacitance, we reduced the GO/GQD composites with ascorbic acid and investigated the composites with different mass ratios of GO to GQDs (6:1, 3:1, 1:1). The rGO/GQD-3:1 can deliver an ultrahigh specific capacitance of 296 F g–1 at a current density of 0.5 A g–1 and 85% capacity retention after 3,000 charge/discharge cycles. The resulting GQDs among the graphene sheets enlarge the interlayer spacing of graphene and prevent their agglomeration. The enlarged interlayer distance also enables the rapid transfer of electrolyte ions throughout the electrode material to improve the capacitance performance of this material.
2. EXPERIMENTAL
2.1 Preparation of materials
GO was prepared by a modified Hummers' method. GQDs was purchased from Nanjing JI Cang Nano Technoloyg Co., Ltd., China. Ni foam sheets(with a size of 2.5 cm × 1 cm × 0.1 cm) were carefully cleaned in hydrochloric acid to etch the surface oxide layer and remove contaminants, then was immersed in acetone to remove organic materials from the surface. Finally, it was washed with deionized water and absolute ethanol to make the Ni foam sheets more hydrophilic. A well-dispersed aqueous solution of GO was prepared by putting 30 mg of GO in 2 ml of deionized water by ultrasonication for 2 hours to open the layers of GO. Then the GO solution was mixed with GQDs (the mass of GO and GQDs in the rate of 6:1, 3:1, and 1:1) and stirred 5min. After that, the mixture was sonicated for 1 hour for the attachment of GQDs onto GO layers.
2.2 Synthesis of rGO/GQDs electrodes
2.3 Characterization
The morphological and microstructural details of the samples were examined by a field emission scanning electron microscopy (FE-SEM, S-4800) and transmission electron microscopy (TEM, JEM-2100F). The data of XPS were recorded on ESCALAB 250Xi to confirm the chemical bonding nature of the composite material.
2.4 Electrochemical Testing
The electrochemical performance of the GO/GQD electrodes were performed by cyclic voltammetry (CV), galvanostatic charge-discharge (GCD) and electrochemical impendence spectroscopy (EIS) in a two-electrode system using a CHI760E electrochemical workstation. Two identical electrodes were separated by a separator (NKK TF45, 40 μm). An aqueous solution of 6 M KOH was used as the electrolytes.
Specific capacitances Cs (F g−1) can be calculated from the discharge processes using the
following formula:
(1)
where I is the discharge current (A), Δt is the discharge time (s), m is the total mass of both electrodes (g), and ΔV is the voltage range (V).
Energy and power density are two important parameters for measuring the practical application of as-made supercapacitors. The energy density E (Wh kg−1) and power density P (W kg−1) of the symmetric supercapacitors were calculated by charge/discharge curves based on the following formulas:
(2) (3) Where Δt is the discharge time (h).
3. RESULTS AND DISCUSSION
3.1 Characterization of rGO/GQD composites
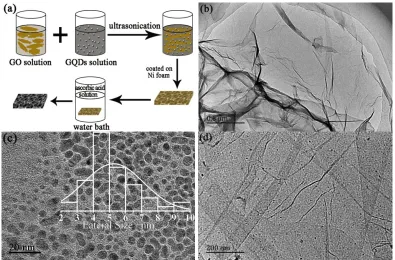
The morphological characteristics and nanostructures of the as-synthesized graphene-based materials are described through scanning electron microscopy (SEM) and transmission electron microscopy (TEM). The results are presented in Fig. 1. It is seen that rGO is consisted of several layers of interconnected graphene sheets with a prominently crumpled and wrinkled nanosheets morphology (Fig. 1b), which is derived from the high-oxygen-containing groups on the surface of GO tightly bound to residual H2O molecules.[43] In the TEM image of GQDs (Fig. 1c), uniform GQDs with sizes of less
Figure 1. (a) Schematic diagram of the process for fabricating electrodes. (b)-(d) TEM images of GO,
GQDs and rGO/GQDs-(3:1).
1000 1500 2000 2500 (a)
G D
In
te
n
si
ty
(
a
.u
.)
Raman shift (cm-1)
rGO/GQDs(1:1) rGO/GQDs(3:1)
rGO/GQDs(6:1)
GO
280 284 288 292 296
(b)
In
te
n
si
ty
(
a
.
u
.)
Binding energy (eV)
C=C C-O
C=O O-C=O
280 284 288 292 296
(c)
O-C=O C=O C-O C=C
In
te
n
si
ty
(
a
.
u
.)
Binding energy (eV)
280 284 288 292 296
In
te
n
si
ty
(
a
.
u
.)
Binding energy (eV)
[image:5.596.115.499.412.682.2]O-C=O C=O C-O C=C (d)
Figure 2. (a) Raman spectra of GO, rGO/GQDs-6:1, rGO/GQDs-3:1, and rGO/GQDs-1:1. (b), (c) and
(d) High resolution C1s XPS spectra of GO, rGO and rGO/GQDs-3:1.
through covalent chemical bonding and van der Waals force. GQDs can prevent the aggregation of GO nanosheets and thus increase the number of ion channels in the interior of materials.[44]
The defective nature of the samples is reflected in the Raman spectra. In Fig. 2a, all of the samples possess two main peaks, which are assigned to D band at approximately 1349 cm–1 attributed to the structural defects of carbon and G band at around 1594 cm–1 ascribed to the in-plane vibrations of sp2 carbon atoms.[45] The ID/IG ratio of GO is 0.88, which indicates a relatively low graphitized GO
because of the presence of oxygen-containing functional groups. Compared with the ID/IG ratio of GO,
the increased ID/IG ratio of rGO (1.02) demonstrates the formation of structural defects after GO is
electrochemically reduced. The introduced defects can significantly increase the surface area of graphene and thus improve supercapacitive performance of the activated graphene. In addition, the ID/IG ratio of rGO/GQD-3:1 composite is 1.06, which is slightly higher than that of rGO (1.02). This
finding clearly suggests that the loading GQDs on the GO sheets can increase the number of defects or edges and the randomness of graphene sheets.
The surface chemical identification of GO, rGO, and rGO/GQD-3:1 is performed through X-ray photoelectron spectroscopy. Figures 2b, c, and d illustrate the high-resolution C 1s spectra of GO, rGO, and rGO/GQD-3:1, respectively. The spectrum of GO can be deconvoluted into four peaks located at approximately 284.6, 286.7, 287.6, and 288.4 eV that correspond to sp2-hybridized graphitic carbon (C=C), carbon in C–O bonds, carbonyl carbon (C=O), and carboxyl carbon (O–C=O), respectively. After reduction reaction and carbonization are facilitated by ascorbic acid aqueous solution, the oxygen-containing functional groups are reduced significantly.[46] The proportion of C=C peak of rGO/GQD-3:1 is higher and its percent values of C=O, C−O, and O−C=O peaks are lower than those of pure rGO. The reduction effect is greatly improved because of the addition of GQDs.
3.2 Electrochemical performance of rGO/GQDs
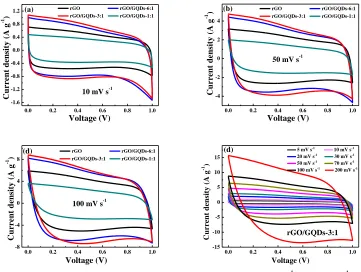
composed of abundant functional groups that can repair GO defects when GQDs are anchored on the surface of GO. The area surrounded by the CV curves of rGO/GQD-1:1 is the smallest among the observed areas, and this finding implies that large amounts of GQDs are loaded on the GO surface and consequently form an electrolyte ion block; thus, the sample possesses less pore volume.[50] The electrode surface is blocked, and it subsequently exhibits slow heterogeneous electron transfer kinetics because of the low edge/basal plane ratio; in addition, poor electrochemical performance is observed.[51] In Figure 3d, the CV curves of the rGO/GQD-3:1 symmetric supercapacitor maintain a typical rectangular form when the scan rate increases from 5 mV s–1 to 200 mV s–1, and this result suggests a low equivalent series resistance and an ideal capacitive behavior.
0.0 0.2 0.4 0.6 0.8 1.0
-1.6 -1.2 -0.8 -0.4 0.0 0.4 0.8 1.2
10 mV s-1
C u rr en t d en si ty ( A g -1 ) Voltage (V)
(a) rGO rGO/GQDs-6:1
rGO/GQDs-3:1 rGO/GQDs-1:1
0.0 0.2 0.4 0.6 0.8 1.0
-4 -2 0 2 4
50 mV s-1
C u rr en t d en si ty ( A g -1 ) Voltage (V)
(b) rGO rGO/GQDs-6:1
rGO/GQDs-3:1 rGO/GQDs-1:1
0.0 0.2 0.4 0.6 0.8 1.0
-8 -4 0 4 8
100 mV s-1
C u rr en t d en si ty ( A g -1 ) Voltage (V)
(d) rGO rGO/GQDs-6:1
rGO/GQDs-3:1 rGO/GQDs-1:1
0.0 0.2 0.4 0.6 0.8 1.0
-15 -10 -5 0 5 10 15 rGO/GQDs-3:1 C u rr en t d en sit y ( A g -1 ) Voltage (V)
5 mV s-1
10 mV s-1
20 mV s-1
30 mV s-1
50 mV s-1
70 mV s-1
100 mV s-1
200 mV s-1
[image:7.596.112.473.253.525.2](d)
Figure 3. (a)-(c) CV curves of four electrodes at scan rates of 10 mV s-1, 50 mV s-1, and 100 mV s-1.
(d) CV curves of rGO/GQDs-3:1 electrode at different scan rates in 6 M KOH.
0 50 100 150 200 250 300 350
0.0 0.2 0.4 0.6 0.8 1.0
0.5 A g-1
(a) V o lt a g e (V ) Time (s) rGO rGO/GQDs-6:1 rGO/GQDs-3:1 rGO/GQDs-1:1
0 20 40 60 80 100 120 140 160
0.0 0.2 0.4 0.6 0.8 1.0
1 A g-1
(c) V o lt a g e (V ) Time (s) rGO rGO/GQDs-6:1 rGO/GQDs-3:1 rGO/GQDs-1:1
0 10 20 30 40 50 60 70
0.0 0.2 0.4 0.6 0.8 1.0
2 A g-1
rGO rGO/GQDs-6:1 rGO/GQDs-3:1 rGO/GQDs-1:1 (c) V o lt a g e (V ) Time (s)
0 50 100 150 200 250 300 350
0.0 0.2 0.4 0.6 0.8 1.0 rGO/GQDs-3:1
(d) 0.5 A g-1
1 A g-1 2 A g-1 3 A g-1 5 A g-1 10 A g-1
[image:8.596.119.473.82.346.2]V o lt a g e (V ) Time (s)
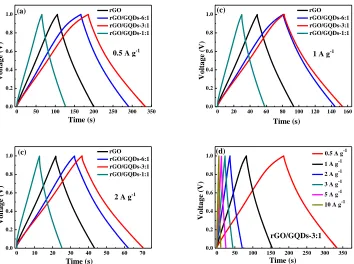
Figure 4. (a)-(c) GCD curves of four electrodes at current densities of 0.5 A g-1, 1 A g-1, and 2 A g-1.
(d) GCD curves of rGO/GQDs-3:1 electrode at different current densities in 6 M KOH.
No evident IR drop is observed at the start of all discharge curves, and this observation indicates that all of the devices possess low internal series resistance[23, 52] and efficient stored energy extraction. This finding is also confirmed by the linear and symmetrical charge–discharge curves.[53] These superior electrochemical behaviors can be attributed to a large number of active sites provided by the quantum size of graphene particles with high surface areas, which undoubtedly are favorable for the high capacitance. Moreover, the agglomeration of graphene nanosheets can be effectively inhibited by the introduction of GQDs. GQD-anchored graphene nanosheet structure can shorten the transport pathways for electrons and ions and thus accelerate electrochemical kinetics to enhance the capacity retention of rGO/GQD composites.[54]
0 2 4 6 8 10
0 50 100 150 200 250
300(a) rGO
rGO/GQDs-6:1 rGO/GQDs-3:1 rGO/GQDs-1:1 S p ec if ic c a p a cit a n ce ( F g -1 )
Current density (A g-1)
2 4 6 8 10 12
0 1000 2000 3000 4000 5000(b) P o w er d en sit y ( W k g -1)
Energy density (Wh kg-1)
rGO rGO/GQDs-6:1 rGO/GQDs-3:1 rGO/GQDs-1:1
Figure 5. (a) specific capacitance of four electrodes at different current densities. (b) Ragone plot of
[image:8.596.115.472.567.685.2]
In Fig. 5a, the specific capacitances calculated from the discharge curves ranging from 0.5 A g–
1
to 10 A g–1 of these samples show trends similar to those of the CV curves. The curves also reveal that the highest specific capacitance of 296 F g–1 at 0.5 A g–1 is observed in rGO/GQD-3:1, and this value is much higher than that of rGO (196 F g–1) and rGO/GQD-3:1 (123 F g–1) at the same rate. The high discharge capacitance of the rGO/GQD-3:1 electrode may be attributed to the appropriate loading of GQDs on graphene nanosheets. The other reason relies on the fact that ultra-small sized GQDs have larger specific surface area and will bring abundant interfaces into GO/GQDs composites, which can provide more surface area for access of electrolyte ions.[55] At a higher current density, electrolyte ions reach only the exterior surface of electrodes, and the accessible surface area of ions is shortened as the current density increases; as a result, the gravimetric specific capacitance of the samples decreases as the current densities increase.[56] Figure 5b presents the Ragone plot of the samples in 6 M KOH. The maximum energy density and power density of rGO/GQD-3:1 are approximately 10.3 Wh kg–1 and 5 kW kg–1 according to Eqs. (2) and (3), respectively. This result is in accordance with that shown in Fig. 5a.
0 20 40 60 80 100
0 10 20 30 40 50 60 70
0.4 0.6 0.8 1.0 1.2 1.4 1.6 1.8 2.0 0.0 0.1 0.2 0.3 0.4 0.5 0.6 0.7 (a) -Z '' ( o h m ) Z' (ohm)
rGO rGO/GQDs-6:1
rGO/GQDs-3:1 rGO/GQDs-1:1
-Z '' (o h m ) Z' (ohm)
0 500 1000 1500 2000 2500 3000
0 20 40 60 80 100(b) C a p a cit a n ce r et en tio n ( % ) Cycle number rGO rGO/GQDs-6:1 rGO/GQDs-3:1
rGO/GQDs-1:1 3 A g-1
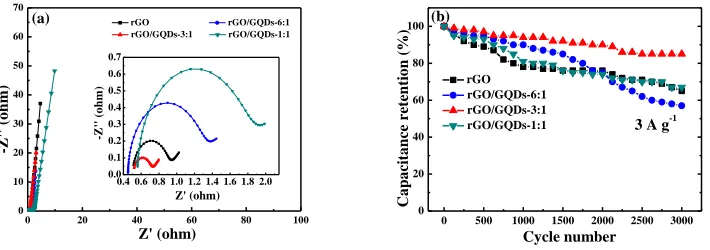
Figure 6. (a) Nyquist plots of four electrodes at a frequency rang from 100 mHz to 100 kHz. (b)
Cycling stability of four electrodes obtained from GCD curves at 3 A g-1 for 3,000 circles.
[image:9.596.120.475.335.460.2]
electrode kinetics of GQDs is much slower than that of GO as if the electrode surface is completely blocked mainly because of the increasing number of oxygen-containing groups that prevent electron transfer.[59] The slope of the 45° portion of the curve is called Warburg resistance and is a result of the frequency dependence of ion diffusion in the electrolyte to the electrode interface. The Warburg-type line is short and inclined toward a vertical line, and this characteristic reveals a short ion diffusion pathway and the purely capacitive behavior of rGO/GQD-3:1 electrodes.[60]
The cycling stability and capacitance retention of electrodes are examined by performing a GCD test at 3 A g−1 (Fig. 6b). After 3,000 cycles are completed, rGO/GQD-3:1 electrode retains 85% of its initial capacitance, which is higher than those of the other electrodes and indicative of good cycling stability.[61,62]
4. CONCLUSION
In summary, binder-free supercapacitors are successfully developed by using GQD-anchored graphene nanosheets. In this structure, GQDs function as a spacer that prevents the restacking of graphene layers. GQD networks in hybrid nanomaterials enhance the accessibility of the charged ions and thus facilitate charge transport and ionic motion during charge/discharge processes in supercapacitors. With the combined advantages of GO and GQDs, the as-prepared rGO/GQD-3:1 composite electrodes yield an excellent gravimetric specific capacitance of 296 F g–1 at 0.5 A g–1 and retains 85% of their initial capacitance after 3,000 cycles. These values indicate that their electrochemical performance is superior to those of the rGO/GQD-1:1 electrodes. These results suggest that the appropriate mass loading and morphological characteristics of GQDs on graphene nanosheets are important factors to obtain a high capacitance performance. This report presents a simple and easy method to design and synthesize graphene-based composites for high-performance supercapacitor materials and other energy-storage devices. Above all, the advantages induced by incorporation of GQDs into the hybrid electrode materials provides a new pathway to design and synthesis high-performance supercapacitors materials.
ACKNOWLEDGEMENTS
This work was financially supported by National Natural Science Foundation of China (51662004, 11364010, 11304051, 11404072, 11604061, 11664007), Natural Science Foundation of Guangxi Zhuang Autonomous Region of China (2014GXNSFBA118021, 2014GXNSFBA118014, 2015GXNSFBA139002, 2015GXNSFAA139016). Authors acknowledge Prof. Yanwei Li (College of Chemistry and Bioengineering, Guilin University of Technology, Guilin 541004, China.) and Xin Fan (College of Materials Science & Engineering, Guilin University of Technology, Guilin 541004, China.) for experimental help and valuable discussions. Conflict of interests: The authors declare no conflict of interests.
References
2. J.W. Yang, B. Yan, J. Ye, X. Li, Y.S. Liu, H.P. You, Phys. Chem. Chem. Phys., 16 (2014) 2882-2889.
3. J.W. Yang, B. Yan, J. Ye, X. Li, Rare Metal Mat. Eng., 44(1) (2015) 225-260.
4. Q.Q. Chen, T.T. Zhang, X.C. Qiao, D.Q. Li, J.W. Yang, J. of Power Sources, 234 (2013) 197-200. 5. Y.P. Song, H. Wang, Z.H. Li, N.Q. Ye, L.J. Wang, Y. Liu, RSC Adv., 5 (2015) 16386-16393. 6. Y.P. Song, H. Wang, Z.H. Li, N.Q. Ye, L.J. Wang, Y. Liu, Int. J. Hydrogen Energ., 9 (2015)
3613-3623.
7. Y.W. Li, J.H. Yao, Y.X. Zhu, Z.G. Zou, H.B. Wang, J. of Power Sources, 203 (2012) 177-183. 8. C. Liu, Z. Yu, D. Neff, A.Zhamu, B.Z. Jang, Nano Lett., 10 (2010) 4863-4868.
9. Y. Wang, Z.Q. Shi, Y. Huang, Y.F. Ma, C.Y. Wang, M.M. Chen, Y.S. CHEN, J. Mater. Chem. C, 113 (2009) 13103.
10.W. Yang, M. Ni, X. Ren, Y. Tian, N. Li, Y. Su, X. Zhang, Curr. Opin. Colloid In., 20 (2015) 416-428.
11.Y.W. Zhu, S. Murali, M.D. Stoller, K.J. Ganesh, W.W. Cai, P.J. Ferreira, A. Pirkle, R.M. Wallace, K.A. Cychosz, M. Thommes, D. Su, E.A. Stach, R.S. Ruoff, Science, 322 (2011) 1537.
12.C.-M. Chen, Q. Zhang, X.-C. Zhao, B. Zhang, Q.-Q. Kong, M.-G. Yang, Q.-H. Yang, M.-Z. Wang, Y.-G. Yang, R. Schlögl, D.S. Su, J. Mater. Chem., 22 (2012) 14076.
13.Z. Li, P. Qin, L. Wang, C. Yang, Y. Li, Z. Chen, D. Pan, M. Wu, Electrochim. Acta, 208 (2016) 260-266.
14.B. Unnikrishnan, C.-W. Wu, I.W.P. Chen, H.-T. Chang, C.-H. Lin, C.-C. Huang, ACS Sustain. Chem. & Eng., 4 (2016) 3008-3016.
15.L. Liu, J. Lang, P. Zhang, B. Hu, X. Yan, ACS appl. Mater. & interfaces, 8 (2016) 9335-9344. 16.Y. Huang, J. Liang, Y. Chen, Small, 8 (2012) 1805-1834.
17.X. Fan, Z.W. Yang, Z. Liu, Chinese J. Chem., 34(1) (2016) 107-113. 18.X. Fan, Z.W. Yang, Z. Liu, RSC Adv., 5(20) (2015) 15096-15102.
19.Y. Li, G. Louarn, P.-H. Aubert, V. Alain-Rizzo, L. Galmiche, P. Audebert, F. Miomandre, Carbon, 105 (2016) 510-520.
20.J. Yan, T. Wei, B. Shao, F. Ma, Z. Fan, M. Zhang, C. Zheng, Y. Shang, W. Qian, F. Wei, Carbon, 48 (2010) 1731-1737.
21.S. Chen, J. Zhu, X. Wu, Q. Han, X. Wang, ACS Nano, 4 (2010) 2822-2829.
22.Y. Zhu, X. Ji, C. Pan, Q. Sun, W. Song, L. Fang, Q. Chen, C.E. Banks, Energy & Environ. Sci., 6 (2013) 3665.
23.R. Li, X. Ren, F. Zhang, C. Du, J. Liu, Chem. Commun., 48 (2012) 5010-5012.
24.Y. Li, H. Zhang, S. Wang, Y. Lin, Y. Chen, Z. Shi, N. Li, W. Wang, Z. Guo, J. Mater. Chem. A, 4 (2016) 11247-11255.
25.R. Kumar, A. Agrawal, R.K. Nagarale, A. Sharma, J. Phys. Chem. C, 120 (2016) 3107-3116. 26.P. Asen, S. Shahrokhian, J. Phys. Chem. C, 121 (2017) 6508.
27.Y.-Q. Dang, S.-Z. Ren, G. Liu, J. Cai, Y. Zhang, J. Qiu, Nanomaterials, 6 (2016) 212. 28.F.Y. Shao, M. Li, J.W. Yang, Y.P. Liu, J. Nano Res-SW, 30 (2015) 78-85.
29.M. Dinari, M.M. Momeni, M. Goudarzirad, Surf. Eng., 32 (2015) 535-540. 30.J. Luo, H.D. Jang, J. Huang, ACS Nano, 7 (2013) 1464-1471.
31.W.-W. Liu, Y.-Q. Feng, X.-B. Yan, J.-T. Chen, Q.-J. Xue, Adv. Fun. Mater., 23 (2013) 4111-4122. 32.A. Ben Gouider Trabelsi, F.V. Kusmartsev, D.M. Forrester, O.E. Kusmartseva, M.B. Gaifullin, P.
Cropper, M. Oueslati, J. Mater. Chem. C, 4 (2016) 5829-5838.
33.X. Zhou, S. Guo, P. Zhong, Y. Xie, Z. Li, X. Ma, RSC Adv., 6 (2016) 54644-54648. 34.K. Lee, H. Lee, Y. Shin, Y. Yoon, D. Kim, H. Lee, Nano Energy, 26 (2016) 746-754. 35.S. Zhang, Y. Li, H. Song, X. Chen, J. Zhou, S. Hong, M. Huang, Sci. Rep., 6 (2016) 19292.
36.W. K. Chee, H. N. Lim, Z. Zainal, N. M. Huang, I. Harrison, and Y. Andou, J. Phys. Chem. C, 120 (2016) 4153−4172.
Chan Jun, Nanoscale, 7 (2015) 6999–7021.
38.Zhibin Lei, Jintao Zhang, Li Li Zhang, Nanjundan Ashok Kumar and X. S. Zhao,Energy Environ. Sci., 9 (2016) 1891-1930.
39.Guanqxun Zhang, Xiao Xiao, Bing Li, Peng Gu, Huaiquo Xue and Huan Pang,J. Mater. Chem. A,
5 (2017) 8155-8186.
40.Xu Du, Zhe Zhang, Wei Liu and Yulin Deng, Nano Energy, 35 (2017) 299-320.
41.Yongjie Xu, Xinyu Li, Guanghui Hu, Ting Wu, Li Luo, Lang Sun, Tao Tang, Jinfeng Wen, Heng Wang and Ming Li, Appl. Surf. Sci., 422C (2017) 847-855.
42.R. Kumar, R.K. Singh, A.R. Vaz, R. Savu, S.A. Moshkalev, ACS appl. Mater. & interfaces, 9 (2017) 8880-8890.
43.S.-Y. Yang, K.-H. Chang, H.-W. Tien, Y.-F. Lee, S.-M. Li, Y.-S. Wang, J.-Y. Wang, C.M. Ma, C.-C. Hu, J. Mater. Chem., 21 (2011) 2374-2380.
44.A.K. Samantara, S. Chandra Sahu, A. Ghosh, B.K. Jena, J. Mater. Chem. A, 3 (2015) 16961-16970. 45.X. Li, T. Tang, M. Li, X. He, J Mater. Sci: Mater. Electron., 26 (2015) 1770.
46.X. Li, T. Tang, M. Li, X. He, Appl. Phys. Lett., 106 (2015) 013110. 47.E. Frackowiak, F. Beguin, Carbon, 39 (2000) 937-950.
48.Y. Hu, Y. Zhao, G. Lu, N. Chen, Z. Zhang, H. Li, H. Shao, L. Qu, Nanotechnology, 24 (2013) 195401.
49.J. Bae, U. Paik, D. Kee Yi, Mater. Lett., 162 (2016) 230-234.
50.V.B. Kumar, A. Borenstein, B. Markovsky, D. Aurbach, A. Gedanken, M. Talianker, Z. Porat, J. Phys. Chem. C, 120 (2016) 13406-13413.
51.Y. Li, X. Wang, Q. Yang, M.S. Javed, Q. Liu, W. Xu, C. Hu, D. Wei, Electrochim. Acta, 234 (2017) 63-70.
52.J. Shen, A. Liu, Y. Tu, G. Foo, C. Yeo, M.B. Chan-Park, R. Jiang, Y. Chen, Energy & Environ. Sci., 4 (2011) 4220.
53.Q. Chen, Y. Hu, C. Hu, H. Cheng, Z. Zhang, H. Shao, L. Qu, Phys. Chem. Chem. Phys., 16 (2014) 19307-19313.
54.M. Jing, C. Wang, H. Hou, Z. Wu, Y. Zhu, Y. Yang, X. Jia, Y. Zhang, X. Ji, J. of Power Sources, 298 (2015) 241-248.
55.X. Zhang, J. Wang, J. Liu, J. Wu, H. Chen, H. Bi, Carbon, 115 (2017) 134-146.
56.Y. Huang, A. Gao, X. Song, D. Shu, F. Yi, J. Zhong, R. Zeng, S. Zhao, T. Meng, ACS appl. Mater. & interfaces, 8 (2016) 26775-26782.
57.Y. Wang, Z.Q. Shi, Y. Huang, Y.F. Ma, C.Y. Wang, M.M. CHEN, Y.S. CHEN, J. Phys. Chem. C, 113 (2009) 13103-13105.
58.X.-D.Z. Li-Feng Chen, Hai-Wei Liang, Mingguang Kong, Qing-Fang Guan, Ping Chen, Zhen-Yu Wu, and Shu-Hong Yu, ACS Nano, 6(8) (2012) 7092-7102.
59.X. Jia, X. Ji, RSC Adv., 5 (2015) 107270-107275.
60.S.-M. Li, S.-Y. Yang, Y.-S. Wang, H.-P. Tsai, H.-W. Tien, S.-T. Hsiao, W.-H. Liao, L. Chang, C.-C.M. Ma, C.-C. Hu, J. of Power Sources, 278 (2015) 218-229.