Int. J. Electrochem. Sci., 13 (2018) 8995 – 9006, doi: 10.20964/2018.09.66
International Journal of
ELECTROCHEMICAL
SCIENCE
www.electrochemsci.org
Effect of Al
2O
3Particle Concentration on the Characteristics of
Microarc Oxidation Coatings Formed on Pure Titanium
Ping Wang*, Jun Pu, Jia Hao Zhou, Wen Jie Cao, You Tao Xiao, Ze Yu Gong, Jie Hu
College of Materials Science and Engineering, Southwest Petroleum University, Chengdu, 610500, China
*
E-mail: [email protected]
Received: 4 May 2018 / Accepted: 5 July 2018 / Published: 5 August 2018
Microarc oxidation coatings were successfully fabricated on pure titanium substrates by microarc oxidation (MAO) in electrolytes with Al2O3 particles of varying concentrations, which ranged from 0
to 4 g·L-1 (0, 1, 2, 3, 4 g·L-1). The voltage versus time curves, surface and cross-sectional morphologies, thicknesses, microhardnesses, phase compositions, coating adhesive strengths, thermal shock resistances and polarization curves of MAO coatings were investigated. The results revealed that the voltage, the microhardness and the thickness of the coatings increased with the addition of Al2O3
particles. Both the number and size of sintered discs on the coating surface increased gradually with the ascending concentration of Al2O3 particles. The XRD results indicated that the MAO coatings
mainly consisted of α-Al2O3, SiO2 and rutile. The corrosion resistance of the coatings was improved,
while the addition of Al2O3 particles had less effect on the adhesive strength of the MAO coatings.The
study revealed that an appropriate addition of Al2O3 particles in electrolytes is beneficial to promote
the performance of coatings..
Keywords: Microarc oxidation; Pure titanium; Al2O3 particles; Performance
1. INTRODUCTION
working temperature of pure titanium is generally below 300°C[4], and thus its high-temperature performance is inferior, which restricts titanium alloys from even wider application. Microarc oxidation (MAO), also referred to as plasma electrolytic oxidation (PEO), has been considered one of the most cost-saving and environmentally friendly technology to fabricate MAO coatings on the surface of valve metals, such as aluminum, magnesium and titanium, as well as their respective alloys[5-8]. The properties of MAO coatings are controlled by electrolytes, process parameters (such as current density, voltage, pulse frequency and duty cycle), substrate materials, etc.[9-11]. Different additives are added to base electrolytes to dope MAO coatings, which has been identified as an excellent method to modulate the properties of MAO coatings[12-13]. In recent reports, it was found that SiC[14], ZrO2[15] and TiO2[16] additives were incorporated in the formation of MAO coatings.
There are already a few studies examining the effect of Al2O3 particle addition on MAO coatings.
Yan[17] found that the corrosion resistance of coatings formed on AZ91D Mg alloy improved with the addition of Al2O3 micropowder, and Al2O3 particles were beneficial to the fast formation of the oxide
layer. Ping[18] noted that increasing the Al2O3 micropowder concentration reduced the size of
micropores on 6061 aluminum alloy coating surface, and the coating surface became smooth. However, the influence of doping Al2O3 particles on TA2 pure titanium was never reported.
In this investigation, MAO coatings were fabricated on pure titanium substrates at different Al2O3 particle concentrations in Na2SiO3-NaOH electrolyte system. In addition, the effect of Al2O3
particle concentration in the electrolytes on the voltage, surface and cross-sectional morphologies, surface microhardness, coating thickness, phase composition, coating adhesive strength, thermal shock resistance and corrosion resistance of MAO coatings on pure titanium materials was investigated, and the doping mechanism of Al2O3 particles was also discussed.
2. MATERIALS AND METHODS
2.1. Preparation of MAO coating
Rectangular samples of TA2 pure titanium (with chemical composition by wt%: Fe≤0.30%, C≤0.10%, O≤0.25%, N≤0.05%, H≤0.015% and Ti balance) were used as substrate materials in the experiments. The specimens, with dimensions of 15×15×2 mm, were polished and degreased before the MAO process. The base electrolyte consisted of 18 g·L-1 Na2SiO3, 1 g·L-1 NaOH and 3 ml·L-1
C3H8O3. The resin was used to mount the samples to observe cross-sectional morphologies. The
concentration of Al2O3 particles in the base electrolyte was 0 g·L-1, 1 g·L-1, 2 g·L-1, 3 g·L-1, and 4 g·L -1
. In addition, the Al2O3 particles with an approximate size of 10-40 μm were stirred continuously
2.2. Coating analysis
The surface and cross-sectional morphologies of MAO coatings in the electrolytes with different concentration of Al2O3 particles were observed by a Scanning Electron Microscope (SEM,
ZEISS EVO MA15) equipped with an Energy Dispersive Spectrometer (EDS, OXFORD 20). The phase composition of the coatings was investigated by X-ray Diffraction (XRD, DX-2700B). Diffraction data were acquired over scattering angle 2θ from 10° to 80°, and the scanning speed was 0.05°·s-1. Scratch tests, which could evaluate the adhesion between coatings and substrate, were implemented by multifunctional surface performance tester (MFT-4000) with automatic loading from 0–20 N at a loading rate of 10 N·min-1. In addition, thermal shock tests of the coatings were investigated by using a chamber electric furnace (SX-10-12), which was heated to 300°C for 10 min and then cooled down in 25°C water for 50 cycles. The microhardness and thickness of the coatings were detected by digital microhardness tester (HVS-1000) at 1 N for 15 s and a Digital Thickness Gauges (TT230), respectively. Furthermore, an Electrochemical Workstation (IM6, Netherlands) was used to acquire polarization curves in 3.5% NaCl solution at room temperature. The polarization curve scanning rate was 1.5 mV·s-1 with a potential range from -1.0 V to -0.4 V.
3. RESULTS AND DISCUSSION
3.1. Voltage-time response
0 5 10 15 20 25 30
0 100 200 300 400 500
(a)
Voltage (V)
Time (min)
0 g·L-1
1 g·L-1
2 g·L-1
3 g·L-1
4 g·L-1
5 10 15 20 25 30
340 360 380 400 420 440 460
(b)
0 g·L-1
1 g·L-1
2 g·L-1
3 g·L-1
4 g·L-1
Voltage (V)
Time (min)
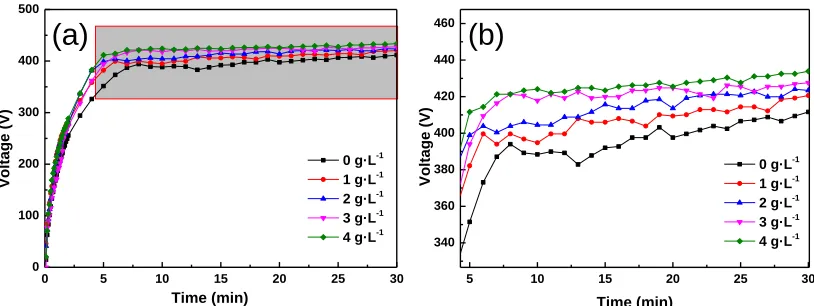
Figure 1. Voltage-time curves at different concentrations of Al2O3 particles: (a) original drawing, (b)
enlarged drawing
Fig. 1 shows the corresponding voltage response of different Al2O3 particles concentrations
during the MAO process. It can be observed that the voltage increased gradually with the increase of Al2O3 particles concentration, and the maximal voltage was approximately 430V at the Al2O3 particles
[image:3.596.94.501.434.587.2]
movement of Al2O3 particles towards the anode, and the Al2O3 particles were adsorbed gradually on
the surface of the specimen through the combined effects of the electric field and mechanical stirring. The Al2O3 particles that were adsorbed on the coating surface heightened the resistance of the
coatings, which caused the voltage of the coatings to consequently increase in accordance with Ohm’s Law.
3.2. The surface and cross-sectional morphologies of coatings
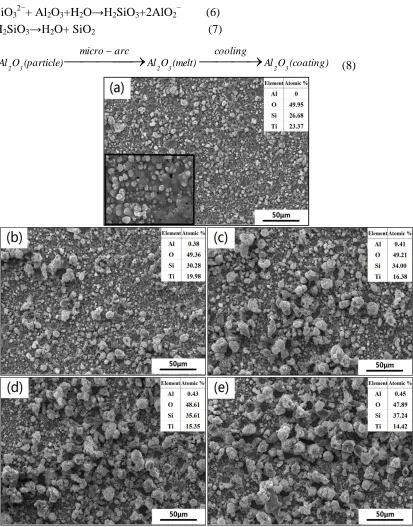
Fig. 2 represents the surface morphologies and major element content of MAO coatings at different Al2O3 particles concentrations. The coating surface was relatively smooth, and it was
accompanied by small holes when no Al2O3 particles were added, as shown in Fig. 2(a). While the size
and number of sintered discs increased gradually with the ascending concentration of Al2O3 particles,
as shown in Fig. 2(b)-(e), the number of holes decreased. The increased number of sintered discs on the surface of the MAO coatings with adding Al2O3 particles was ascribed to the rise of voltage, which
led to higher energies in individual discharge channels during MAO processing. Yan[17] also found that, after adding Al2O3 particles, the hole size and the roughness of coatings on AZ91D Mg alloys
increased due to the rising energy. The temperature of micro areas boosted to 103-104 K[19] during the spark discharge process, which was sufficient to melt both the micro areas of the coatings and the adsorbed Al2O3 particles. The melted Al2O3 particles filled up the discharge channels, which reduced
the number of holes and enhanced the hardness of the coatings. With the further addition of Al2O3
particles, more energy was obtained owing to the anabatic voltage, which indicated that discharge breakdown was more likely to come up, and then the substrate was ejected easily through the discharge channels to form more sintered discs. As a consequence, the number of sintered discs increased and the number of holes decreased. Fig. 2(a)-(e) also exhibits the major elemental content of the MAO coatings. It is obvious that the content of Al and Si increased, the content of O had very little change, and the content of Ti reduced gradually with the addition of Al2O3 particles. Apparently, the Si and Al
were from the electrolyte solution, which demonstrated that Al2O3 particles were involved in the
formation of the MAO coatings; this influenced the reaction between the electric arcs and the substrate, which gave rise to the change of elemental content in the coatings. In addition, the voltage increased with the increase of Al2O3 particles, and the thickness of the coatings grew gradually. Thus,
the elements in the electrolyte solution were easier to enter into the coatings, whereas it was more difficult for the substrate Ti to transmit to the coating surface owing to the thickening of coatings. Therefore, the content of Al and Si showed a relatively upward trend, but the content of Ti ultimately decreased with the addition of Al2O3 particles. The possible reactions during MAO process are as
follows[18, 20]:
H2O→H++OH− (1)
2OH−→O2−+ H2O (2)
Ti→Ti4+
+4e− (3) Ti4++2OH−+2H2O→TiO2+2H3O+ (4)
SiO32−+ Al2O3+H2O→H2SiO3+2AlO2− (6)
H2SiO3→H2O+ SiO2 (7)
(coating) O
Al cooling (melt)
O Al arc micro (particle)
O
Al2 3
2 3
2 3
[image:5.596.92.505.69.596.2](8)
Figure 2. Surface morphologies and element content of MAO coatings with different concentration of
Al2O3 particles: (a) 0 g·L-1, (b) 1 g·L-1, (c) 2 g·L-1, (d) 3 g·L-1 and (e) 4 g·L-1.
Cross-sectional microstructures of MAO coatings with different concentrations of Al2O3
particles were prepared by resin, as shown in Fig. 3, and the oxidation coating was embedded between the resin and the pure titanium substrate. It is clear that the thickness of the MAO coatings demonstrated a rising tendency with ascending concentrations of Al2O3 particles. More energy was
Although there were some cracks caused by thermal shrinkage of the resin between the coatings and the resin, the combination between the coatings and the substrate was relatively compact.
0 2 4 6 8
0 20 40 60 80 100 120 140 160 180 200
Al
1g·L-1
Cou
nt
s
Distance (μm)
0 2 4 6 8 10 12 14 16 0
20 40 60 80 100 120 140 160 180 200
Al
2g·L-1
Cou
nt
s
Distance (μm)
0 4 8 12 16 0
20 40 60 80 100 120 140 160 180 200
Cou
nt
s
Distance (μm)
0 2 4 6 8 10 12 14 16 18 0 20 40 60 80 100 120 140 160 180 200 Cou nt s Distance (μm) Al 4g·L-1
Figure 3. Cross-sectional images and Al element distribution of MAO coatings with different concentrations of Al2O3 particles: (a) 0 g·L-1, (b) 1 g·L-1, (c) 2 g·L-1, (d) 3 g·L-1 and (e) 4 g·L-1.
3.3. The microhardness and thickness of coatings
0 1 2 3 4
0 50 100 150 200 250 300 350 400 450 500 Mic roha rdne ss ( kg ·mm -2 )
Al2O3 particles concentration (g·L-1)
Thickness Microhardness 4 6 8 10 12 14 16 18 20 22 24 Th ickn es s (μm)
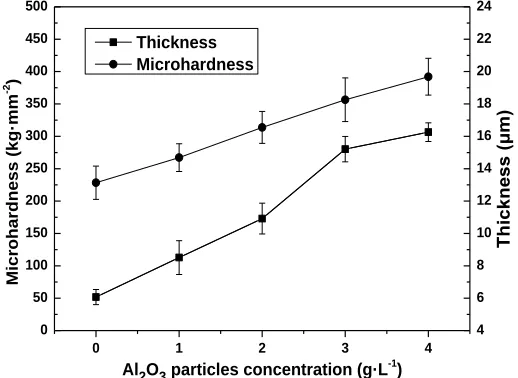
Figure 4. The microhardness and thickness of MAO coatings prepared with different Al2O3 particles
concentrations
Microhardness and thickness tests were carried out on specimens prepared at different Al2O3
particles concentrations, which are depicted in Fig. 4. The substrate hardness of pure titanium is only 160.1 HV, while the hardness of MAO coating without Al2O3 particles is approximately 228.4 HV.
The hardness of all the MAO coatings with Al2O3 particles is much higher than that of the MAO
coating without Al2O3 particles. Meanwhile, with the addition of Al2O3 particles, the average
microhardness linearly increased, which was greatly in accord with Yan’s research results[17]. The MAO coating with 4 g·L-1 Al2O3 particles exhibited the highest hardness of 392.1 HV, which was
more than twice as hard as the substrate. The ascending of microhardness is mainly ascribed to the significant increase of α-Al2O3, which exhibits higher hardness than pure titanium and titanium
dioxide. On the other hand, the thickness of coatings increased with the rising of Al2O3 particles
[image:7.596.90.503.73.223.2] [image:7.596.170.429.325.514.2]
the growth of the coating, which led to the increase of coating thickness with ascending Al2O3 particles
concentration.
3.4. The phase composition of coatings
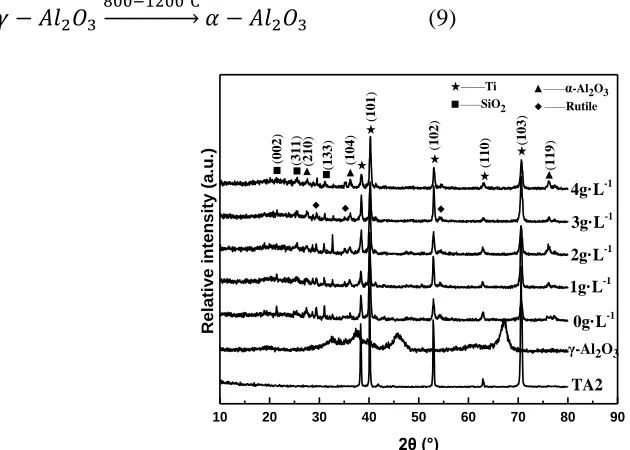
Fig. 5 illustrates the phase patterns of the MAO coatings prepared in electrolytes with different concentration of Al2O3 particles. The analysis results indicate that the MAO coatings were mainly
composed of α-Al2O3, SiO2 and rutile. The peak of Ti coming from the substrate was detected because
X-rays can penetrate into the substrate through the MAO coatings[21]. In addition, the peak intensity decreased as the concentration of Al2O3 particles increased, which revealed that the coatings grew
thicker; this was in accordance with the results of the coating thickness analysis. When γ-Al2O3 was
added to the electrolytes, it gradually transformed to α-Al2O3 due to the local high temperature of
discharge[20], as shown in equation (9). The detection of SiO2 demonstrated that SiO32− existed in the
electrolytewas involved in the chemical reactions, which we have presented in the chemical equations (6), (7). And the peak intensities of α-Al2O3 and SiO2 elevated slightly with the addition of Al2O3
particles. The rising trend of the two phases was caused by the higher voltage, which demonstrated that higher temperature would be reached, more severe reactions would occur, and an easier transformation between the phases would ensue. In addition, the analysis results were in good accord with the EDS analysis, which illustrated that the content of Si gradually increased owing to the transition from SiO32−
to SiO2.
→ (9)
10 20 30 40 50 60 70 80 90
γ-Al2O3
( 133 ) ■ ( 311 ) ( 002 ) ■ ■ ◆ ◆ ◆ ( 110
) (103
) ( 102 ) ★ ( 101 ) ★ ★ ★ ★ Rela tiv e i nt en sit y ( a.u .) ( 119 ) ( 104 ) ( 210 ) 2θ (°) TA2 0g·L-1 1g·L-1 2g·L-1 3g·L-1 4g·L-1 ▲
★——Ti ▲——α-Al2O3
◆——Rutile
■——SiO2
[image:8.596.94.409.419.644.2]▲ ▲
Figure 5. XRD spectra of the MAO coatings with different Al2O3 particles concentrations
3.5. The coating adhesive strength
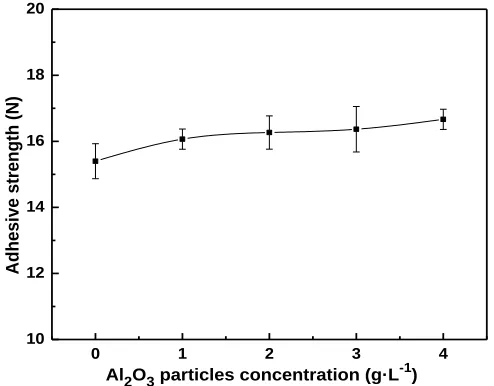
Fig. 6 shows the coating adhesive strength with the addition of Al2O3 particles. It is evident that
was still found that through the scratch testing, the coating adhesive strength increased slightly with ascending Al2O3 particles concentrations. During the microarc oxidation process, the substrate titanium
could be directly transformed into crystalline titanium dioxide so that there were no large voids at the interface between the coatings and the substrate[22]; and the lattice matching between the two was also relatively good, so the coatings had a good adhesive strength with the substrate. On the other hand, it has been reported that the coating adhesive strength is related to the variation of the thickness, microhardness and compactness of the coatings[18]. The addition of Al2O3 particles provided both
thickened coatings and improved microhardness, which were beneficial to the adhesive strength between the coatings and substrates. Hence, the coatings with the addition of Al2O3 particles exhibited
better coating adhesive strengths compared to the coatings without the addition of Al2O3 particles.
0 1 2 3 4
10 12 14 16 18 20
Adh
es
ive
st
reng
th
(N)
[image:9.596.176.423.258.451.2]Al2O3 particles concentration (g·L-1)
Figure 6. Variation in the coating adhesive strength with different Al2O3 particles concentrations
3.6. The thermal shock resistance of coatings
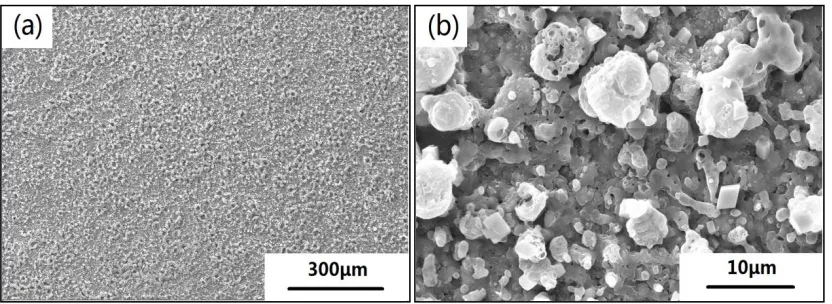
Fig. 7(a) and (b) shows the surface morphologies of the MAO coating at 3 g·L-1 Al2O3 particles
under different magnifications after the thermal shock tests. It can be seen that neither cracks nor peeling phenomena occurred on the coating surface of the samples at a temperature of 300°C for 50 cycles, which elaborated that the coatings possessed a good thermal shock resistance. The good thermal shock resistance of the coatings may be attributed to the coating microstructure, as well as the discharge channels and sintered discs (Fig. 2). The sintered discs would absorb thermal shock energy to release the thermal stress of the interface area through the discharge channels, which resulted from different expansion coefficients between the coatings and the substrate[23]. Ying[24] found that thinner coatings yielded better thermal shock resistance. Due to the great difference in hardness between microarc oxidation coatings and substrates, the thicker coatings have larger internal stresses, and thus they generate cracks easily during heating. The thickness of the coating with 3 g·L-1 Al2O3
thermal shock tests was comparatively small, and the thermal shock resistance of the coating was superior.
Figure 7. Surface morphologies of the coating at 3 g·L-1 after the thermal shock tests: (a) 200x magnification; (b) 5000x magnification
3.7. The corrosion resistance of coatings
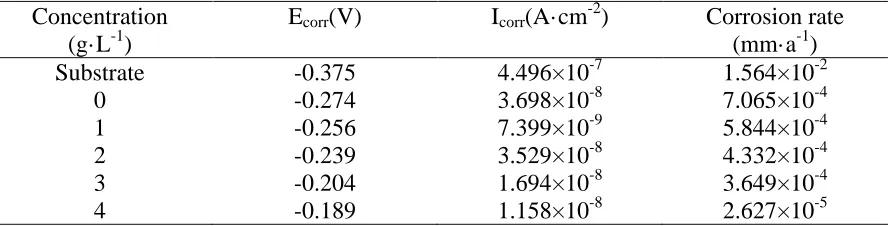
Potentiodynamic polarization curves, which are depicted in Fig. 8, were performed in 3.5 wt% NaCl solution to evaluate the corrosion resistance of MAO coatings with different concentrations of Al2O3 particles. Table 1 demonstrates the fitting results of the polarization curves by Tafel fitting.
According to the Stern-Geary equation[8], the corrosion current density icorr was automatically
calculated as follows: icorr=
× (10)
Then according to Faraday Law (N–equivalent weight, –density): Vcorr(milyear-1)=
(11)
Vcorr(mm/a)=
(12)
It can be seen that the corrosion rate of microarc oxidation coatings reduced by 2 to 3 orders of magnitude compared with that of the pure titanium substrate, which illustrated that the corrosion resistance was improved dramatically owing to MAO treatment. Furthermore, with the addition of Al2O3 particles, the corrosion rate of the coatings decreased, and the corrosion resistance was thus
enhanced. At the same time, Shokouhfar[25] also elaborated that the addition of Al2O3 particles could
greatly improve the corrosion resistance of coatings, but the effect was less than that observed foTiO2.
As the Al2O3 particles concentration increased, the coatings thickened, which impeded the movement
of eroding Cl- ions to the substrate; this improved the corrosion resistance of the coatings. Simultaneously, as discussed above, the doped γ-Al2O3 gradually transformed into α-Al2O3 by the
higher arc energy resulted from the increase of voltage. In addition, it is well-known that the α-Al2O3
[image:10.596.92.508.120.272.2]
1 E-1 2 1 E-1 1
1E-10 1E-9
1E-8
1E-7 1E-6 -0.6
-0.4
-0.2
0.0
0.2
Substrate
4g·L-1
3g·L-1 2g·L-1
1g·L-1
Ec
o
rr
(V
)
AlO23
partic
les co
ncentr
ation
Ico
rr (A·cm -2 )
[image:11.596.178.415.74.260.2]0g·L-1
Figure 7. Polarization curves of MAO coatings with different concentrations of Al2O3 particles
Table 1. Results of polarization curve analysis Concentration
(g·L-1)
Ecorr(V) Icorr(A·cm-2) Corrosion rate
(mm·a-1) Substrate
0
-0.375 -0.274
4.496×10⁻⁷ 3.698×10⁻⁸
1.564×10⁻² 7.065×10⁻⁴
1 -0.256 7.399×10⁻⁹ 5.844×10⁻⁴
2 -0.239 3.529×10⁻⁸ 4.332×10⁻⁴
3 -0.204 1.694×10⁻⁸ 3.649×10⁻⁴
4 -0.189 1.158×10⁻⁸ 2.627×10⁻⁵
4. CONCLUSIONS
MAO coatings were fabricated on pure titanium substrates by microarc oxidation with different Al2O3 particles concentrations in Na2SiO3-NaOH electrolyte system. Al2O3 particles were incorporated
into MAO coating, which was confirmed by EDS and XRD analysis. In addition, it was evident that to some extent the addition of Al2O3 particles could improve the performance of coatings. The voltage,
microhardness and thickness of the coatings increased because the adsorption of negatively charged Al2O3 particles under electrophoresis boosted the electric resistance of the coatings, which facilitated
the increase of voltage. Moreover, the increase of electric energy is beneficial to the improvement of the formation rate of coatings. The number of sintered discs increased gradually with the ascending concentration of Al2O3 particles due to higher energy in individual discharge channel. MAO coatings
mainly consisted of α-Al2O3, SiO2 and rutile. The corrosion resistance of the coatings was improved
owing to the thickening of the coatings and the increase of the anticorrosion phase α-Al2O3, while the
addition of Al2O3 particles had less effect on the coating adhesive strength of MAO coatings.
[image:11.596.51.495.351.464.2]
ACKNOWLEDGEMENT
The present work was supported by the Open Fund of Sichuan Province University Key Laboratory of oil and gas field material (X151517KCL35), Southwest Petroleum University.
CONFLICTS OF INTEREST
The authors declare that there are no conflicts of interest regarding the publication of this paper.
References
1. S. Tamilselvi, V. Raman and N. Rajendran, J. Appl. Electrochem. 40(2015) 285.
2. M. Fazel, H.R. Salimijazi, M.A. Golozar and M.R. Garsivaz jazi, Appl. Surf. Sci. 324(2015) 751. 3. M.R. Garsivaz jazi, M.A. Golozar, K. Raeissi and M. Fazel, J. Mater. Eng. Perform. 23(2014)
1270.
4. G.Y. Jong, Y. Yan, F.W. Long and X.W. Li, Mater. Trans. 54(2013) 1709.
5. Y. Zhang, W. Fan, H.Q. Du and Y.W. Zhao, Int. J. Electrochem. Sci.12(2017)6788. 6. S. Sarbishei, M.A.F. Sani and M.R. Mohammadi, Ceram. Int. 42(2016)8789.
7. J.M. Zhao, K.N. Ouyang, X. Xiong and J.W. Zhang, J. Electrochem. Sci.12(2017)2400.
8. P. Wang, T. Wu, Y.T. Xiao, L. Zhang, J. Pu, W.J. Cao and X.M. Zhong, Vacuum, 142(2017) 21. 9. S.J. Lee, L.H.T. Du, J.L. Lee, C.Y. Chen and H.C. Peng, Int. J. Electrochem. Sci.13(2018)2705. 10.Y. Yang and H. Wu, Trans. Nonferrous Met. Soc. China, 20(2010)688.
11.W. Shang, Y.Y. Wang, Y.Q. Wen, X.Q. Zhan and D. Kong, Int. J. Electrochem. Sci.12(2017)11875. 12.P. Wang, T. Wu, Y.T. Xiao, J. Pu and X.Y. Guo, Mater. Lett. 182(2016) 27.
13.G.H. Lv, H. Chen, W.C. Gu, W.R. Feng, L. Li, E.W. Niu, X.H. Zhang and S.Z. Yang, Curr .Appl. Phys. 9(2009)324.
14.Y. Yang and Y.H. Liu, J. Mater. Sci. Technol. 26(2010)1016.
15.S. Gowtham, S. Hariprasad, T. Arunnellaiappan and N. Rameshbabu, Surf. Coat .Technol. 313(2017)263.
16.H.X. Li, R.G. Song and Z.G. Ji. Trans. Nonferrous Met. Soc. China, 23(2013)406. 17.Y. Wang, D.B. Wei, J. Yu and S.C. Di, J. Mater. Sci. Technol. 30(2014)984.
18.P. Wang, T. Wu, Y.T. Xiao, J. Pu, X.Y. Guo, J. Huang and C.L. Xiang, J. Mater. Eng. Perform. 25(2016)1.
19.V. Shoaei Rad, M.R. Bayati, H.R. Zargar, J. Javadpour and F. Golestani Fard, Mater. Res. Bull. 47(2010)1494.
20.Y.Q. Wang, Y. Wang, P.M. Chen, Y.W. Shao and F.H. Wang, Acta Metall. Sin. 47(2011)455. 21.S. Sarbishei, M.A.F. Sani and M.R. Mohammadi, Ceram.Int.42(2016)8795.
22.Z.D. Liu, Z.Q. Xiang, Z.Y. Zhang, M.J. Sun and H. Fu, Light Met.1(2008)50. 23.Y.S. Zhong, L.P. Shi, M.W. Li, F. He and X.D. He, Appl. Surf. Sci. 311(2014)158.
24.Y. Zhang, W.B. Xue, X.L. Jiang, Z. Yang, X.J. Li and H. Tian, T. Mater. Heat Treat. 29(2008)137. 25.M. Shokouhfar, S.R. Allahkaram, Surf. Coat .Technol. 309(2017)772.