Int. J. Electrochem. Sci., 13 (2018) 1027 – 1041, doi: 10.20964/2018.01.50
International Journal of
ELECTROCHEMICAL
SCIENCE
www.electrochemsci.org
Effect of Calcination Time on Lithium Ion Diffusion Coefficient
of LiMg
0.04Mn
1.96O
4Prepared by a Solid-State Combustion
Method
Tao Feng1,2,3, Wangqiong Xu1,2,3, Xiaofang Liu1,2,3, Miaomiao Shao 1,2,3, Junming Guo1,2,3,*, Changwei Su1,2,3,*
1
Key Laboratory of Comprehensive Utilization of Mineral Resources in Ethnic Regions, Yunnan Minzu University, Kunming 650500, PR China
2
Key Laboratory of Resource Clean Conversion in Ethnic Regions, Education Department of Yunnan, Yunnan Minzu University, Kunming 650500, PR China
3
Joint Research Centre for International Cross-border Ethnic Regions Biomass Clean Utilization in Yunnan, Yunnan Minzu University, Kunming 650500, PR China
*
E-mail: [email protected] ; [email protected]
Received: 26 September 2017 / Accepted: 30 October 2017 / Published: 16 December 2017
A series of LiMg0.04Mn1.96O4 cathode materials were prepared by a solid-state combustion method at temperature of 500°C for 1h and then calcined at 700°C for 3, 6, 9 and 12h. The effects of two-stage calcination time on structure, morphology, electrochemical properties and diffusion coefficient of lithium ions of LiMg0.04Mn1.96O4 were studied. X-ray diffraction (XRD) results showed that the two-stage calcination time at 700°C is ineffective to change crystalline structure and phase composition, still retaining intrinsic spinel structure without any other impurity phases, but the crystallinity become well and particle size increases with calcination time increases. Scanning electron microscope (SEM) shows that LiMg0.04Mn1.96O4 calcined at 700°C for 6h (LMMO-6h) has uniform, nearly octahedron structure morphology with narrow size distribution. Diffusion coefficient of lithium ions ( DLi+ ) of LiMg0.04Mn1.96O4 two-stage calcined at 700°C for 3-12 hours was calculated according to the charging peaks in cyclic voltammetric (CV) curves, it was found that the DLi+ value first increases and then slightly decreased with the calcined time at 700°C. The highest value of 7.19×10⁻¹¹ and 7.48×10⁻¹¹ cm2 s-1 for the first and second oxidation peaks of LMMO-6h, respectively. The electrochemical tests also show LMMO-6h exhibited a better electrochemical than other samples.
Keywords: LiMg0.04Mn1.96O4; solid-state combustion method; diffusion coefficient; calcination time;
lithium ion batteries
1. INTRODUCTION
materials for lithium-ion batteries[1-6]. However, LiMn2O4 suffers from severe capacity loss such as Jahn-Teller distortion[7], the dissolution of manganese in the electrolyte[8], electrolyte decomposition at the electrode in the process of charge and discharge[9] and so on.
To overcome the Jahn-Teller distortion, researchers usually using cationic doping to substitute Mn ions on 16d octahedral sites, so that improve the stability of lithium manganate positive electrode material. Such as Li+, Zn2+,Si4+, Al3+,Cr3+,Mg2+ and Ni2+ [10-15]could increase the average state of Mn ions, enhance structural stability of MnO6 octahedron and suppress the lattice distortion[16-19]. Especially LiMgxMn2-xO4 enables the more prominent discharge capacity and cycling stability due to the higher strength of Mg-O bonding compared to that of the Mn-O bond[20]. Huang et al. [21] synthesized a LiMg0.05Mn1.95O4 cathode material at a low temperature of 400°C for 1h and 600°C for 3h by a molten-salt combustion processing, which get an improved initial discharge capacity of 122 mAh g-1 at 0.5C. Zhao et al. [22] synthesized Mg-doped LiMg0.06Mn1.94O4 cathode material using a citric acid-assisted sol-gel synthesis method. They show that sample exhibited the higher initial capacity of 120.5 mAh g-1 and capacity retention reached 98% after 30 cycles at 0.5C showing excellent cycling performance and illustrate that doped with Mg could significantly improve the crystals structural stability.
The synthesis method also can influence the quality of LiMn2O4 powders used for lithium-ion batteries[23]. However, conventional and commercial spinel LiMn2O4 is synthesized by a high temperature solid-state reaction, which has some disadvantage such as requires high temperature and long heating time[24]. Cai et al.[25] prepared the LiMn2O4 by solid-state combustion at temperature of 350°C for 2h and then calcined at 800°C for 10h. The initial discharge capacity of the synthesized materials was found to be 107.9 mAh g-1 and present a remarkable cycling performance with capacity retention of 76.27% after 1000 cycles at 5C. Xiang et al.[26] have reported that the LiMg0.08Mn1.92O4 is synthesized by solid-state combustion at a low temperature of 500°C for 1h. It shows a better cycling stability. Based on these examples, we found that solid-state combustion synthesis has some remarkable advantages such as saves reaction time and lower reaction temperature[23].
In this paper, the LiMg0.04Mn1.96O4 cathode materials were prepared by a solid-state combustion method preheated to 500°C for 1h and then calcined at 700°C for 3h, 6h, 9h and 12h with manganese carbonate and lithium carbonate as raw materials, magnesium acetate as Mg2+ dopant and citric acid as a fuel. The relation between the calcination time and morphology, electrochemical behavior was investigated. We have analyzed the diffusion coefficient of lithium of samples for different two-stage calcination times and different charge depth and got a preliminary understanding of the influence between calcination time, DLi+value and the electrochemical performance.
2. EXPERIMENTAL
2.1. Synthesis of LiMg0.04Mn1.96O4
polytetrafluoroethylene jar. A fuel of 1.5g citric acid (AR, Sinopharm Chemical reagent Co., Ltd.) was then added to the jar. The mixture was ball-milled thoroughly by planetary ball mill with ethanol as a medium. The obtained precursor (off-white) powders were then heated in a convection oven at 80°C. Subsequently, about 5.5g of the precursor mixture was placed in an alumina crucible and calcined in a muffle furnace at 500°C for 1h in air. And then cool the one-stage calcined LiMg0.04Mn1.96O4 materials to ambient temperature. After grinding the samples, then the materials were calcined in the muffle furnace at 700°C for 3h, 6h, 9h and 12h in air, respectively. The two-stage calcined materials in black powders were obtained after cooling naturally to ambient temperature.
2.2 Characterization
The crystal properties of LiMg0.04Mn1.96O4 were examined with an X-ray Diffractometer (XRD, D/max-TTRIII, Japan) with Cu Kα radiation at a voltage of 40Kv and a current of 30mA. XRD spectra were obtained at 2θ angles of 10°
to 70° with a scanning step of 0.02° and a scanning speed of 4° min-1. Lattice parameters were obtained by means of the Jade 5.0 software. The morphology of the LiMg0.04Mn1.96O4 particles and the surface morphologies of the pristine were observed using a scanning electron microscopy (SEM, QUANTA-200 American FEI Company).
2.3 Electrochemical studies of active materials
For electrochemical studies, composite electrodes were fabricated with the active material, polyvinylidene fluoride (PVDF) and the acetylene black in the mass rate 80:10:10 using N-methy-2-pyrrolidinone (NMP) as solvent for the binder. Spreading uniformly on an aluminum foil using doctor-blade technique drying in an convection oven at 80°C for 4h. The dried electrode film was punched into discs (16mm diameter) forming the test cathode. Lithium metal foil, 1M LiPF6 in ethylene carbonate (EC)-1,2-dimethyl carbonate (DMC) as the electrolyte (EC and DMC volume ratio of 1:1) and Celgard 2320-type membrane as the separator ,respectively to assemble coin-type cells (CR2025) in a dry glove box filled with high purity argon gas. The weight of active material per cm2 was about 2mg. Charge/discharge cycling at constant current mode was carried out using a Land electric test system CT2001A (Wuhan Jinnuo Electronics Co., Ltd.) at room temperature and cyclic voltammogram texts were carried out on ZAHNER Zennium IM6 Electrochemical Workstation (ZAHNER-elektrik GmbH & Co. KG, Kronach, Germany) from 3.60 to 4.50V (vs. Li/Li+) with a scan rate of 0.02mV s-1.
3. RESULTS AND DISCUSSION
3.1. Structure and morphology
corresponding to eight typical crystal planes of (111), (311), (222), (400), (331), (511), (440) and (531). No impurity is detected, indicating that the addition of Mg ions did not change the spinel structure of LiMn2O4. Meanwhile, substitution of manganese with magnesium should result in a shrinkage of the lattice parameters. This is mainly because the Mg2+ occupation in the crystal, reduce the content Mn3+ ions in bulk LiMn2O4 and the ionic radius of the Mn3+ ions (0.66Å) is higher than that of Mn4+ (0.60Å)[27]. The lattice parameters of samples first decreases and then increases with the two-stage calcination time increases. What’s more, the lattice parameters of all samples were less than the standard value 8.247Å of spinel LiMn2O4, which indicated that Mg ions were incorporated into the spinel LiMn2O4 lattice. The LMMO-6h exhibits the highest intensity ratio of (311)/(400) peaks, as shown in Table 1. This indicates that sample can present good electrochemical performance[28]. But with two-stage calcination time increases, the full width at half maximum (FWHM) of (400) peaks became narrower, and the minimum values are reached at 12h. Indicating better crystallinity for LiMg0.04Mn1.96O4 with the time increased gradually.
10 20 30 40 50 60 70
JCPDS:35-0782 Int ensity / a .u
2 /(0)
[image:4.596.213.382.317.440.2]3h 12h 9h 6h (1 1 1 ) (2 2 2 ) (3 1 1 ) (4 0 0 ) (3 3 1 ) (5 1 1 ) (4 4 0 ) (5 3 1 )
Figure 1. XRD pattern of the LiMg0.04Mn1.96O4 at 700°C for 3h, 6h, 9h and 12h in air.
Table 1. The lattice parameters of LiMg0.04Mn1.96O4. two-stage calcination time (h) Lattice constant (Å) FWHM (400) peak (°) Intensity ratio of (311)/(400) peaks
3 8.2382 0.228
0.215 0.209 0.204 0.96 6 9 12 8.2373 8.2374 8.2378 1.02 0.92 0.95
[image:4.596.53.545.529.628.2][image:5.596.131.470.118.379.2]
better crystallinity and moderate particle size may improve the electrochemical performance of LiMn2O4 [29].
Figure 2. SEM images of the LiMg0.04Mn1.96O4 at 700°C for different heat treatment time in air (a)3h, (b)6h, (c)9h, (d)12h.
3.2. Electrochemical characterization
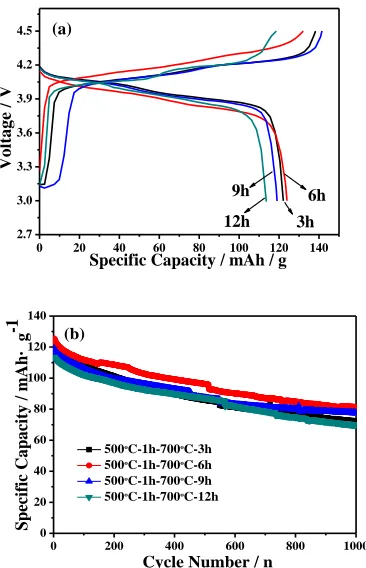
The initial charge-discharge curves of different two-stage calcination time samples are shown in Fig. 3(a) at current density of 1C between the potential range 3.0-4.5V (vs Li/Li+) at room temperature. On the charging process, there is a sudden increase in voltage to 4.0 V from the open-circuit voltage, followed by two well defined plateau regions are observed for all compounds corresponding to the Li de-insertion/insertion process.
0 20 40 60 80 100 120 140 2.7 3.0 3.3 3.6 3.9 4.2 4.5
Specific Capacity / mAh / g
Vol tag e / V 6h 3h 12h 9h (a)
0 200 400 600 800 1000 0 20 40 60 80 100 120 140 (b) 500ºC-1h-700ºC-3h 500ºC-1h-700ºC-6h 500ºC-1h-700ºC-9h 500ºC-1h-700ºC-12h
Cycle Number / n
Sp ec ific Capa ci ty / mAh · g -1
[image:6.596.205.388.72.356.2]Figure 3. The initial charge-discharge curves (a) and Cyclic performances (b) of LiMg0.04Mn1.96O4 samples at different two-stage calcination time.
Table 2. Discharge specific capacity and capacity retention rate of LiMg0.04Mn1.96O4 samples at 1C rate under room temperature.
two-stage calcination time (h)
Discharge capacity (mAh g-1) Capacity retention rate(%) Initial 1000th
3 6 9 12
122.1 72.3 59.21
123.9 81.4 65.70
119 77.9 65.46
113.6 69.7 61.36
0 10 20 30 40 50 60 70
0 20 40 60 80 100 120 140 10C 0.2C 5C 2C 1C 0.5C 500ºC-1h-700ºC-3h 500ºC-1h-700ºC-6h 500ºC-1h-700ºC-9h 500ºC-1h-700ºC-12h Specif
ic Capacity / m
Ah
·
g
-1
Cycle Number / n
0.2C
[image:6.596.68.549.447.728.2] [image:6.596.57.543.458.560.2]
The path of lithium diffusion is too long may hinder the diffusion of lithium ion. The sample of 6h delivers the highest initial specific capacity and discharge specific capacities of 81.4mAh g-1 with the capacity retention of 65.70% after 1000th cycles. Therefore the LiMg0.04Mn1.96O4 sample at two-stage calcination time 6h has best the initial specific capacity and capacity retention.
Fig. 4 displays the rate capabilities of the LiMg0.04Mn1.96O4 prepared at different two-stage calcination time at varying rates from 0.2C to 10C and back to 0.2C in the voltage range of 3.0~4.5V at room temperature. It can be observed that the discharge capacity all decreases with the rate increase due to electrochemistry polarization. The LMMO-6h is found to have higher discharge capacity and capacity-retention values at 0.5C to 10C rates. For example, at 10C rates, capacities of 44.5(±1) mAh g-1 are measured, which are stable at least up to 10 cycles. When decreasing current rate from 10C to 0.2C, the discharge capacities of the four cathode materials are almost restored to their initial discharge capacities at 0.2C, which indicating their good electrochemical reversibility. Compared with the four cathode materials, it can be seen that the LMMO-6 has better rate performance than other samples.
3.6 3.8 4.0 4.2 4.4
-0.4 -0.2 0.0 0.2 0.4
(a)
LiMg0.04Mn1.96O4
9h 12h 3h 6h
Cu
rr
ent /
mA
Potential / V
3.6 3.8 4.0 4.2 4.4
-0.4 -0.2 0.0 0.2 0.4
1000th
Current / m
A
Potential / V
1st
LiMg0.04Mn1.96O4 500C-1h-700C-3h
(b)
3.6 3.8 4.0 4.2 4.4
-0.4 -0.2 0.0 0.2 0.4
(c)
LiMg0.04Mn1.96O4 500C-1h-700C-6h
Current / m
A
Potential / V
1000th
[image:7.596.207.379.309.753.2]
3.6 3.8 4.0 4.2 4.4
-0.4 -0.2 0.0 0.2 0.4
(d)
Current / m
A
Potential / V
LiMg0.04Mn1.96O4 500C-1h-700C-9h
1000th 1
st
3.6 3.8 4.0 4.2 4.4
-0.4 -0.2 0.0 0.2 0.4
(e)
Current / m
A
Potential / V
LiMg0.04Mn1.96O4 500C-1h-700C-12h
1000th 1
st
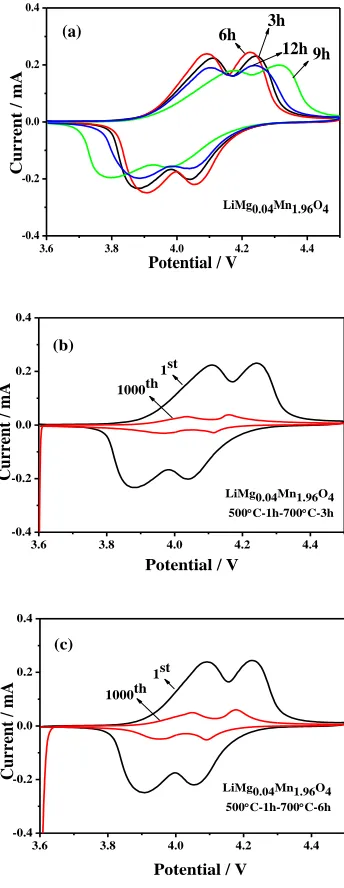
Figure 5. Cyclic voltammetric (CV) curves (a) of the LiMg0.04Mn1.96O4 of different two-stage calcination time at 1st cycle and after 1000th cycles: (b) 3h, (c) 6h, (d) 9h and (e) 12h in the potential rang of 3.6-4.5V (vs. Li/Li+) at a scan rate of 0.02 mV s-1.
[image:8.596.205.380.74.354.2]
As far as we all know, the diffusion of Li+ ion is the rate-determining step during reaction on the charging and discharging process[32]. Therefore, it is an important factor to influence the LMn2O4 cathode materials. The lithium diffusion coefficient can be calculated from Eq.(1) at room temperature[33].
Ip = 2.69×10⁵×n3/2×A×DLi1/2×Co×v1/2 (1)
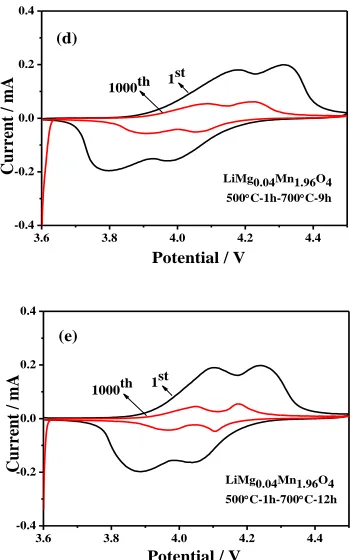
Where Ip is the peak current, n is the electron transfer number of the reaction, A is the surface area of the electrode, DLi+ is the diffusion coefficient of Li+, v is the scan rate, and Co is the bulk concentration of Li+ in the electrode, respectively. Fig. 6(a-d) shows the cyclic voltammograms of the LiMg0.04Mn1.96O4 sample at different calcination time at different sweep rates of 0.02, 0.05, 0.10, 0.15, 0.20mV s-1 ranging from 3.6V to 4.5V, respectively. It can be seen that the potential of anodic and cathodic peaks become larger with the increased scan rate for all samples. Even at a high scan rate of 0.2mV s-1, LiMg0.04Mn1.96O4 sample still presents two couples of well separated redox peaks. It indicates that the samples possess better electrochemical reversibility.
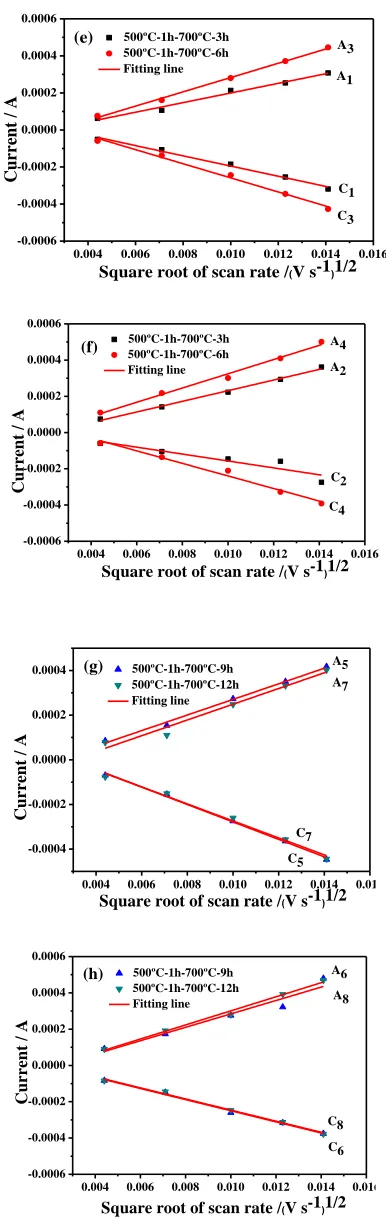
The DLi can be calculated from the slop of Ip vs. v -1/2 plots as shown in Fig. 6(e-h). The all of DLi+ value of samples are given in Table 3. As can be seen from the Table 3, the lithium diffusion values fall within the order of 10-11 cm2 s-1.We found the DLi value first increases and then slightly decreases with the two-stage calcination time increases, correspond to the variation of lattice parameter. It is because the LMMO-6h has more uniform distribution and better-grown crystal, which providing more storage sites of Li+ ions and spacious channel for lithium ion diffusion[32]. However, after the calcination time exceeds 6 hours, the DLi+ value of samples descend. It is due to the larger crystals provide a longer diffusion length and it is disadvantage for ions migration. The LMMO-6h has the highest DLi+ value with two oxidation peak of A1(7.19×10⁻¹¹ cm2 s-1) and A2 (7.48×10⁻¹¹ cm2 s-1), which are similar with the pure LiMn2O4 synthesized by high temperature solid-state combustion reaction using cellulose as fuel[34]. Thus it can be concluded that the LMMO-6h has reasonable particle size and shorter diffusion length, show a better performance than other samples. However, the calculation results of DLi+ value of all samples are slightly lower than LiAl0.03Mn1.97O4 prepared by the PVP-assisted gel combustion method[35].
3.6 3.8 4.0 4.2 4.4
-0.4 -0.2 0.0 0.2 0.4 Cu rr ent /m A Potential /V C2 C1 A2 A1
0.02 mV s-1
0.05 mV s-1 0.10 mV s-1
0.15 mV s-1 0.20 mV s-1
(a)
3.6 3.8 4.0 4.2 4.4
-0.6 -0.4 -0.2 0.0 0.2 0.4 0.6 (b) Cu rr ent /m A Potential /V C4 C3 A4 A3
0.02 mV s-1
0.05 mV s-1
0.10 mV s-1
0.15 mV s-1
0.20 mV s-1
3.6 3.8 4.0 4.2 4.4
-0.6 -0.4 -0.2 0.0 0.2 0.4 0.6 (c) (a) C6 C5 A6 A5
0.02 mV s-1 0.05 mV s-1 0.10 mV s-1 0.15 mV s-1 0.20 mV s-1
Cu
rr
ent /m
A
Potential /V
3.6 3.8 4.0 4.2 4.4
-0.6 -0.4 -0.2 0.0 0.2 0.4 0.6 (d)
0.02 mV s-1 0.05 mV s-1 0.10 mV s-1 0.15 mV s-1 0.20 mV s-1
0.004 0.006 0.008 0.010 0.012 0.014 0.016 -0.0006
-0.0004 -0.0002 0.0000 0.0002 0.0004 0.0006
(e) 500ºC-1h-700ºC-3h 500ºC-1h-700ºC-6h Fitting line
Square root of scan rate /(V s-1)1/2
Cu
rr
ent /
A
A3
A1
C1 C3
0.004 0.006 0.008 0.010 0.012 0.014 0.016 -0.0006
-0.0004 -0.0002 0.0000 0.0002 0.0004 0.0006
C4 C2
Square root of scan rate /(V s-1)1/2
Cu
rr
ent /
A
500ºC-1h-700ºC-3h 500ºC-1h-700ºC-6h Fitting line
(f) A4
A2
0.004 0.006 0.008 0.010 0.012 0.014 0.016 -0.0004
-0.0002 0.0000 0.0002
0.0004 (g) 500ºC-1h-700ºC-9h 500ºC-1h-700ºC-12h Fitting line
C5 C7
A7 A5
Square root of scan rate /(V s-1)1/2
Cu
rr
ent /
A
0.004 0.006 0.008 0.010 0.012 0.014 0.016 -0.0006
-0.0004 -0.0002 0.0000 0.0002 0.0004 0.0006
Square root of scan rate /(V s-1)1/2
Cu
rr
ent /
A
(h) 500ºC-1h-700ºC-9h 500ºC-1h-700ºC-12h Fitting line
C8 C6 A8 A6
[image:11.596.201.394.70.679.2]
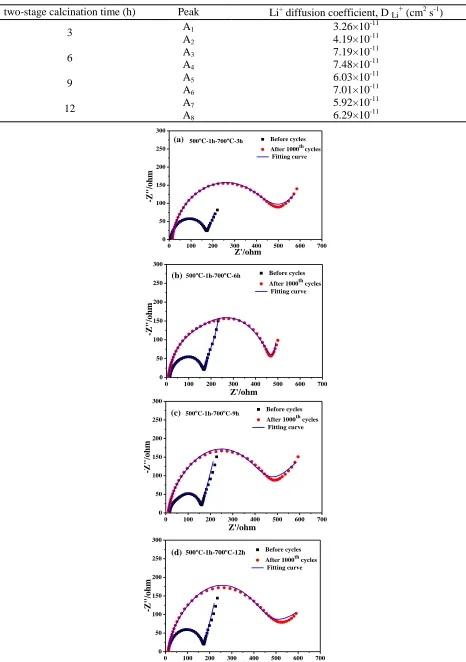
Table 3. Li+ diffusion coefficient of different two-stage calcination time LiMg0.04Mn1.96O4 two-stage calcination time (h) Peak Li+ diffusion coefficient, D Li+ (cm2 s-1)
3 A1 3.26×10
-11
A2 4.19×10 -11
6 A3 7.19×10
-11
A4 7.48×10 -11
9 A5 6.03×10
-11
A6 7.01×10 -11
12 A7 5.92×10
-11
A8 6.29×10 -11
0 100 200 300 400 500 600 700 0
50 100 150 200 250 300
(a) 500ºC-1h-700ºC-3h Before cycles After 1000thcycles Fitting curve
-Z"/oh
m
Z'/ohm
0 100 200 300 400 500 600 700 0
50 100 150 200 250 300
(b) 500ºC-1h-700ºC-6h Before cycles After 1000th cycles Fitting curve
-Z"/o
hm
Z'/ohm
0 100 200 300 400 500 600 700 0
50 100 150 200 250 300
(c) 500ºC-1h-700ºC-9h
-Z"/o
hm
Z'/ohm
Before cycles After 1000th cycles Fitting curve
0 100 200 300 400 500 600 700 0
50 100 150 200 250 300
(d) 500ºC-1h-700ºC-12h Before cycles After 1000th cycles Fitting curve
-Z"/oh
m
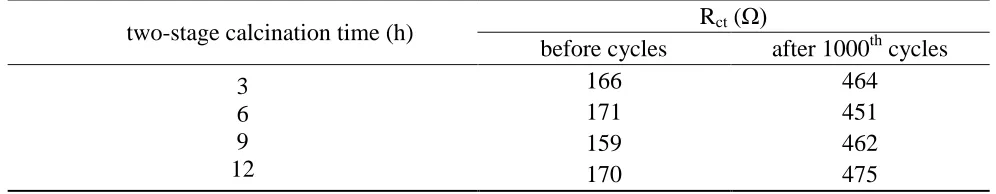
Figure 7. (a)-(d) Electrochemical impedance spectra of the LiMg0.04Mn1.96O4 samples at different
[image:13.596.49.547.247.344.2]two-stage calcination time before cycles and after 1000th cycles at room temperature, (e) Equivalent circuit model of EIS.
Table 4. Fitting values of the charge transfer resistance (Rct) obtained from EIS.
two-stage calcination time (h) Rct (Ω)
before cycles after 1000th cycles 3
6 9 12
166 464
171 451
159 462
170 475
Nyquist plots (Fig. 8) and fitting results (Table 4) of the LiMg0.04Mn1.96O4 samples at different two-stage calcination time are displayed. The plots are modeled by the equivalent circuit Fig.7(e) by Zview software. Fig. 7 (a-d) shows the impedance of different calcination time samples before and after 1000th cycles. Obviously, all of the samples contain two partial, a semicircle in the high frequencies and a straight slopping line in low frequencies. R1 is the resistance of lithium-ion migration through the SEI film. The symbols, Rct, W1, C1, Represent the charge transfer impedance, Warburg impedance, reflection of intercalation capacitance, respectively[38]. From the results, we can see that the LMMO-6h has the highest resistance (171Ω) before cycles. However, after 1000 cycles, this sample presents the lowest Rct (451Ω), implying the small Rct is favorable to a faster reaction rate of lithium ions in the charge/discharge process and better electrochemical performance[39].
4. CONCLUSIONS
ACKNOWLEDGEMENTS
This work was financially supported by the National Natural Science Foundation of China (51462036, U1602273), Innovation Program of Yunnan Minzu University (2016YJCXS18).
References
1. C.R. Xu, Y.J. LU, H. Hu, P.L. Li, L. Kong, Q.Y. Su and X.L. Cao, Int. J. Electrochem. Sci., 12 (2017) 5185-5198.
2. Y.L. Ding, J. Xie, G.S. Cao, T.J. Zhu, H.M. Yu and X.B. Zhao, J. Phys. Chem. C., 115 (2011) 9821-9825.
3. O.K. Park, Y. Cho, S. Le, H.C. Yoo, H.K. Song and J. Cho, Energ Environ Sci., 4 (2011)16-21. 4. K. Kang, Y.S. Meng, J. Breger, C.P. Grey and G. Ceder, Science, 311 (2006)977-980.
5. Z.J. Zhang, S.L. Chou, Q.F. Gu, H.K. Liu, H.J. Li, Kiyoshi Ozawa and J.Z. Wang, ACS Appl. Mater. Interfaces, 6 (2014) 22155.
6. W.Q. Xu, J.J. Huang, Q.L. Li, H.L. Bai, C.W. Su, Y.H. He, W. Bai and J.M. Guo, Int. J. Electrochem. Sci., 10 (2015) 9351-9358.
7. R.J. Gummow, A.D. Kock and M.M. Thackeray, Solid State Ionics, 69 (1994) 59-67. 8. X. Li and Y. Xu, Electrochemistry Communications, 9 (2007) 20-23.
9. Y.Y. Xia, Y.H. Zhou and M. Yoshio, J. Electrochem. Soc., 144 (1997) 25-93. 10.R. Thirunakaran, T. Kim and W.S. Yoon, Particuology, 24 (2016) 87-95. 11.R.J. Gummow and Y. He, J. Power Sources, 253 (2014) 315-331.
12.H. Zhao, S. Liu, Z. Wang, Y. Cai and M. Tan, Ceram. Int., 42 (2016) 13442-13448. 13.B. Shen, P. Zuo and Q. Li, Electrochim. Acta, 224 (2017) 96-104.
14.R. Thirunakaran, K.T. Kim, Y.M. Kang and J.Y. Lee, Mater Res Bull,40 (2005) 177-186.
15.X. Gu, X.W. Li, L.Q. Xu, H.Y, Xu, J. Yang and Y.T. Qian, Int. J. Electrochem. Sci., 7 (2012) 2504-2512.
16.R. Santhanam and B. Rambabu, J. Power Sources,195 (2010) 5442–5451.
17.C.Y. Ouyang, X.M. Zeng, Z. Sljivancanin and A. Baldereschi, J. Phys. Chem. C, 114 (2010) 47-56. 18.G.G. Amatucci, C.N. Schmutz, A. Blyr, C. Sigala, A.S. Gozdz, D. Larcher and J.M. Tarascon, J.
Power Sources, 69 (1997) 11-25.
19.M.C. Smart, B.V. Ratnakumar, J.F. Whitacre, L.D. Whitcanack, K.B. Chin, M.D. Rodriguez, D. Zhao, S.G. Greenbaum and S. Surampudia,J. Electrochem. Soc.,152(2005) A1096-A1104
20.H. Zhang, D. Liu, X.S. Zhang, C.J. Zhao and Y.L Xu, J. Solid State Electr., 18 (2014) 569–575. 21.J.J. Hang, F.L. Yang, Y.J. Guo, C.C. Peng, H.L. Bai, J.H. Peng and J.M. Guo, Ceram. Int., 41
(2015) 9662–9667.
22.H.Y. Zhao, X.Q. Liu, C. Cheng, Q. Li, Z. Zhang, Y. Wu, B. Chen and W.Q. Xiong, J. Power Sources, 282 (2015) 118-128.
23.P. Shen, D. Jia and Y. Huang, J. Power Sources, 158 (2006) 608-613.
24.H.S. Zhou, J. Xie, X.H. Xie, G.S. Tang and K.B. Li, Integrated Ferroelectrics, 147 (2013) 1–7. 25.Y. Cai, Y. Huang, X. Wang, Ceram. Int., 40 (2014) 14039-14043
26.M.W. Xiang, L.Q. Ye, C.C. Peng, L. Zhong, H.L. Bai, C.W. Su and J.M. Guo, Ceram. Int., 40 (2014) 10839-10845.
27.S. Mukerjee, X.Q. Yang and X. Sun , Electrochim. Acta, 49 (2004) 3373-3382. 28.Y.S. Lee, N. Kumada and M. Yoshio, J. Power Sources, 96 (2001) 376-384.
29.G.H. Jin, H. Qiao, H.L. Xie, H.Y. Wang, K.J. He and P. Liu, Electrochim. Acta, 150 (2014) 1-7. 30.Z. Zhang, Z. Chen and G. Wang , Phys. Chem. Chem. Phys., 18 (2016) 68-93.
31.A. Sakunthala, M.V. Reddy, S. Selvasekarapandian, B.V.R. Chowdari and P.C. Selvin, Electrochim. Acta, 75 (2012) 118-119.
33.J.L. Wang, Z.H. Li, J. Yang, J.J. Tang, J.J. Yu, W.B. Nie, G.T. Lei and Q.Z. Xiao, Electrochim. Acta, 75 (2012) 115-122.
34.Y.J. Cai, Y.D. Huang, X.C. Wang, D.Z. Jia, W.K. Pang, Z.P. Guo, Y.P. Du and X.C. Tang, J. Power Sources, 278 (2015) 574-581.
35.K.H. Dai, J. Mao, Z.T. Li, Y.C. Zhai, Z.H. Wang, X.Y. Song and V. Battaglia, G. Liu, J. Power Sources, 248 (2014) 22-27.
36.S.J. Bao, Y.Y. Liang and W.J. Zhou, J. Power Sources, 154 (2006) 239-245.
37.M. Prabu, M.V. Reddy and S. Selvasekarapandian, Electrochim. Acta, 88 (2013) 745-755.
38.R.H. Zeng, W.S. Li, D.S. Lu, Q.M. Huang and L.Z. Zhao, T. Nonferr Metal Soc., 17 (2007) 1312-1318.
39.Z.D. Peng, Q.L. Jiang, K. Du, W.G. Wang, G.R. Hu and Y.X. Liu, J. Alloys Compd., 493 (2010) 640–644.