THE GLOBAL RACE FOR
TALENT: EUROPE'S
MIGRATION CHALLENGE
bruegel
policy
brief
ISSUE2014/02 MARCH 2014
by
Rainer Münz
Non-resident Fellow at BruegelHead of Research, Erste Group rainer.muenz@bruegel.org
POLICY CHALLENGE
In the short run, Europe needs more labour mobility between EU member
states given excessively high unemployment reported in some regions,
while others face a shortage of skills. In the long run this will not be
suffi-cient to close gaps in European labour markets. But many Europeans are
not ready to accept more international migrants, and give their support to
political parties with restrictive agendas. This creates at least three
chal-lenges. First: organising political majorities in favour of more proactive
migration policies. Second:
making Europe more
attrac-tive for mobile people with
talent and skills. Third:
moving away from unilateral
migration policies towards
negotiated win-win
solu-tions aiming at reducing the
costs of, and enhancing the
welfare gains from,
migra-tion and remittances.
Future labour market demand? Working-agepopulation change 2010-50 (%), selected regions
THE ISSUE
In an ageing world with demographic and economic imbalances,
the number of international migrants is likely to rise during the twenty-first
century. The geography of migration flows is changing, however. Mobile
people will be increasingly attracted by faster-growing economies.
There-fore, some traditional destinations in western Europe will face stronger
competition for skilled labour – not least from countries like China where
the working-age population will shrink after 2020. At the same time, the
sentiment in many European receiving societies is turning against
migra-tion and intra-European Union mobility.
Source: Bruegel based on UN. Note: working-age population = 20-64. See Figure 1 on page 4. -25
0 25 50 75 100
177.3
China India
Europe US/
Canada Latin
America North
Africa Sub-Sah.
br
ueg
el
policy
br
ief
02
1. ‘Popular initiative: against mass immigra-tion’, see http://www.admin.ch/ch /d/pore/vi/vis413t.html.
THE NATURE OF INTERNATIONAL MIGRATION is changing. Europe (including Russia) remains the most significant destination for migrants, hosting almost a third (31 percent) of all international migrants (72 million out of a total of 232 million; see Table 2 on the next page). But more economies will soon enter the global race for talent and skills. China, for exam-ple, is already actively searching for highly qualified experts from abroad, although numbers are still relatively small.
At the same time, economic growth has shifted from the advanced economies to middle-income and low-middle-income countries, making many traditionally immi-grant-receiving countries less attractive for migrant workers and their families. The momentum of global ageing is also set to shift to today's emerging markets – namely China and Latin America. Europe faces a situation in which, in the short term, it will have to address high unemployment in some parts of the continent, and a shortage of labour and skills in others, while in the medium and long terms, because of ageing societies and stagnating or declining working age
popula-tions, it will need to invest more in sound, forward-looking migration policies. Current policies are often uncoordinated with little coopera-tion among EU member states or between migrant-sending and migrant-receiving countries.
Furthermore, anti-immigration sentiment is growing in some European countries. Populist par-ties throughout Europe gain ground by focusing on the issue. The February 2014 referendum in Switzerland1 showed that
free-dom of movement within Europe is no longer backed by a majority of Swiss voters. The same is most likely true for the United Kingdom and maybe a few other EU states.
This Policy Brief provides an overview of global migration trends and how the dynamics of international migration are chang-ing. It then considers how Europe needs to respond – both in terms of making the internal labour market more efficient, and in terms of managing the shifts in international migration.
GLOBAL MIGRATION TRENDS
There are 7.2 billion people living on our planet, mainly in the
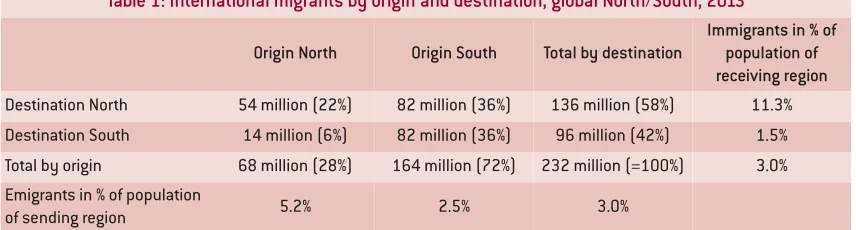
middle- and low-income countries of the global South. Less than 20 percent live in high-income coun-tries of the global North (see Table 1 for definitions). An estimated 232 million people, or 3 percent of the global population, are interna-tional migrants – defined as people living outside their coun-try of birth (see UN DESA, 2012). Of these 232 million international migrants, an estimated 164 mil-lion, or 71 percent, were born in middle- and low-income countries the global South; about half of these, 82 million, have moved to other countries in the global South. The other 82 million have moved to rich countries of the global North (Table 1).
Another 63 million international migrants (29 percent) have their roots in rich countries of the global North. Most of them, 53 million, have moved to another rich country. As a result there are now an estimated 135 million international migrants (58 per-cent of all international migrants) living in richer countries of the northern hemisphere (Table 1).
[image:2.595.113.541.589.704.2]Since 1990, the number of inter-national migrants has increased by 76 million (+49 percent).
Table 1: International migrants by origin and destination, global North/South, 2013
Origin North Origin South Total by destination
Immigrants in % of population of receiving region
Destination North 54 million (22%) 82 million (36%) 136 million (58%) 11.3%
Destination South 14 million (6%) 82 million (36%) 96 million (42%) 1.5%
Total by origin 68 million (28%) 164 million (72%) 232 million (=100%) 3.0%
Emigrants in % of population
of sending region 5.2% 2.5% 3.0%
br
ueg
el
policy
br
ief
0
3
2. Another 2.7 million international migrants live in EU-associated countries: Iceland, Liechtenstein, Norway, Switzerland (=EEA + EFTA).
3. Calculation based on UN DESA (2012), OECD (2013), and Eurostat (http://epp.eurostat.ec. europa.eu/statistics_ex plained/index.php/Migr ation_and_migrant_popul ation_statistics).
Europe (including Russia) is the most important migrant destination. Only 52 percent of its 72 million migrants come from other European countries. Almost the same number of international migrants resides in Asia (70.8 million), with a large majority coming from other Asian countries. North America (53 million) is home to about a fifth of all migrants (Table 2). Within Europe 49 million international migrants reside in the member states of the European Union2, of
which less than a third have moved from another EU country, while two thirds have come from third countries3.
GLOBAL POPULATION TRENDS
Since 2000, the world population has increased by 77 million people (or about 1.1 percent) per year (UN DESA, 2013b). The growth rate will decline during the next few decades, though global population is projected to grow for another 50-70 years, reaching 9.6 billion in 2050 (see UN DESA, 2013b). Most population growth will be concentrated in South Asia, the Middle East and sub-Saharan
Africa (UN DESA, 2013b; UNFPA, 2013). At the same time, in some regions and countries, especially in the global North, population growth has already ended, and an increasing number of countries will experience stagnating or even declining populations.
The main reason for the declining rate of global population growth is the shrinking number of children per family (see UNFPA, 2013). At first this translates into fewer births and smaller cohorts of pre-school and pre-school children. Eventually, the size of the work-ing-age population also starts to shrink.
In Japan, Russia and South Korea the domestic labour force is already contracting. Europe will experience the same within ten years, and China will begin to see its working-age population decline after 2020. In Latin Amer-ica the working-age population will start declining after the year 2045. Meanwhile, working-age populations will continue to grow in South Asia, the Middle East and Africa (Figure 1 on the next page).
Table 2: International migrants by macro region of origin and destination, 2013
O rigin , a b s o lut e n umb e r (milli o n s) A s % o
f all in
te r-na tiona l em ig ra n ts Emi gr an ts re m a inin
g in t
h e sa m e m a cr o re gi o n , % De s tin ation, a b s o lut e n umb e r, milli o n s As % o f a ll in te rn a tio n a l immi gr an ts Immi gr an ts co min g f ro m t h e sa m e m a cr o re gi o n , %
Africa 31.3 13.5 49 18.6 8.0 82
Asia 92.5 40.0 58 70.8 30.6 76
Europe 58.4 25.2 65 72.4 31.3 52
Latin America 36.7 15.9 15 8.5 3.7 64
North America 4.3 1.9 28 53.1 22.9 2
Oceania 1.9 0.8 58 7.9 3.5 42
N/A 6.4 2.7
Total 231.5 100 100
Source: UN DESA, 2012, 2013a. Note: Europe includes Russia and other successor states of the former Soviet Union.
During this period, the number of international migrants born in the South and residing in the North increased from 40 to 82 million (+105 percent) while the migrant population originating in the global South and living in other countries of the South grew from 59 million to 82 million (+41 per-cent). The number of international migrants born in the North and residing in other rich countries of the North only grew from 41 to 54 million (+32 per cent) (UN DESA, 2013a).
br
ueg
el
policy
br
ief
04
Japan and the countries ofwest-ern Europe currently have the oldest populations, followed by North America, Australia, central Europe and Russia. But soon the momentum of global aging will shift to today’s emerging markets – namely to China and Latin America. These developments are highly predictable, but many countries are not well prepared for rapidly ageing societies and declining working-age popula-tions. A number of experts assume that this will have a nega-tive impact on economic growth, citing Japan as the most promi-nent example. At the same time declining working-age popula-tions might create additional demand for migrant labour and skills4.
IMPLICATIONS FOR THE FUTURE GEOGRAPHY OF INTERNATIONAL MIGRATION
What does this changing pattern mean for international migration and mobility in the next few decades?
• The global race for talent and skills will get tougher as more countries actively search for highly qualified experts from abroad. China has started to do this, although migration into China is still relatively limited. China’s declining working-age population might also create a demand for semi-skilled and low-skilled labour, effectively turning it from a migrant-send-ing into an immigrant-receivmigrant-send-ing country, competing with Europe, North America and Australia for workers and skills. • Economic growth has shifted from the advanced economies
to middle-income and low-income countries. In case this shift persists, the narrowing of existing income gaps will have practical implications for the migration patterns of the future.
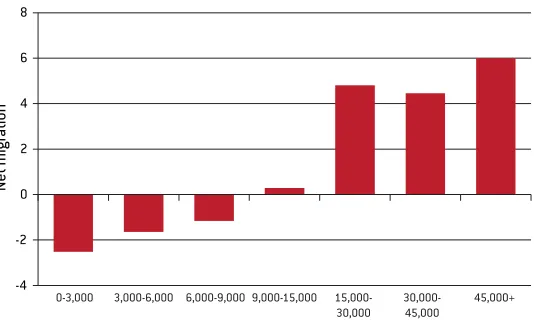
• Empirical analysis for the first decade of the twenty-first cen-tury shows that on average only countries with a gross national income (GNI) per capita below US$ 9,000 had a negative migration balance (average annual net flows; see Figure 2)5. As GNI in many
middle- and low-income coun-tries increases, sending countries will be turned into destination countries. • In countries where GNI per
capita exceeds US$ 15,000, net migration balances on average are positive (Figure 2)6. However, many
immigrant-receiving countries of the North are encountering slow economic growth or even recession, and unemployment rates are well above historical averages. This makes them less attractive for migrant
0 200 400 600 800 1000 1200
19
5
0
19
60
19
7
0
19
80
19
90
20
00
20
10
20
20
20
3
0
20
40
20
5
0
India
Sub-Saharan Africa
China
Europe Latin America
USA/Canada Northern Africa Working-agepopulation(ages20-64,millons)
[image:4.595.267.536.347.507.2]Source: Bruegel based on UN World Population Prospects: The 2012 Revision.
Figure 1: Change in working-age population, 1950-2050
-4 -2 0 2 4 6 8
Net
migration
0-3,000 3,000-6,000 6,000-9,000 9,000-15,000 15,000-30,000
30,000-45,000
45,000+
[image:4.595.264.531.557.720.2]Source: Bruegel based on United Nations and World Bank data (N = 170 countries). Note: Average annual net migration rates for 2005-10 per 1,000 inhabitants grouped by average annual GNI per capita (2005-10) of respective countries.
Figure 2: Average net migration balances (net flows) by average annual GNI per capita (US$), 2005-10
4. It should be noted, however, that in Japan, which has the world’s oldest population and reports a shrinking working age population since the 1990s, this has not been the case so far.
br
ueg
el
policy
br
ief
0
5
7. The UN Population Projection even assumes that interna-tional migration (at least in net terms) will gradually disappear by the end of the twenty-first century.
pled with high unemployment. For citizens of these countries, emigration to neighbouring countries and oversees desti-nations will continue to be a welfare-enhancing alternative for quite some time.
THE IMPACT OF MIGRATION ON WELFARE AND DEVELOPMENT
Many migrants manage to improve their incomes, their access to education or their per-sonal security. This is particularly true for people moving within or to the Northern hemisphere. As a result, international migration and internal mobility in many cases are quick ways to increase wel-fare and opportunities for mobile people. As a part migrants’ income is typically sent back home, migration also has the
potential to directly improve living conditions in migrant-sending regions and countries. This, how-ever, is only the second-best choice for development, because remittances increase the pur-chasing power of local households with a relative abroad, but do not necessarily generate local investment or jobs.
In total, international remittances by migrant workers in 2013 amounted to an estimated US$549 billion (World Bank, 2013). The greatest part of these remittances went to developing countries – some US$414 billion: about 2.5 times the amount that rich countries transfer as over-sees development assistance. The largest flows come from migrants working in rich countries of the global North sending workers and has already
changed the direction of migra-tion flows. For example, the European countries most affected by the financial and economic crisis, in particular Ireland, Greece, Portugal and Spain, have recorded more emigration than immigration since 2010 (Figure 3). • The improving economic
situa-tion in capital cities and other urban agglomerations of many traditional migrant-sending countries has created domes-tic alternatives to international migration. Usually this has to do with declining population growth and industrialisation and the emergence of urban service sectors absorbing rural migrants. The impact on inter-national migration is clearly visible: for example, Mexico and Turkey were for decades both prominent sources of immigration to the United States and the EU, respec-tively, but no longer play that role. Internal mobility towards quickly developing urban agglomerations in these coun-tries has become an attractive alternative to emigration7. • Similarly, several emerging
economies – including Angola, Brazil, Chile, Ivory Coast, Malaysia and South Africa – are attracting migrants from neighbouring countries, open-ing up regional alternatives for mobile people who might oth-erwise have looked further afield (IOM, 2011). Neverthe-less, many middle- and low-income countries – such as Bangladesh, Egypt, India, Pakistan and the Philippines – will continue to have youthful and growing populations
cou--5 orlower -5 to -2 -2to0 0to+2 +2to+5 +5 ormore
[image:5.595.210.483.131.388.2]Source: Bruegel based on Eurostat, UN DESA, national statistics. Note: Per 1000 inhabitants. Countries with a recent change from net immigration to net emigration (Bosnia, Croatia, Greece, Iceland, Ireland, Portugal, Spain) or from net emigration to net immigration (Turkey) are outlined with a heavy black border.
money to households and com-munities in the global South.
The top receiving countries of offi-cially recorded remittances in 2012 were India (US$71 billion), China (US$60 billion), the Philip-pines (US$26 billion), Mexico (US$22 billion) and Nigeria (US$21 billion). Other major recipients included Egypt, Pak-istan, Bangladesh, Vietnam and Ukraine.
Within Europe, remit-tances are also important for coun-tries with a small GDP and a consider-able diaspora, in particular Albania, Bosnia, Kosovo and Moldova.
By giving people access to coun-tries and regions with better opportunities and by enabling remittances, migration can con-tribute to poverty reduction, but also to increased access to edu-cation, health services and food security.
In addition, over time, migrants can become agents of change in their home regions and countries. Some create trade relationships; others bring back new technolo-gies or start to invest in their home countries. In a number of countries, returning migrants have played a significant role in promoting democracy or even in facilitating regime change8.
With a growing demand for migrant labour and skills in high-income countries with ageing populations, the welfare-enhancing effects of international
br
ueg
el
policy
br
ief
06
migration are likely to increase.The same is true for growing formal and informal labour markets in urban agglomerations of middle- and low-income countries.
There are, however, a number of negative aspects. Migrants are at risk of being exploited individu-ally or discriminated against structurally9. Individual
exploita-tion can be experienced at the hands of employers, agents or traffickers. Migrants sometimes are charged exces-sive commissions for recruitment serv-ices, when changing money or when sending money back home (World Bank, 2013). Structural discrimination is linked to labour laws of destina-tion countries, recruitment and promotion practices of employers or tax and social security sys-tems collecting contributions from migrants, but excluding them from certain public services or social transfers10. At the same
time, under certain conditions, newly-arrived migrants can have negative effects on wages and labour force participation of low-skilled native workers, though the overall economic impact of the these migrants for the receiving country is positive.
International migration and mobil-ity potentially cause brain drains from rural peripheries to urban centres and from low-income countries to emerging and devel-oped economies. This negatively affects economic output and wages in migrant-sending regions. Additionally,
discrimina-tion against migrants in labour markets of destination countries clearly leads to brain waste and over time to de-qualification.
Some of these risks can be mitigated through circular and return-migration. Other risks can only be addressed through setting and enforcing minimum wage levels, social protection levels and labour and recruitment standards.
IMPLICATIONS FOR EUROPEAN EMPLOYMENT AND MIGRATION POLICIES
The changing economic and demographic realities of the coming decades will have major implications for future employ-ment and migration policies in Europe:
• In the short term, high unem-ployment in some parts of Europe and a shortage of labour and skills in other parts should be addressed by encouraging more mobility between EU member states leading to better allocation of labour within the European Union.
• In the medium and long terms European countries with ageing societies and stagnating or declining working-age populations will need to invest more in sound, forward-looking migration policies. Many EU member states accustomed to easily finding the labour and skills they require will need to think more strategically about how to attract qualified workers. • Tougher competition for skills
will put more focus on the
‘Changing economic
and demographic
realities will have
major implications
for Europe's
migration policies.’
8. Diasporas can play a crucial role in cases of regime change because they might include alternative elites ready to return.
9. See (as one of many examples) the discus-sion about the living and working conditions (including high risks of fatal accidents) of migrant labour in Qatar: http://www.globalresear ch.ca/the-world-cup-socker-in-qatar-2022-c ontroversy-over-the-appalling-migrant-work er-conditions/5353020.
10. Some of these issues are addressed in the International Labour Organisation conventions no. 143
employment of migrant labour to supply the needed human capital to the European labour market. In this context, mutual recognition of educational attainments and acquired skills based on comparable standards would be extremely helpful. More emphasis should also be given to making acquired social and employer benefits fully portable. • More international migration
from third countries and a greater degree of mobility between EU countries remains only one possible answer to future mismatches between supply and demand of labour and skills. EU member states with ageing populations must also consider other policies to protect the capabilities of their workforces — such as increas-ing the retirement age and the labour force participation of women.
Bilateral or even EU-level coopera-tion offers policymakers at all points of the migration trajectory — sending, transit
and receiving coun-tries — the opportunity to craft smarter policies that will be mutu-ally beneficial and will mitigate the risks of migration. However, while
most sending countries have adopted liberal migration policies facilitating travel and emigration, receiving countries in Europe see migration control as a key ele-ment of their sovereignty. As a result, EU member states gener-ally have ‘unilateral’ admission policies that are aligned neither
br
ueg
el
policy
br
ief
0
7
11. The EU regulates which country is responsible for processing asylum claims.
12. See http://eur-lex.europa.eu/LexUriServ /site/en/com/2007/com 2007_0637en01.pdf.
13. The main exceptions are the annual meetings of the Global Forum on Migration and Development (http://www.gfmd.org/en) and the UN High Level Dialogue on Migration and Development that took place in October 2013.
14. See footnote 1.
with other receiving countries nor with the main sending countries. As a result, bilateral agreements or mobility partnerships only play a minor role in most EU migration policymaking.
This is in contrast to border man-agement (Schengen system), for which EU member
states share joint responsibility, sup-ported by a specialised agency (Frontex). There is also some coordina-tion in the field of asylum11. The
admission of
migrant labour from third coun-tries, however, remains fully under the control of each EU member state. As a consequence, a work permit for a particular EU country does not give access to the common EU labour market. Even the so-called EU ‘Blue Card’ providing access to all 28 national labour markets has to be issued by a particular EU member state12.
Most member states have never issued such ‘Blue Cards’.
At international level, there are few occasions for repre-sentatives of EU member states to share their views or to find common ground with representatives of sending countries13— unlike the international dimension of policy-making on trade, energy or climate change. Lack of coopera-tion between migrant-sending and receiving countries increases the costs of migration and decreases the positive effect on
socio-economic development. The direct (and sometimes exces-sive) costs relate to visas and passports, recruitment and travel agencies, exchange commis-sions, money transfer fees and other fees. The indirect costs relate to labour market discrimi-nation leading to lower incomes compared to native workers with similar skills, and to reduced portability of acquired social rights and benefits leading to lower (or no) pension pay-ments, lower health insurance coverage and reduced (or no) access to unemployment benefits.
Within the EU28 there are also a number of barriers, including insufficient linguistic skills, restricted access to certain labour market segments, even for citi-zens of other EU countries, and restricted portability of social benefits. The outcome is evident. Europe still lacks a functioning internal labour market with suffi-cient mobility between regions with high and regions with low unemployment. Furthermore, in many European countries, there is considerable popular scepti-cism or even resistance to international migration. In Febru-ary 2014, a referendum put forward by the conservative and populist Swiss People’s Party in favour of abolishing the free movement of labour between the EU and Switzerland, while re-intro-ducing annual quotas for migrants and cross-border com-muters, was backed by 50.3 percent of the voters14. This result
is a good example of how deeply
‘Migration is only one
possible answer to
future EU
mis-matches between
supply and demand
of labour and skills.’
br
ueg
el
policy
br
ief
08
negative sentiment againstimmi-gration is entrenched even in one of the continent’s strongest economies.
Future migration and integration policies should aim to reduce the direct and indirect costs of migra-tion. They should also aim to maximise the possible benefits of migration by both reducing wage discrimination and deterring the employment of migrants below their skill levels. Better jobs for migrants will directly translate into higher wages and eventually into higher remittances.
We can assume that the global competition for qualified and
therefore crucial for decision-makers to consider and invest in long-term solutions that can be adapted to meet the changing needs of their economies and societies.
The author thanks Zoltán Bakay and Bernadett Povazsai-Römhild for their support in preparing this paper, and Ramez Abbas, Natalia Banulescu-Bogdan, Thomas Buettner, Susan Fratzke, Stephen Gardner and Michelle Mittelstadt for their helpful comments. An earlier version of this paper was prepared by MPI (Washington DC) for the UN High Level Dialogue on Migration and Development (October 2013).
skilled workers will become stiffer in the next few decades. Europe will have to cope with this. Greater competition will in turn expand the range of employment oppor-tunities for people emigrating from youthful and demographi-cally growing societies. Notwithstanding such opportuni-ties, demographically growing nations must continue their efforts to create jobs at home.
Regardless of the route European governments choose, many poli-cies that address demographic change and the subsequent fun-damental shifts in labour supply require a time horizon well beyond an electoral cycle. It is
REFERENCES
Berlin Institute (2010) Europe’s Demographic Future, Berlin, available at www.berlin-insti-tut.org/fileadmin/user_upload/Europa/Kurz_Europa_e_Map.pdf
Hatton, Timothy and Jeffrey G. Williamson (2002) ‘What Fundamentals Drive World Migration?’ Discussion Paperno. 3559, Centre for Economic Policy Research (CEPR)
International Organisation for Migration (IOM) (2013) World Migration Report 2013, Geneva: IOM Organisation for Economic Cooperation and Development (OECD) (2013) International Migration Outlook
2013, Paris: OECD Publishing, available at www.oecd-ilibrary.org/social-issues-migration-health/international-migration-outlook-2013_migr_outlook-2013-en
PEW Research Center (2012) Net Migration from Mexico Falls to Zero – and Perhaps Less, Washington DC, available at www.pewhispanic.org
UN DESA, Population Division (2012) Trends in international migrant stock: Migrants by destination and origin, United Nations database, POP/DB/MIG/Stock/Rev.2012: New York: United Nations, Department of Economic and Social Affairs, available at http://esa.un.org/MigOrigin/
UN DESA, Population Division (2013a) ‘International Migration 2013: Migrants by origin and destination’,
Population FactsNo. 2013/3. New York: United Nations
UN DESA, Population Division (2013b) World Population Prospects: The 2012 Revision, Volume I: Compre-hensive Tables ST/ESA/SER.A/33, New York: United Nations, Department of Economic and Social Affairs UNFPA (2013) The State of World Population 2012 – By Choice, Not By Chance: Family Planning, Human
Rights and Development, New York: United Nations
World Bank (2013) ‘Migration and Remittance Flows: Recent Trends and Outlook, 2013-2016’, Migration and Development Briefno. 21, Washington DC
© Bruegel 2014. All rights reserved. Short sections, not to exceed two paragraphs, may be quoted in the original language without explicit permission provided that the source is acknowledged. Opinions expressed in this publication are those of the author(s) alone.