by
Christopher Grant Rees, B.Ed (}Ions.)
Submitted in partial fulfilment of the requirement for the degree of Master of Environmental Studies (By Coursework)
Centre for Environmental Studies University of Tasmania
This thesis contains no material which has been accepted for the a ward of any other degree or
diploma in any university, and to the best of the author's knowledge and belief the thesis contains no copy or paraphrase of material previously
ABSTRACI
Seagrasses are marine angiosperms that grow in sheltered coastal and estuarine water bodies. They play a significant role in coastal marine ecology, and are important breeding and feeding grounds for a number of fish species. However, seagrasses are vulnerable to the impacts of some human activities through their sensitivity to reduced light energy. This may be lowered by increased turbidity and sedimentation, or the excessive growth of algal epiphytes in response to raised nutrient levels.
Five seagrass species occur in Tasmania, Amphibolis antarctica (Labill.) Sonder et Aschers.,
Halophila australis
Doty & Stone,Heterozostera tasmanica
(Marten ex Aschers.),Posidonia australis
Hook. f. and Zostera muelleri Irmisch & Aschers., their presence or absence defining five zones around the Tasmanian coast. Most coastal areas were sampled., and seagrass beds located. When sampling these beds, the species, depth, density, substratum and presence of algal epiphytes were recorded. Using available aerial photography from three time periods(circa
1950.�circa
1970 and the present)., seagrass beds in selected areas were digitally mapped into a GIS database using ARC/INFO. The sample site attributes were added to the database, and patterns of distribution and change analysed and mapped.The five seagrass species have distinct zonation patterns and distributions in relation to region.� coastal formation, substratum and depth. An area of approximately 220 km2 was mapped, leading to speculation that from 400 to 500 km2 of sea grass rna y occur in Tasmania. However, the results of the analysis and mapping also indicate significant decline. Total loss has occurred in some areas. Decline is most pronounced in those parts of the State close to centres of human population and activity.
. .. ..
ACKNOWLEDGEMENTS
This project has been made possible by the generous provision of a scholarship and considerable material support from the Tasmanian Department of Primary Industry and Fisheries, Division of Sea Fisheries, and a research grant provided through the National Estate Grants Program.
Essential also to the success of the project have been the contributions made by a number of organisations and individuals. In particular I wish to thank: the Centre for Spatial Information Studies (CenSIS), University of Tasmania, who provided workspace, training and support in the use of ARC/INFO; the Tasmanian Department of Environment and Land Management, Land Information Bureau for access to their aerial photograph library; the Central Science Laboratory, University of Tasmania for training and assistance when exploring the possibility of using Landsat imagery; the Tasmanian Department of Primary Industry and Fisheries, Division of Sea Fisheries for water transport to many parts of the Tasmanian coast; the Tasmanian Department of Environment and Land Management, Parks and Wildlife Service for their interest in the project and access to the Port Davey and Bathurst Harbour area. People in all these organisations have shown nothing but kindness, patience, support and generosity.
I also wish to thank my supervisors Professor Jamie Kirkpatrick, Department of Geography and Environmental Studies, University of Tasmania for the quality of his guidance, and Dr. Howel Williams, Tasmanian Department of Primary Industry and Fisheries, Division of Sea Fisheries whose interest in seagrasses initiated this study, and who organised th� financial and other support provided by the Division. I also want to acknowledge the valuable supervision in the early stages of the project of Dr. Pierre Horwitz1 formerly of the Centre for Environmental Studies, University of Tasmania.
My thanks are also extended to the oyster farmers and fishers who took me sampling, to all those who contacted me with information about seagrasses, to those researchers who gave me so much useful advice and information, and to the staff and students of the Department of Geography and Environmental Studies, University of Tasmania for their help.
CONTENTS
Chapterl Introduction
1.1 Context of study 1.2 Seagrass ecology
1.2.1 The role of seagrasses in coastal marine ecosystems 1.2.2 The structure of seagrass communities
1.2.3 The role of seagrass communities in the ecology of fish 1.3 Seagrasses and coastal management
1.3.1 Seagrasses as environmental indicators
1.3.2 Seagrass habitat protection 1.4 Seagrass decline
1.4.1 Case studies
1.4.2 Causes of seagrass decline
1.4.3 Natural variance in seagrass distribution 1.5 Tasmanian seagrasses
1.5.1 The Tasmanian seagrass flora in a regional context 1.5.2 Tasmanian seagrass species
1.6 This project
1.6.1 Aims
1.6.2 Hypotheses
1.6.3 Scope and limitations
1.6.4 Report structure
Chapter2
The Tasmanian coast and seagrass habitat classification
2.1 Tasmanian coastal climate 2.1.1 Water Temperature
2.1.2 Wind regimes 2.1.3 Air temperatures 2.1.4 Tides
2.2 Tasmanian coastal water quality 2.2.1 Turbidity and pollution 2.2.2 Salinity
2.3 Seagrass habitat description and classification 2.3.1 Sea grass habitat
2.3.2 Habitat classification
2.3.3 Studies classifying Tasmanian coastal habitats 2.3.4 A coastline classification adopted in this study 2.3.5 Description of habitat types
Chapter3
Seagrass mapping
3.1 Seagrass mapping • an overview 3.1.1 Field survey techniques 3.1.2 Remote sensing
3.1.3 Geographic Information Systems (GIS) 3.2 Mapping seagrass community boundaries
3.3 Mapping definition & accuracy
Chapter4
Methods
4.1 Field data collection
4.1.1 Sample areas and zoning 4.1.2 Access
4.1.3 Constraints 4.2 Field data recording
4.2.1 Seagrass presence or absence
4.2.2 Species identification, collection and recording
4.2.3 Depth 4.2.4 Density
4.2.5 Algal epiphyte growth
.4.2.6 Above·sediment shoot length 4.2.7 Substratum type
... :.
4.3 Remotely sensed data
4.3.1
Aerial photograph selection4.3.2
Digitising & data entry4.3.3
Analysis4.3.4
Map production 4.4 Associated data4.4.1
Oral reports 4.5 Beach searching4.6 Data accuracy and reliability
4.6.1
Field sampling errors4.6.2
Mapping errorsChapter 5
Results- Present seagrass distribution in Tasmania
5.1 Species distribution
5.1.1
Amphibolis antarctica
5.1.2
Halophila australis
5.1.3
Heterozostera tasmanica
5.1.4
Posidonia australis
5.1.5
Zostera
muelleri, &Z. muelleri sensu stricto
5.2 Sample area profiles5.2.1
Zone A- North coast and Bass Strait islands5.2.2
Zones B, C and part of D -East coast5.2.3
Zone D -South east5.2.4
Zone E - South coast, south west & west coast5.3 Discussion of present seagrass extent and distribution
5.3.1
The extent of seagrass in Tasmania5.3.2
The distribution of seagrass species in TasmaniaChapter6
Results - Impacts and changes
6.1
Mapping the current and past seagrass coverage6.1.1
Changes in seagrass extent6.1.2 Overiew of seagrass changes in Tasmania 140
6.2 Algal epiphytes 154
6.2.1 Occurrence of algal epiphytes on seagrass beds 154 6.2.2 Occurrence of algal epiphytes on different seagrass species 164 6.3 Correlation of algal epiphyte occurrence and seagrass decline 165
6.4 Other impacts on seagrass beds 168
6.4.1 Damage by boating activities and infrastructure 168
6.4.2 Cygnus atratus-the Black Swan 172
Chapter
7Discussion
7.1 Management and protection 7.1.1 Monitoring
7.1.2 Protected areas 7.2 In conclusion
References
Appendix
I. Aerial photography details
II. Modified double sided anchor dredge
173 173 174 177
179
Tables
Table 1.1: Structural elements in a temperate
Zostera
bed 3 Table 2.1: Classification of brackish and marine waters based on salinity 37 Table 3.1: Classification system for seagrass bed boundary widths and shapesTable4.1 Table 5 .1
Table 5 .2 Table5 .3 Table 5 .4 Table 5 .5
61 Coastal sample areas used in this study 68 Summary of
Amphibolis antarctica
species associations in��� �
Summary of
Halophila australis species associations in samples 91
Summary ofH. tasmanica species associations in samples
94 Summary ofP. australis
species associations in samples 96 Summary of Z. muelleri species associations in samples 101 Table 6.1: Summary of coastal areas mapped, seagrass coverage andchange over time 135
Table 6.2 Relationship in samples between species and epiphyte values 164 Table 6.3 Seagrass loss and algal epiphyte presence in mapped
sample areas 166
Figures
Figure 1.1 Figure 1.2 Figure 1.3 Figure 1.4 Figure 1. 5 Figure 2.1 Figure 2. 2 Figure 2.3
Amphibolis antarcticaJ appearance and distribution Halophila australisJ appearance and distribution Heterozostera tasmanica, appearance and distribution Posidonia australis, appearance and distribution
Zostera muelleri, appearance and distribution
Biogeographical provinces of the Australian coastline Tasmanian mean summer and winter ocean temperatures Major types of coastal landform and codes adopted in this study 19 20 21 22 23 33 34 43 Figure 3.1 ARC/INFO: layering of data related to the coastal outline base
� �
Figure 3.2 Diagram illustrating digitised outline of seagrass bed produced
from remotely sensed image 5 7
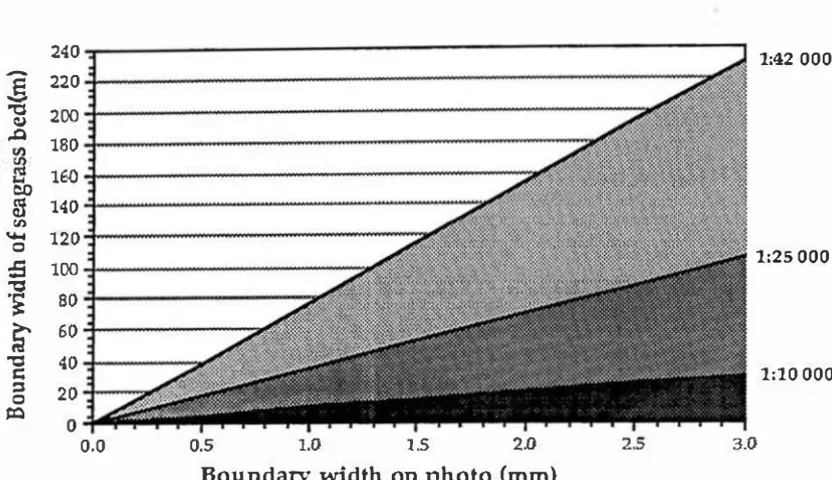
Figure 3.3 Comparison of boundary widths of seagrass beds and
aerial photographs of different scales 64
Figure 3.4 Diagram illustrating the problems of finding adequate control points (tics) for digitising from coastal aerial photographs 65 Figure4.1 Heterozostera tasmanica and Zostera muelleri: rhizome internode
cross-sections, indicating different arrangements of
vascular bundles 7 5
Figure4.2 Crown density scale used to estimate the percentage cover
of seagrass beds 7 6
Figure4.3 Scale of abundance of seagrass detritus on shorelines 85 FigureS . I
Figure 5.2 Figure 5.3
Figure 5.4 Figure 5. 5 Figure 5.6
Figure 6. 1
Figure 6.2
Figure 6. 3
Amphibolis antarctica distributiDn in coastal and substratum types
89
Halophila australis distribution in coastal and substratum types 93 Heterozostera tasmanica distribution in coastal and substratum
��
�Posidonia australis distribution in coastal and substratum types % Zostera muelleri coast type and substratum habitat preferences 98 Zostera muelleri sensu stricto distribution in coastal and
substratum types 10 1
Frequency of epiphyte affected sample areas compared with
total sample areas for each coast type 154
Frequency of algal epiphyte affected samples in different
coast types 155
Frequency of algal epiphyte affected samples compared
with averaged seagrass loss per decade for 20 sample areas 167
Maps
Map 4.1 Tasmania, location of zones A, B, C, D & E 67 Map4.2 North west region, coastal sample areas 1 to 25 70 Map 4.3 North east region, coastal sample areas 25 to 50, 146 to 149 71 Map4.4 South east region, coastal sample areas 53 to 125 72 Map 4.5 South west region, coastal sample areas 126 to 140 7 3
Map5.1 Amphibolis antarctica distribution 90
Map 5.2 Halophila australis distribution 92
Map 5.3 Heterozostera tasmanica distribution 95
Map5.4 Posidonia australis distribution 97
Map5.5 Zostera muelleri distribution 99
Map 5 .6 Zostera muelleri sensu stricto sample distribution 100 Map5.7 Area 3, Duck Bay, present seagrass coverage 10 4
Map 5. 8 Area 4a, West Inlet & area 6a, East Inlet, present seagrass
coverage 10 5
Map5.9 Area 1, Woolnorth to Robbins Island, present seagrass
coverage 10 6
Map5.10 Area 21 & 22, Port Dalrymple (Tamar), present seagrass
coverage 10 7
Map 5.11 Area 146, Parrys Bay (Flinders Island), present seagrass
coverage 10 8
Map5.12 Area 146, Adelaide Bay (Flinders Island), present seagrass
coverage 10 9
Map 5.13 Area 43, Georges Bay, present seagrass coverage 112 Map 5.14 Areas 57 to 60 , Bryans Corner to Moulting Lagoon, present
seagrass coverage 113
Map 5 .15 Areas 67 to 71, Cape Bougainville to Cape Peron, present
seagrass coverage 114
Map5.16 Area 65, Little Swanport, present seagrass coverage 115 Map 5. 17 Areas 77 & 78, Port Arthur, present seagrass coverage 118 Map 5.18 Area 79, Wedge Bay and Parsons Bay, present seagrass
coverage 119
Map 5. 19 Area 73 Blackman Bay, & areas 81- 88, Norfolk Bay, present
seagrass coverage 120
Map5.20 Area 100 , North West Bay, present seagrass coverage 121 Map 5.21 Areas 10 1 & 10 2, Oyster Cove to Deadmans Point, present
seagrass coverage 122
Contents
�rap 5. 22
�rap 5.2 3
Map 5.24
Map5. 25
Map 5.26
Map 5.27 Map 5 .28
Map 5.29 Map 5.30
Map 6.1
Map 6. 2
Map 6.3 Map 6. 4 Map 6.5 Map 6.6
Map 6.7
Map 6. 8 Map 6. 9
Map 6. 10 Map 6.11 Map 6.12 Map 6.13 Map6.14
Map 6. 15 Map 6.16
Map 6.1 7
Map 6.18
Area 10 9, Port Esperance, present seagrass coverage 123
Area 110, Hastings Bay & Southport, present seagrass
coverage 124
Area 119, Isthmus Bay, present seagrass coverage 125
Areas 1 22, Great Taylor Bay & area 1 24, Cloudy Lagoon,
present seagrass coverage 1 26
Updated 10 km distribution of Amphibolis antarctica 129
Updated 10 km distribution of Halophila australis 130
Updated 10 km distribution of Heterozostera tasmanica 131 10 km distribution of Posidonia australis 132 Updated 10 km distribution of Zostera muelleri 133
Seagrass decline in Port Dalrymple (Tamar Estuary) 141
Seagrass decline in Norfolk Bay and Blackman Bay 142
Seagrass decline in Duck Bay 143
Seagrass decline in Port Sorell 144
Seagrass decline in Georges Bay 145
Seagrass decline in Spring Bay 1 46
Seagrass decline in Port Arthur 147
Seagrass decline in Wedge Bay and Parsons Bay 148
Seagrass decline in Pittwater 149
Seagrass decline in Ralphs Bay (south) 150
Seagrass decline in Ralphs Bay (north) 15 1
Seagrass decline in North We&t Bay 15 2
Seagrass decline in the D'Entrecasteaux Channel 15 3
North west Tasmania, sample sites with algal epiphyte cover 15 7
North east Tasmania, sample sites with algal epiphyte cover 15 8
South east Tasmania, sample sites with algal epiphyte cover 161
South east Tasmania, algal epiphyte values of 2 or 3,
& cover of less than 40% 162
South west Tasmania, sample sites with indication of algal
epiphyte values 163
I.
f
I
Plates
Plate 1
Zostera muelleri
habitat in different parts of Tasmania 29Plate2
Posidonia australis
andAmphibolis antarctica
beds in northeast Tasmania 30
Plate3
Amphibolis antarctica
andHeterozostera tasmanica
appearance 31Plate4
Posidonia australis, Heterozostera tasmanica
andZostera muelleri
appearance 32PlateS Examples of landsat imagery indicating seagrass beds 52
Plate 6 Aerial photographic examples of seagrass bed textures
and boundaries 59
Plate 7 Examples of algal epiphytes on seagrasses (a) 79
Plate 8 Examples of algal epiphytes on seagrasses (b) 80
Plate 9 Examples of algal epiphytes on seagrasses (c) 81 Plate 10 Algal epiphytes on
Posidonia australis,
and sample retrievedby dredge 82
Plate 11 Damage to seagrass beds by mooring chains 169
Plate 12 Damage to seagrass beds by mooring chains in
Little Oyster Bay, Kettering 170
�
·.::
· f ; , �· : :-.
Chapter1
INTRODUCTION
"The demise of sea grasses is analogous to the encroachment of deserts on land .
.. "(Larkum
et al. 1989,
p. 823)11lt may not b e until seagrass habitats have largely disappeared that,we are able to
understand the processes that have been responsible for their demise."
(Ward, T.J.
1989,
p.815)
1.1 Context of Study
Se.agrasses are flowering plants, or angiosperms, adapted to living completely submerged in the marine environment (Robertson
1984).
They grow in soft bottomed habitats in the tidal and sub-tidal waters of sheltered and semi-shelteredcoastlines in many parts of the world, including Tasmania.
Seagrasses in Tasmania have not been studied in any great detail, and there are few references to their ecology and distribution. This project is a step towards redressing this information gap. Elsewhere in Australia, and internationally, seagrasses have been the subject of increasing interest and research in recent decades (Larkum
et al. 1989).
This has arisen out of a growing awareness of their importance in the overall ecology of the coastal marine environment, and their sensitivity to human activity.As a background to this study, this chapter looks at the ecology of seagrasses and the status of seagrasses in the context of coastal environmental management. Some case studies are reviewed in considering the causes of seagrass decline. The seagrass species found in Tasmania are described. Finally, the aims of the project and the structure of the thesis are presented.
1.2 Seagrass Ecology
The importance of seagrasses and their role in coastal ecology is discussed here. Seagrass habitat is considered in Chapter 2 (section 2.3).
1.2.1 Role of Seagrasses in coastal marine ecosystems.
Seagrasses play an important role in the ecology of estuarine and inshore marine environments. They provide a habitat for many other organisms, and the communities of which they are the major structural component show a diversity
z�. :j ;_ .
...
and animal abundance comparable to coral reef communities (SPCC 1978). Seagrass beds are known to have many characteristic species of flora and fauna within their communities (den Hartog, 1983). Many of these are epiphytic or epizoic. Ducker
et al.
(1977) list 105 species of algae and 20 genera of animals found growing onAmphibolis antarctica
(La bill.) Sonder et Aschers., and Mayet
al.
(1978) identified 57 species of algae on species of the generaPosidonia
andZostera.
The floristic and faunistic composition of the commun�ties associated with a given seagrass species may vary between habitats.Kirkman(1976) reviewed existing literature describing the functions of seagrasses in coastal ecosystems. In summary, these are:
(1) they are primary producers;
(2) seagrass leaves and/ or rhizomes are food for a small number of primary consumers, such as garfish, swans and sea urchins;
(3) seagrasses provide a substratum for many species of epiphytes and epifauna of comparable biomass to the seagrasses themselves. These are grazed by a variety of vertebrate and invertebrate species;
(4)
large quantities of detrital material are produced by seagrass beds_. and this is often carried some distance from the beds themselves. This provides food for various animal species and microbes;(5) they contributes organic matter to the sulphur cycle. Sulphate reduction fosters microbe growth important in the food chains of a variety of fish; (6) the rhizome mats of some seagrasses bind sediments, and the leaf canopy
baffles water movement. This hinders erosion, and sediments accumulate as particles settle from the slowed water. This can lead to a gradual localised raising of the sediment level (e.g. Pipe Clay Lagoon (Woodward 1985)). Fish larvae, invertebrate larvae and food particles also settle out of the water column; and
(7) juvenile fish and invertebrates are provided with protective cover from predators.
There are additional functions. The baffling action of seagrass leaves and the shelter they provide from predation both contribute to the greater populations and diversity of species in seagrass beds (Kennish 1986). Also, the rhizome mats of some species, such as
Posidonia australis
Hook. f. will continue to hold sediments together long after the death of the seagrasses themselves, and provide a substratum for macroalgal growth (V. Neverauskas 1992, pers comm.). And finally, the considerable quantities of dead seagrass leaves that are washed up on some shorelines trap wind-blown sand, and may play a part in dune formation.1.2.2 The structure of seagrass communities
Although seagrasses themselves form the major structural component in seagrass communities, they are only one element in a highly complex ecosystem. For example, den Hartog (1983), argued against a common view of seagrass communities being
11Simple-structured1 monodominant systems��
( p. 6). He identified sixteen separate structural elements in temperateZostera marina
L. beds (Table 1.1).Table 1.1:
Structural elements in a temperate
Zostera
bed (after: den Hartog 1983, p. 7)(1) The seagrass itself
(2) Epiphytes on the seagrass
(3) Algalfilm on the bottom substrata (4) Mat of loose-lying entangled algae
(S) Endophytes
(6) Immobile epifauna
(7) Free-moving epifauna
(8) Immobile fauna on the bottom
(9)
Free-moving fauna on the bottom(10) Free-moving fauna on the loose-lying algal mat (11) Inf a una
'•
(12) Free-swimming animals, not confined to a special part of the community
(13) Temporary residents (14) Phytoplankton (15) Zooplankton
(16) Microbial communities
Epiphytes play an important role in seagrass communities, and only develop the potential to smother the seagrasses where unnatural nutrient loads are present. In these conditions, it is other marine algal species and not specialised seagrass epiphytes which are involved (den Hartog 1983).
Temperate seagrass beds tend to contain only one seagrass species (den Hartog 1983), and this is generally true of seagrasses in Tasmania. In some locations in Tasmania, however, seagrass beds are mosaics of two or more species occuring in adjacent small monospecific patches, sometimes of only a few square metres in area. Elsewhere, two or more species may occur in narrow monospecific bands along a shoreline, apparently zoned according to depth, or
··�·,.1.
• .. ��; '
.. .,.;.
'\
interspersed with species of macroalgae.
1.2.3 The role of seagrass communities in the ecology of fish
It is clear from the previous discussion that seagrass beds are complex and productive ecosystems in the inshore coastal environment, and that they provide many different niches for the development of a wide variety of flora and fauna. Howard
et al.
(1989) summarised research on faunal assemblages of seagrass communities, and Bell and Pollard (1989) reviewed the ecology of fish assemblages associated with seagrasses, and it is largely from these works that the following points are drawn.There are many gaps in our understanding of the ecology of the majority of faunal species in Australian seagrass beds. Most research has focussed on species of importance to commercial fisheries. The complex communities on which these species depend are poorly understood, even though it is the smaller invertebrates at lower trophic levels that may be most vulnerable to environmental change. The management of seagrass communities therefore requires a much better understanding of their associated faunas.
Generally it can be said that the flora and fauna in a seagrass community are more adapted to the local set of environmental parameters than to a particular species of seagrass. Few fauna species are restricted to a single seagrass species (Howard
et al.
1989). Even some pipefish (Syngnathidae), highly adapted toseagrass habitats, may occur among seagrasses of more than one species (Howard & Koehn 1985).
Some species of fish prey on seagrass fauna, but are not the only, nor necessarily the most significant predator in seagrass ecosystems. Because of the protection offered by the seagrass leaves, the levels of predation are usually less than on surrounding unvegetated areas. Larger crustaceans and wading birds may be equally important predators and have a significant impact on some invertebrate speaes.
Bell and Pollard (1989) distilled from the literature the key points relating to seagrasses and their associated assemblages of fish. These are:
(1) fish in seagrass beds are more diverse and abundant than over adjacent unvegetated areas. In Tasmania, for example, Last (1983) found a greater diversity of species in seagrass fish assemblages than in those on unvegetated sediments;
(2) the amount of time and the phase of life cycle spent associated with seagrass varies for different fish species;
--· . .
(3)
seagrass beds are important nurseries for the larvae of many fish specieswhich settle directly from the plankton. Fish rarely spawn in seagrasses. The larvae obtain food and shelter in their early_. vulnerable growing phases_. and then move on to other coastal habitats;
(4) fish are rarely primary consumers in seagrass beds_. but usually feed on
crustaceans on the seagrasses and in the plankton;
(5)
the location of fish in the seagrass canopy varies between species;(6) the time of day_. and the nature of the surrounding habitat influences the fish present; and_.
(7) fish assemblages from adjacent seagrass habitats are often not similar.
Fish spend different periods of time associated with seagrasses. There are seasonal arrivals and departures from the seagrass community_. and there are species that frequent seagrass beds at certain times of day or tidal phase. Also_. Fish that are found associated with seagrasses tend to be either smaller species than those on bare sediments_. or juveniles of larger species.
Although few adult fish depend greatly on seagrasses for food or shelter_. seagrasses provide the principal shelter for juvenile fish in many estuaries_. without which the numbers of fish surviving juvenile s tages would be greatly diminished (Bell
et al.
1987). Although it is unusual for a fish species to eat fresh seagrass leaves_. in south-eastern Australia both the southern seagarfishHyporhamphus melanochir,
and the rock flatheadPlatycephalus laevigatus
are examples of species that rely on seagrass leaves for much of their carbon source (Nicholset al.
198 5). The luderickGirella tricuspidata
feeds similarly. The seagrasses of that same region are host to many leatherjackets that take bites from seagrass leaves to obtain encrusting fauna and epiphytes.The location of a seagrass bed in a bay or estuary may affect the abundance of fish present. Different species settle in different parts of an estuary. The patchy settlement of larvae and their subsequent distribution within the seagrass beds also influence the abundance and species composition of seagrass fauna (Bell &
Pollard 1989).
Fish populations in estuaries have been shown to decrease with the loss of seagrasses_. but this is not always the outcome of seagrass decline. Many fish species spawn at the mouths of estuaries which means their larvae may well not settle in that particular estuary. Conversely_. those larvae settling in a given area may have come from far afield. Seagrasses may thus have to decline extensively in a region before the impact on fish populations is recognised.
..
In summary, it can be seen that seagrass communities play an important role in the ecology of marine and estuarine coastal waters. Much is still unknown of the complexities of the interrelationships between the flora and fauna in these communities, and it is important that the ,focus of research is not merely on their importance to commercial fisheries.
1.3 Seagrasses and coastal management
A range of land and water based human activities in the coastal zone and related catchments have the potential to affect adversely the diversity of marine flora and fauna through discharges of by-products and wastes. In order to protect the marine environment it is therefore important that a coastal zone approach is adopted to manage jointly any human activity both on land and in adjacent marine areas (Salm & Clark 1984).
Many classes of pollutant have an impact on the marine biota, which may include organisms in seagrass communities, and seagrasses themselves. Amongst these substances are herbicides, pesticides, antifouling paints and agents, petroleum hydrocarbons, phosphates and nitrates from sewage, detergents and fertilisers, heavy metals, and surfactants and dispersants. Additionally impacts are caused by sedimentation and turbidity, discharges of high or low temperature water, and runoff or discharge of high or low salinity water (Kenchington 1990).
1.3.1 Seagrasses as environmental indicators
Because seagrasses are among those types of marine and intertidal vegetation that are sensitive to pollution or its side-effects, and to catchment modification and coastal engineering, they are now regarded as important indicators of the health of the marine coastal environment. For example, a report to the government of Victoria (VIMS 1991) argues for the ongoing monitoring of seagrass communities, as one of a suite of 'Key Indicators' of the marine biota. The concept of 'Key Indicator' refers to species for which any change in health, abundance or distribution might indicate a possible wider change in the complex ecological systems of which they are part (VIMS 1991).
The Victorian report lists a range of marine and coastal activities and processes which may have adverse impacts on the environment (VIMS 1991). Some of these were considered to have a direct and significant influence on both water quality and the marine biota of which seagrasses are an important component. These include the construction and operation of port and marina facilities,
· recreational activities, commercial fishing, catchment use, outfalls, and short term natural processes such as storms . The report states:
..
"Loss of seagrass would be expected to modify the abundance of fish, including a
mlmber that are important components of recreational catches, and also influence directly
or indirectly the abundance of various invertebrate species. Sea grasses are thus biologically
important and politically sensitive"
(VIM:S 1991 p. 29).Two examples of pollutants that impact on seagrasses or the faunal assemblages of seagrass communities are nutrients and heavy metals. The effects of increased nutrient loadings are discussed in some detail below (see Section 1.4). Here the effects of metal pollution on seagrass communities are considered briefly.
Because seagrasses have a strong baffling effect on water movement there tends to be a high rate of sedimentation in seagrass beds. The beds thus tend to accumulate higher levels of metals and organic materials than adjacent habitats (Ward 1989). At least a proportion of the metals in the shallower sediments of seagrass beds are biologically available, which includes uptake by seagrass root systems. Seagrasses are bioaccumulators of metals, that is they absorb and partly retain metals from the surrounding environment. Also, they are to some extent bioconcentrators of metals in their tissue (Ward 1989).
The levels of metals in the leaves of seagrasses have been shown to relate significantly to the concentrations in the sediment and the water column. In the Netherlands and Denmark
Zostera marina
has been used to monitor the levels of Cadmium, Zinc and Lead in the marine environment, and there is strong evidence thatPosidonia australis
could be used as a 'sentinel accumulator' of metals in Australian temperate coastal waters (Ward 1989)Seagrasses themselves seem to be little affected by high levels of metals in the environment, and they are not ideal as indicator species for the impact of metals. However, some species of fauna associated with seagrass communities have significantly reduced populations at contaminated sites. At Port Pirie in South Australia the number of species of fauna, in particular fish, was reduced as contamination increased. The composition of species also changed (Ward 1989).
1.3.2 Seagrass habitat protection
Seagrass communities can best be protected through the establishment and enforcement of strict controls on pollution discharges (especially nutrients) and activities that increase sedimentation. Any specific protection granted to seagrass communities in the form of reserves or habitat of special significance is of limited value unless pollution from adjacent catchments is eliminated, or at . . least controlled. Bell and Pollard (1989) argue that if resources are scarce they are better spent on controlling the processes that lead to seagrass decline than
on other means of protection. However, reserve status is of value in increasing management options, in reducing the risk of mechanical damage by fishing operations, and in raising public awareness of the ecological importance of
seagrass communities.
Two possible mechanisms for protecting seagrasses are their declaration as wetlands, and their inclusion in Marine and Estuarine Protected Areas (MEPA).
1.3.2.1 Wetlands
A number of definitions of the term Wetland are used in the literature, and some of these include permanently submerged marine and est�arine areas. Arthington and Hegerl (1988) include vegetated and unvegetated areas to a depth of three metres below low water spring tide level, and seagrasses surveyed in NSW by West
et al.
(1985) were included as coastal wetlands by Pressey and Harris (1988). In Tasmania, intertidal and sub-tidal communities were included in a reference to coastal wetlands by Kirkpatrick and Tyler (1988).Australia is a signatory to the Ramsar
Convention on Wetlands of International
Importance Especially as Waterfowl Habitat
(Anon. 1975). This convention classifies wetlands of all types and included a number of subtidal and tidal habitats that suitable for seagrasses. These are described in the Convention as 'Marine and Coastal Wetlands', from which potential seagrass habitats are listed below.(1) marine waters - permanent shallow waters less than six metres deep at low tide; includes sea bays, straits;
(2) subtidal aquatic beds; includes seagrasses, tropical marine meadows;
(3) estuarine waters; permanent waters of estuaries and estuarine systems of deltas;
(4) intertidal mud, sand or sand flats;
(6) intertidal marshes, and tidal brackish marshes; and
(7) brackish to saline lagoons with one or more relatively narrow connections with the sea (Anon. 1975).
Australia signed the Convention without reservation in 1974, and it came into force on 21 December 1975. The Agreement's aim is to promote the conservation of wetlands and waterfowl, and to provide for their protection and stewardship. A number of wetlands in Tasmania have been listed, although at present no specific areas of seagrass habitat have been included. The Ramsar Convention
· . does not legally bind governments to prevent ecological damage to wetlands.
Nor does it offer strict protection to declared areas, but rather fosters a policy of
'wise use' (Kriwoken & Haward 1991). Its value in conservation is therefore limited/ although its use as a tool in the protection of seagrass habitat has not been tested in Tasmania.
1.3.2.2 Marine and Estuarine Protected Areas (MEP A)
Marine reserves in Tasmania can be proclaimed under the State's
National Parks
and Wildlife Act
(1970), although changes to the Act in 1992 may require the approval of both houses of Parliament to create a MEP A in future. Fishing activities within a declared marine reserve can be controlled under regulations of theFisheries Act
(1959). Since the Offshore Constitutional Settlement in 1979 and its enabling legislation theCoastal Waters (State Powers/State Title) Acts
(1980), only the Commonwealth Government has power only to protect the sea and seabed outside a three nautical mile boundary from the low water mark (Kriwoken & Haward 1991). Since seagrasses are almost wholy contained within that boundary, Commonwealth jurisdiction is not relevant to seagrass protection in Tasmania.Prior to 1991, Tasmania had 15 MEP As principally for the protection of habitat for wading birds, and 10 further wetlands with the limited protection offered under the RAMSAR convention. Marine habitats and ecosystems were not protected.
Coastal areas in Tasmania were surveyed in 1981 and 1984 to select suitable sites for establishment as marine reserves (Edgar 1981, 1984b). It was proposed that representative reserves for each biogeographic province should be protected (Edgar 1984b). In 1989 these studies were used in conjunction with guidelines from the I.U.C.N. on MEP As (Kriwoken & Haward 1991). In the initial phase of the Tasmanian program, four reserves containing representative Maugean inshore marine communities were identified for declaration. These are located on the east and south east coasts, and include three small areas of scientific or recreational interest (Governor Island off Bicheno; Ninepin Point and Tinderbox in the D'Entrecasteau Channel), and one larger area on the western coastline of Maria Island. This reserve was to include Chinamans Bay which provides habitat for significant areas of
Amphibolis antarctica
andHeterozostera tasmanica
(Martens ex Aschers.). During the consultation process Chinamans Bay was excluded from the reserve due to pressure from recreational fishing interests. This was conditional on suitable substitutes being found elsewhere. It is hoped that this study will facilitate the identification of a number of such areas.:•
:rli
... · ·
-1.4 Seagrass Decline
1.4.1 Case studies
Although prior to this project no work had been done in Tasmania looking at changes in seagrass distribution, there have been a number of studies elsewhere in Australia. These have documented the decline of seagrasses in particular areas, and have attempted to provide causal explanations linking this loss to natural and human activities. These areas include Cockburn Sound in Western Australia, the eastern shore of Gulf St. Vincent off Adelaide and its suburbs in South Australia, Western Port in Victoria, and Botany Bay in New South Wales.
In reviewing these case studies and the causes they suggest for seagrass decline Shepherd
et al.
(1989) proposed a"unifying hypothesis"
to explain seagrass loss, namely:" . . that a reduction in the light reaching seagrass chloroplasts precludes effective
seagrass photosynthesis".
Such a reduction can occur through
" . . increased turbidity arising from living or non-living particulates in the water, or
increased shading by the deposition of silt or the growth of epiphytes
onleaf surfaces
orstems"
(Shepherdet al.
1989, p. 382).Other mechanisms may be involved in specific cases. These may include: overgrazing of seagrasses by urchins, the relationship between epiphytes and the epifauna grazing on them, the effects on the populations of epifauna from nutrient rich and/ or toxic effluents, a disruption to carbon and nutrient uptake by seagrass leaves by sediment deposition and epiphytes, changes in the redox potential of sediments, and effluents in the water column that are toxic to the seagrasses themselves (Shepherd
et al.
1989).In a number of cases, once the loss of seagrass has begun, the decline has become self-perpetuating. This process has been termed
"auto-catalytic"
by Larkum (1976). Examples of such autoMcatalytic decline occur in the case studies below.In some cases of decline, the naturally occurring blowouts that occur in seagrass beds in some regions have become a focus of the dieback. These blowouts usually migrate towards the prevailing swell, the bare sediment being recolonised .. at the same rate it is being exposed at the other edge of the bed (Clarke & Kirkman 1989). In Holdfast Bay, South Australia, the blowouts are reworked
on average every 95 years under normal conditions, but in recent decades have shown an autocatalytic decline (Shepherd
et al.
1989).The following case studies are only briefly outlined, but lend support to the central hypothesis concerning seagrass decline proposed by Shepherd and his co-authors. They may also indicate possible causes of decline in Tasmanian seagrasses.
1.4.1.1 Cockburn Sound- Western Australia
Over a 16 year period from 1962 to 1978 around 97% of the seagrass meadows were lost from Cockbtun Sound (Cambridge & McComb 1984). The species found in the Sound include four of the genus
Posidonia,
and two of the genusAmphibolis.
Some possible causes for the decline were suggested and/or investigated, but rejected. These included disease, local salinity change, temperature change and altered water movement (Shepherdet al.
1 989). More likely causes stemmed from the heavy industrial development which had occurred on the shores of the Sound, commencing in the mid 1950's and coinciding with the onset of seagrass dieback. These industries include a steel mill, an oil refinery, a superphosphate plant, an ammonium nitrate plant and other metal industries. Additionally, a sewage treatment works at Woodman Point towards the north of the Sound began discharging waste in the mid 1960's. The greatest rate of loss occurred from 1969 into the 1970's, coinciding with a considerable rise in the levels of nitrogen entering the water column.It was shown that the increased nutrients entering the water were enhancing the growth of epiphytic algae on the seagrass leaf surfaces (Silberstein
et al.
1986). The epiphyte cover is expressed as chlorophyll a (j..tg cm-2leaf area). When corrected to allow for the lower epiphyte load on new leaf growth, the light had been reduced by 63% in deteriorating beds and only 35% in healthy beds (Shepherdet al.
1989). Similar 'loose-lying accumulations of filamentous algae' to those found ·on thinning seagrasses in Cockburn Sound were also a common occurrence in this study of Tasmanian seagrasses in many of the bays and estuaries close to human habitation (see Chapter 6).1.4.1.2 Western Port- Victoria
Another case of catastrophic seagrass decline has been monitored in this large coastal inlet 50 km south of Melbourne opening into Bass Strait. Western Port has an area of 680 km2, 37% of which was covered with seagrass and macroalgae ·.in the early 1970's (Bulthuis 1981). The dominant species was
Heterozostera
tasmanica.�
withAmphibolis antarctica, Zostera muelleri
Irmisch & Aschers. andvarious macroalgal species, principally
Caulerpa cactoides,
also present in large stands.By 1984 the area covered by these plants had reduced from 250 km2 to 72 km2 , a loss of 71 %. The greatest decline was in the
H eterozostera tasmanica
beds where some 90% was estimated to have disappeared (Shepherdet al.
1989). Other species showed a much lower decline. The die back was most evident on the intertidal mudflats which became denuded of vegetation, with those stands in the sandy dendritic channels from the most part surviving, albeit suffering from a loss in biomass per unit area.The potential causes of the decline, as in Cockburn Sound, were many. The land surrounding Western Port has been subject to agricultural, industrial and urban development, with attendant runoffs. The waterways experience recreational, fishing and shipping activities. However, because water bodies elsewhere in the state have a greater level of these activities and developments yet still sustain healthy populations of
Heterozostera tasmanica
(eg. Corio Bay), an explanation for the decline in Western Port had to be sought elsewhere.The seagrasses in Western Port were seen to collect a fine coating of mud on their leaves due in part to an increased level of suspended solids in the water. This mud coating blocks out the light and thus reduces photosynthesis. It has been hypothesised that the reduction in light and the higher temperatures experienced by the seagrasses on the intertidal mudflats combine to overstress them, causing their death. Sea grasses in the channels are exposed to swift currents which prevent the mud from adhering. Once the mud banks become denuded of seagrass they are subject to erosion which further increases the suspended solids in the water, thus the
p
rocess becomes self-perpetuating and the die back continues (Shepherdet al.
1989).This autocatalytic mechanism has not been fully tested, and undoubtedly other secondary factors have contributed to this example of seagrass loss.
1.4.1.3 Gulf St. Vincent - South Australia
The eastern shore of the Gulf St. Vincent provides a semi-sheltered shallow habitat colonised by extensive beds of seagrass. The rapid development of the coastline in the region of Adelaide and its northern and southern suburbs, with the attendant increasing discharges of industrial and sewage wastes has had considerable impact on these seagrass communities in the last few decades. This decline has been well documented in studies such as Shepherd (1970), Steffensen (1979), and Neverauskas (1985a, 1985b, 1987a, 1987b). Over 5 000
· . hectares had been lost by the middle 1980s between Marino further south and
··� \ . Chapter 1. Introduction
! l'
·I
�I
ri
�
I
ti
rl
!:I
Bolivar to the north of Adelaide.
Three species of the genus
Posidonia
are found in this region,P. angustifolia
Cambridge & Kuo,P. sinuosa
Cambridge & Kuo andP. australis
(of which onlyP. australis
is found in Tasmanian waters). These, plusAmphibolis antarctica,
occurred to depths of 15 m, withHeterozostera tasmanica
dominating the intertidal flats in the northern part of this section of coast (Shepherd etal.
1989).The patterns of seagrass decline in some places closely mirror the dispersal patterns of the sewage sludge from outfalls at Port Adelaide and Glenelg, and Fork Creek at Bolivar. A similar pattern was documented around a cannery waste outfall at Port Lincoln. These losses have been attributed to the combined factors of nutrient induced epiphytic growth, plus increased sedimentation and turbidity due to ongoing seagrass loss. This secondary mechanism appears to be responsible for the continuing decline. Coastal engineering works such as the Outer Harbour breakwater, pipeline construction for the Port Adelaide sewage outfall and marina construction at North Haven have also caused losses due to sedimentation and increased turbidity.
1.4.1.4 Botany Bay- New South Wales
Botany Bay is a coastal embayment of approximately 4 600 ha situated immediately south of Sydney. It is surrounded by considerable industrial, residential and commercial development, including an oil refinery and Sydney's international airport. The Georges River also flows into the bay. There is a high level of nutrient enrichment of the water from sewage disposal and urban runoff, and parts of the bay have been dredged regularly to facilitate the movement of large ships.
Posidonia australis, Halophila ovalis
(R. Brown) Hook. andZostera capricorni
Aschers. are seagrasses found in Botany Bay, and their changing distribution has been studied by Larkum and West (1983) and discussed by Illert and Reverbi (1986). The stands ofPosidonia australis
had by 1986 lost about 58% (257 ha) of the area they covered in 1942, being replaced in places byZostera capricorni.
By 1987 the continuous bed ofP. australis
had been reduced to a number of fragments (Larkum & West 1990). Changes were detected using historical aerial photography spanning the years 1930 to 1985, field observations, and sediment coring to detect oldP. australis
root mats.The factors considered responsible for this decline include: high nutrient levels
·� entering the bay from the Georges River and elsewhere causing increased epiphyte growth; dredging of the bay's mouth, leading to increased wave action and
sediment erosionj two severe storms in the 1970's to which the beds were now more vulnerable; and, an increase in the population of the sea-urchin
H eliocidaris
eryhogramma
which grazes on the seagrass (Shepherdet al.
1989).1.4.2. Causes of seagrass decline
The case studies above and other research suggest a number of processes attributable to human activity by which seagrass beds can be reduced in size and health, or destroyed completely. It is useful to summarise these and other agents that can cause damage. These include:
(1) reducing the available light by blanketing the seagrasses with an excessive load of epiphytes. This is caused by an increased nutrient load in the water column. Nutrients may originate from a variety of sources, including agricultural fertiliser run-off, industrial and domestic effluent, and all sources of sewage such as treatment plant outfalls, septic systems leaching into the water table, aquaculture and boats at anchorage. Borum (1985) demonstrated a 50- to 100-fold summer increase in epiphyte biomass on
Zostera marina
along a nutrient gradient. This nutrient originated principally from domestic and industrial effluenti(2) reducing the available light by increased turbidity in the water. This is caused by an increase in solids suspended in the water column. Sources of solids include topsoil from agricultural activities and forestry, erosion due to coastal engineering and dredging (Taylor & Saloman 1968). Sedimentary particles are also progressively released as seagrass beds decline. Phytoplankton blooms resulting from eutrophic conditions may have a similar effect on light attenuationi
(3) mechanical damage due to dredging, and boat anchorages (Lukatelich
et al.
1987). Digging mud worms for bait also falls into this category (Luck 1990)i and( 4) toxic effluents.
Other apparently natural mechanisms may be indirectly attributable to ecosystem damage caused by other human activities. One example is the activity of burrowing crustaceans causing dieback by covering seagrass leaves with silt. Suchanek (1983) researched the activity of species of ghost shrimp
(Calianassa
spp.) in seagrass meadows whose considerable population increase may have been due to the reduction of predators by over-fishing. It was found that up to 2.6 kg/m2/day of sediment was ejected out of small volcano-like mounds, and '·that seagrass productivity and density in the area was negatively correlated tothe density of
Calianassa
mounds.·.·
,.
. . '
..
.
.. ··
.. '
1.4.3 Natural variance in seagrass distribution
There are cases of small and large changes in seagrass distribution that have not been directly attributable to human activity. One example is the 'wasting disease' that almost brought to extinction the entire population of the species Zostera
marina in the North Atlantic (den Hartog 1983). Similarly, Orth and Moore (1983) using aerial photography of the Rappahannock River, Virginia, U.S.A., demonstrated significant regrowth of Z. marina and Ruppia maritima L. between 1937 and 1968 after die-back at the time of the 'wasting disease'. This was again followed with a complete decline by the late 1970's. The cause of the 'wasting disease' is still the subject of speculation, but may have been the result of a cyclical combination of factors including a rise in sea temperatures (Larkum & den Hartog 1989). Kerr and Strother (1990) studied Zostera muelleri over an 18 month period in Victoria and found seven-fold and forty-fold changes in a hove ground biomass at two sites between summer and winter.
In Tasmania, cyclical changes in bioma ss have been described in some areas by local observers, and these can be confirmed with archival aerial photography. Examples include the recent rapid proliferation of Heterozostera t asmanica in Cloudy Lagoon, and mild cycles in the density of the same species in Blackman Bay and Southport Lagoon.
It is likely therefore that there is an inherent cyclical variation in the biomass and area covered by seagrass populations (King & Hodgson 1 986), which only long-term studies can reveaL More rapid biomass losses may be caused by damage from severe storms.
The examples discussed above suggest that there are natural patterns of change in seagrass biomass and distribution which must be distinguished from those attributable to human activity. In reality, because of the human pressures on the coastal zone in most places that seagrasses occur, the presence of pollutants in even the most remote parts of the ocean, and the large-scale climatic changes our species is causing, it is not possible to say more than that natural cycles exist. Their rhythm and origins are, in probability, corrupted. However, long term studies can reveal their shadows amongst the trends related to any ongoing human impact.
1.5 Tasmanian seagrasses
The distribution of seagrasses around Tasmania is the major focus of this study, .. and it is useful to place the biogeography of the State's seagrasses in the wider
Australasian picture .
··
-.· ..
1.5.1 The Tasmanian seagrass flora in a re
gi
onal contextAustralia has a rich seagrass flora, with eleven genera represented It has more species than any other continent, eighteen of them endemic, and sixteen of these found in temperate waters. It is probable that the seagrass species of Australia represent a relict flora that has a voided the extinctions suffered elsewhere on the planet. Much of this diversity, however, is found in tropical waters and on the west coast, with a tendency for the number of species to reduce from north to south down the eastern seaboard, and from west to east along the southern coast. Tasmania thus has the lowest number of species of any part of Australia.
The theoretical and research findings relating to Australian seagrass biogeography have been summarised by Larkum and den Hartog (1989). These researchers divide Australian temperate seagrasses into five groups based on their geographical distribution. Tasmanian seagrasses fall into three of these groups:
(1) those present in all temperate regions including the east coast of Australia (Two species,
Heterozostera tasmanica,
andPosidonia australis.
Both are found in Tasmania);(2)
those restricted to the west coast and the Great Australian Bight (and in some cases Victoria) (Eleven species represented only byAmphibolis
antarctica
in Tasmania); and(3) those with very restricted distribution on the southern coast of Australia, mainly in Victoria and Tasmania but sometimes extending to South Australia and into N.S.W. (Two species,
Halophila australis
Doty & Stone andZostera muelleri.
Both are found in Tasmania).Of Tasmania's five species, three represent genera that are endemic to the temperate waters of Australia. These genera are
Posidonia, Amphibolis
andHeterozostera,
and of these the speciesPosidonia australis
andAmphibolis antarctica
occur in Tasmania at the southerly limit of their distribution. Both appear to be confined to the north coast and Bass Strait islands with only scattered patches of
A. antarctica
at a handful of sites on the Tasmanian east coast (Edgar 198t 1984b). Of the three genera, onlyPosidonia
has a northern hemisphere species,P. oceania
found in the Mediterranean.H. tasmanica
has been recorded in several locations on the coast of Chile (Phillipset al.
1983; Gonzalez & Edding 1990).It is likely that these genera had a wider distribution around the coasts of ··Gondwana in the Palaeocene era, and only avoided extinction in the relative stability of the Australian coastal environment since that time. Their confinement
to the southern coasts of Australia has probably resulted from the slow northward drift of the continent into wanner tropical waters since the break-up of Gondwana.
The other two genera found in Tasmania, Halophila and Zostera have species in warmer, more northerly Australian regions and a wide global distribution (Larkum and den Hartog 1989).
1.5.2 Tasmanian seagrass species
This study has looked at the distribution of the five species of temperate seagrass found in Tasmania. These are:
Amphibolis antarctica (La bill) Sender et Aschers.
Halophil a australis Doty & Stone
Heterozostera tasmanica (Marten ex Aschers.) Posidonia australis Hook. f.
Zostera muelleri Irmisch & Aschers.
The classification adopted by Robertson (1984) places them thus:
Division Magnoliophyta Cronquist, Takhtajan & Zimmerman (Angiospermae)
Class Liliopsida Cronquist, Takhtajan & Zimmerman (Monoctyledonae)
Subclass Alismatidae Takhtajan (Helobiae of Fluviales)
Of the five orders in the Alismatidae, two are represented in southern Australia, the Hydrocharitales (Halophila spp.) and the Potamogetonales (Amphibolis spp.,
Heterozostera sp., Posidonia spp. & Zostera spp.)
Species from the genera Ruppia and Lepilaena (also included in the order Potamogetonales) have not been considered in detail in this study, an exclusion made principally to contain the scope of the project to coastal waters. These species can extend from brackish into fresh water, including inland waters such
as swamps and lakes (Robertson 1 984; Hughes & Davis 1989). The two genera Ruppia and Lepilaena are not included as seagrasses in Larkum and den Hartog (1989), but are described by Robertson (1984) as marine annuals, L marina being found in the eulittoral zone in association with Zostera muelleri, and occasionally subtidally.
Ruppia maritima� R. polycarpa and R. megacarpa are described by Hughes and Davis (1989) as occurring in a number of estuaries around the state. In the , _present project, Ruppia spp. were recorded when found growing in association
with seagrass species.
I.
No other seagrass species has been identified in Tasmania prior to this study, although Kuo and McComb (1989) include Tasmania in the range of
Halophila
ovalfs
(R. Br.) Hook, and this is theHalophila
species described by Edgar (1984b) as occuring in the D'Entrecasteaux Channel. It appears that the species may in fact beH. australis.
No other reference could be found for this species' presence. It remains possible thatH. ova/is
and perhaps other species ofPosidonia
might occur in the extensive seagrass communities of the Bass Strait and �slands.The most comprehensive account of Tasmanian seagrass distribution to date was given by Hughes and Davies (1989). This work represents the compilation of a number of references to seagrasses in the State, including herbarium records and limited field work on the part of the author
(J.
Hughes, pers. comm. 1992). Last (1983), and various studies by Edgar (1981, 1984a, 1984b) were referred to by Hughes in addition to personal accounts. Distribution maps were produced for each of the species (see below). A part from the works of these three researchers, references to seagrasses in Tasmania are rare. Any research references and oral accounts are included in my results (Chapters 5 and 6) in conjunction with the relevant coastal area.Some major attributes of the five species, all rhizomatous perennials, are given below:
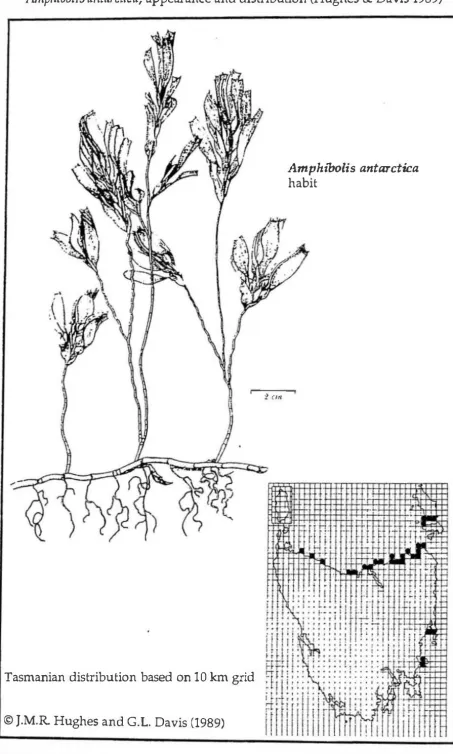
1.5.2.1
Amphibolis antarctica
(La bilL) Sonder et Aschers.This species is found growing in sand or mud below the high tide level and rarely deeper than 12 m (Shepherd & Rqbertson 1989). The rhizomes branch frequently and send up numerous wiry, erect, much branched stems from 0.2 m to 1.5 m talL The branch ends support tufts of 8 to 10 leaves, with the annular scars of the old leaves clearly visible on the branches and stems. The leaves are up to SO nun long and are usually twisted through 180 degrees along their
length (see Figure 1.1).
Amphibolis antarctica
can form extensive dense stands, and is able to tolerate turbulent and moving waters. In common withHeterozostera tasmanica
andHalophila australis,
the species is considered a pioneer following a perturbation (Shepherd & Robertson 1989).The tall, woody stems of
A. antarctica
can support a large load of macroalgal epiphytes. This makes it more vulnerable to shading than species with shorter lived leaf blades (Shepherdet al.
1989). Epiphytes show a clear pattern of._distribution on the stems and leaves of this species, with bryozoans and hydroids found more commonly attached to the lower part of the stem, and macroalgae
Figure 1.1
Amplzibolis a11tarctica,
appearance and distribution (Hughes & Davis 1989)Amphi'bolis antarctica
habit
Tasmanian distribution based on 10 km grid
· . © J.M.R Hughes and G.L. Davis (1989)
Chapter 1. Introduction
;I I ' !' i
I
lj
I
l' '
I
,, lj
I·
Figure 1.2
Halophila australis,
appearance and distribution (Hughes & Davis 1989)a
Halophila australis
(a)
transverse section of rhizome(b)
habitTasmanian distribution based on 10 km grid
· © J.M.R. Hughes and G.L. Davis (1989)
n
R"
�
�
�
ftr
l
I : I I
I . ; :
I
, , ..
• I I
. . ' I
i'U
t l
l l
.,..
•
R
fP
H-;
i
·;
-�
! IT
i
IT}
II<
��
lo-[J
w.
�
Chapter 1. Introduction
I .,
I
�
Figure 1.3
Heterozostera tasmanica, appearance and distribution (Hughes & Davis 1989)
Heterozostera tasmanica
(a) habit
{b) transverse section of rhizome with 8 vascular bundles
Tasmanian distribution based on 10 km grid!
· © J.M.R Hughes and G.L. Davis (1989)
Chapter 1. Introduction
'
!
,.
),
I
·�··· '
>. t
...
'!..
.
[image:35.596.48.522.65.821.2]•. :
Figure 1.4
Posid()Jlia australis,
appearance and distribution (Hughes & Davis 1989)Posidonia australis habit
2 cm
Tasmanian distribution based on 10 km grid
© J.M.R Hughes and G.L. Davis (1989)
!�
%i
}
<
.
:
.
-
:
.
:
��--�---.
);
,y.:: Chapter 1. IntroductionFigure 1.5
Zostera muelleri, appearance and distribution (Hughes & Davis 1989)
I mm
· © J.M.R Hughes and G.L. Davis (1989)
Zostera muelleri
(a) transverse section of rhizome showing 2 vascular bundles (b) habit
Chapter 1. Introduction
' •
.
dominating the stem apex. The apex can support some 80% of the biomass of macroalgal epiphytes (Borowitzka & Lethbridge 1989). A. antarctica is thus very susceptible to smothering by epiphytic algal growth due to nutrient enrichment
1 .5.2.2 Halophila australis Doty & Stone
The species is easily recognised by its delicate light-green translucent leaves (see Figure 1.2). H. australis prefers calm sheltered waters, and tolerates a wide range of substrata, including unstable sediments (Hughes & Davis 1989). It is often found growing in conjunction with other seagrasses, and to a depth of 10 m, though occasionally over 15 m (see Chapter 5).
Species of the genusHalophila could be classed as opportunist plants, and regularly produce vegetative structures and flower frequently (Larkum & den Hartog 1989). They are often the first recolonisers of suitable habitat after a perturbation.
1 .5.2.3 Heterozostera tasmanica (Marten ex Aschers.)
The vegetative shoots may reach over 50 em high, and with age become brown
and wiry. This wiriness does not occur in Zostera muelleri, and is one way to separate the species. The leaves are bright green and grass-like, growing in a tuft from the shoot. They are linear, usually 2-3 mm wide and up to 35 em long
(see Figure 1.3).
H. tasmanica is most common in sheltered marine habitats including offshore areas where it may occur beyond 15 m depth. It forms large stands in shallow bays, and it also penetrates into brackish environments. The species favours sandy and muddy substrata below low tide, although it can tolerate limited exposure (Hughes & Davis 1989).
1 .5.2.4 Posidonia australis Hook. f.
Of its genus, only Posidonia australis has been recorded in Tasmanian waters. The species is limited to Bass Strait including the Furneaux and Kent groups of Islands, and the lower reaches of the Tamar Estuary. It has a broad flat leaf (1 0-15 mm), growing up to 45 ern in length (see Figure 1 .4). It grows su btidally
in the clear water of sheltered estuaries and bays to a depth of 1 0 m, favouring a sandy substratum (Hughes & Davis 1 989), and may cover many square kilometres.
·Posidonia leaf blades support lower standing crops, and of much smaller algal