Plant and Soil 0: 1–11, 2004.
© 2004Kluwer Academic Publishers. Printed in the Netherlands. 1
Short-term nitrous oxide emissions from pasture soil as influenced by urea
level and soil nitrate
S.O. Petersen
1,3, S. Stamatiadis
2& C. Christofides
21Danish Inst Agricultural Sciences, Department Agroecology, Research Centre Foulum, Denmark. 2GAIA
Environmental Research and Education Centre, Soil Ecology & Biotechnology Laboratory, Kifissia, GR. 3Corresponding author∗
Received . Accepted in revised form
Key words: denitrifying enzyme activity (DEA), dissolved organic carbon, GC-IRMS, nitrous oxide, osmotic potential, potential ammonium oxidation (PAO), urea
Abstract
Nitrogen excreted by cattle during grazing is a significant source of atmospheric nitrous oxide (N2O). The
regu-lation of N2O emissions is not well understood, but may vary with urine composition and soil conditions. This
laboratory study was undertaken to describe short-term effects on N2O emissions and soil conditions, including
microbial dynamics, of urea amendment at two different rates (22 and 43 g N m−2). The lower urea concentration was also combined with an elevated soil NO−3 concentration. Urea solutions labelled with 25 atom%15N were added to the surface of repacked pasture soil cores and incubated for 1, 3, 6 or 9 days under constant conditions (60% WFPS, 14◦C). Soil inorganic N (NH+4, NO−2 and NO−3), pH, electrical conductivity and dissolved organic C were quantified. Microbial dynamics were followed by measurements of CO2evolution, by analyses of membrane
lipid (PLFA) composition, and by measurement of potential ammonium oxidation and denitrifying enzyme activity. The total recovery of15N averaged 84%. Conversion of urea-N to NO−3 was evident, but nitrification was delayed at the highest urea concentration and was accompanied by an accumulation of NO−2. Nitrous oxide emissions were also delayed at the highest urea amendment level, but accelerated towards the end of the study. The pH interacted with NH+4 to produce inhibitory concentrations of NH3(aq) at the highest urea concentration, and there
was evidence for transient negative effects of urea amendment on both nitrifying and denitrifying bacteria in this treatment. However, PLFA dynamics indicated that initial inhibitory effects were replaced by increased microbial activity and net growth. It is concluded that urea-N level has qualitative, as well as quantitative effects on soil N transformations in urine patches.
Introduction
For Western Europe it is estimated that, on average, 8% of total N excreted by dairy cattle is deposited on pastures (IPCC, 1997). Nitrogen intake and excre-tion is influenced by factors such as lactaexcre-tion stage, pasture quality (clover percentage, N concentration) and feed composition. Excess N is mainly excreted as urea in the urine, i.e., the proportion of urea-N in-creases with total urinary N concentration (Petersen
∗FAX No:+45-8999-1619.
E-mail: soren.o.petersen@agrsci.dk
et al., 1998). In pasture soil, urea is completely hydro-lyzed within 24–48 h, and subsequent transformations of NH+4 and NO−3 via nitrification and denitrifica-tion make urine patches a potentially important source of N2O (e.g., Clough et al., 1998; Monaghan and
Barraclough, 1993; Yamulki et al., 1998).
The regulation of nitrification and denitrification in urine patches is not well understood, and N2O
emissions may result from a combination of sev-eral factors, including elevated soil moisture, stresses caused by dissolved ammonia, NH3(aq), and/or low
osmotic potential, and elevated oxygen demand due to carbon leakage from scorched roots and possibly
UNCORRECTED PROOF!
lysed microorganisms (Monaghan and Barraclough, 1992; Richards and Wolton, 1975; Stark and Fire-stone, 1995). If denitrification is restricted by NO−3 availability, then overlapping urine patches with NO−3 from a previous deposition could have elevated rates of N2O emission.
This laboratory study was conducted to investigate the short-term turnover of urea in pasture soil under typical summer grazing conditions. A wide range of variables were monitored for characterization of the physicochemical environment, N transformations and associated microbial dynamics in urine patches.
Materials and methods
Soil for the laboratory study was sampled in late May from an 8-yr old grazed pasture near Research Centre Foulum in Denmark (55◦52 N, 9◦34 E); the area sampled had not been grazed since the previous autumn. The sandy loam soil (Typic Hapludult) con-tained 2.7% C and 0.18% N, the pH(H2O) was 6.3, and
total CEC was 87 cmol kg−1. Soil (0–20 cm depth) was sieved (< 4 mm) to remove roots and stones. Gravimetric soil moisture was 15.2%, or 80% of field capacity (FC). The soil was stored for a week at 4◦C, and then at the incubation temperature (14◦C) for 24 h before initiation of the experiment.
Experimental set-up
In the experiment, solutions of urea labelled with 25 atom%15N were added to repacked soil cores at a rate of 4 L m−2. The treatments were: (i)CTL(0 g N L−1); (ii)LU(5 g urea-N L−1); (iii)HU(10 g urea-N L−1); (iv)LUN (5 g urea-N L−1+50µg NO−3-N cm−3); and (v) NO−3 only (50µg NO−3-N cm−3). Treatment (v) was only used for respiration measurements and final soil analyses.
One day before the experiment was initiated, soil portions of 100 g (dry wt. equivalent) were weighed out, and soil moisture adjusted to 46% water-filled pore space (WFPS) by drop-wise addition of distilled water or a KNO3solution. Each sample was mixed,
transferred to cylinders (internal diameter, 44 mm), and packed to a bulk density of 1.2 g cm−3. Urea solutions or water was added dropwise to the appropri-ate cylinders, which were subsequently sealed at both ends with Parafilm that was perforated with a needle to facilitate gas exchange. All treatments were prepared in triplicate for each of four sampling times (1, 3, 6 and
9 d) and incubated at 14◦C. The final moisture content of all treatments was 60% WFPS, and the two urea amendment levels corresponded to 22 and 43 g N m−2, respectively. The total of 51 samples, including three replicates with NO−3 only for the last sampling, were weighed at regular intervals during incubation; water loss was negligible (∼0.2 mL).
Sampling
Carbon dioxide and N2O evolution rates were
determ-ined after c. 0.2, 0.5, 1, 3, 6 and 9 d. Three replic-ates from each treatment were randomly selected and transferred to 1 L gas tight containers equipped with a septum for gas sampling. Carbon dioxide was ana-lyzed at to and again after 60 min. At this time, 13 mL headspace gas was transferred to evacuated exetainers for isotope ratio mass spectrometry (IRMS) analysis of14+15N2O and14+15N2. At the four last samplings,
the replicates used for gas flux measurements were then destructively sampled for determination of pH, electrical conductivity (EC), dissolved organic carbon (DOC), inorganic and total N, and phospholipid fatty acid (PLFA) composition. Soil for total N determ-ination was wetted with NaH2PO4 (0.5M, pH 4.3)
to prevent NH3 volatilization during air-drying. On
day 3, soil was also sub-sampled for determination of potential ammonium oxidation (PAO) and denitrifying enzyme activity (DEA). These assays were assumed to reflect the metabolic capacity for each process at the time of sampling.
Analytical techniques
Urea solutions were prepared from a 99 atom% stock (Eurisotop, Saint Aubin, France) and unlabelled urea. Carbon dioxide was analyzed by a HP-P200 port-able GC equipped with a thermal conductivity detector and a Poraplot Q column using He as a carrier gas. Nitrous oxide concentrations and 15N-N2O were
de-termined using a continuous flow triple collector iso-tope ratio mass spectrometer linked to a GC and with automated cryogenic pre-concentration (ANCA-TGII system, IRMS, PDZ Europa). The sample initially passed through a water and CO2 trap. Nitrous oxide
forδ15N. The lab standard used was 50 ppm N2O in
N2(δ15N-N2O = −0.9872). Overall precision
(ma-chine error plus sample preparation error) for nitrogen isotopic composition was 0.37.
An automated combustion elemental analyzer in-terfaced with an IRMS (ANCA-SL system) was used to measure total nitrogen content as well as the ni-trogen isotopic composition of soil samples (14 ± 0.1 mg). Samples were prepared as described in Schepers et al. (1989). Sharpsburg silty clay loam (δ15N = 10.647) was used as the soil work-ing standard. Overall precision (machine error plus sample preparation error) for nitrogen isotopic com-position was 0.3–1.
Ammonium and NO−2 were determined colorimet-rically and NO−3 by ion chromatography (Keeney and Nelson, 1982). Isotopic composition of NH+4 and NO−2+NO−3 was determined by IRMS after micro-diffusion (Sørensen and Jensen, 1991). However, the results for 15N-NH+4 were not reliable due to in-strument overload and had to be estimated (see next section).
DOC was extracted in 0.5MK2SO4(Vance et al.,
1987) and filtered extracts analyzed on an DC-180 Carbon Analyzer (Dohrmann, Xertex). pH and EC was measured in 1:1 soil:water mixtures (Smith and Doran, 1996). EC results were expressed as osmotic potentials using the expression:
ψo= −ECe(s/)0.036, (1)
where ECeis the electrical conductivity of a saturated
extract (dS m−1),sandare the volumetric water
contents of the saturated extract and the fresh soil, re-spectively, and 0.036 is an empirical conversion factor (MPa dS−1m) (Rawlins and Campbell, 1986). In the present experiment, EC was strongly correlated with inorganic N (r2=0.62,P <0.001).
PAO was determined according to Belser and Mays (1980), and DEA as described by Tiedje et al. (1989). Phospholipid fatty acid analyses followed Petersen et al. (2002). A total of 34 fatty acids were consist-ently observed in the pasture soil, although in this context only total concentrations and proportions of selected fatty acids related to physiological status will be presented.
Isotope calculations
The fractions of soil N pools derived from urea, Ndfu,
were calculated according to a standard equation for fertilizer uptake studies (Nason and Myrold, 1991):
Ndfu= [15N atom%,fraction−0.366]/
[15N atom%,urea−0.366] (2)
However, labelling of NH+4 had to be estimated (pos-sible for days 3, 6 and 9 only) on the basis of net changes in total NO−3 and15NO−3 concentrations during each time interval:
[15
NH+4]t2=
t1,t2[15NO−3]
/
t1,t2[14+15NO−3]
.
(3)
Equation 3 assumes that labelling of the NO−3 pro-duced corresponded to the labelling of the substrate pool, and that there was no turnover of the NO−3 pool. The15N content of N2O emitted was calculated by
subtracting the background in air (310 ppm N2O with
0.366 atom% 15N). Accumulated emissions of N2O
were estimated assuming linear rate changes between samplings, and the fraction of N2O derived from urea
at each sampling was calculated using Eq. 2.
Statistical analyses
Treatment effects and temporal dynamics were ana-lyzed by a linear mixed model, and using a Tukey multiple comparisons test to identify differences.
Results
Inorganic N dynamics
Pools of NH+4 and NO−3 in the soil solution of treat-mentsCTL, LU, HUandLUNare shown in Figure 1 (note different scale forCTL). The higher background of NO−3 in LUN was evident, as was the accumu-lation of NO−3 over time in all treatments with urea amendment.
Figure 2 shows NO−2 concentrations, which were initially negligible. In LU andLUN a transient, but non-significant accumulation of NO−2 was observed during the 9-d period (P > 0.1). The pattern inHU
was very different, with a significant (P < 0.0001) accumulation of NO−2 between 3 and 9 days.
Figure 1. Concentrations of NH+4 () and NO−3 (♦) in the treatments indicated. Error bars represent standard error (n=3).
Figure 2. Concentrations of NO−2 inCTL(•),LU(◦),HU() and LUN() during the 9-d experiment. Error bars represent standard error (n=3).
N2O emissions
In Figure 4, N2O production rates are shown on an
area basis. Emission rates from LU increased until
day 6, while emission rates from LUN levelled off after day 3. Nitrous oxide emission, like nitrification, was delayed in HUduring the first 6 days, but then increased dramatically.
The sources of N2O on each sampling day are
shown in Table 1. The amendment of NO−3 alone (treatmentN) did not stimulate N2O production in the
soil. The treatmentsLU,HUandLUNstimulated the emission of soil-derived N2O similarly. With respect
to N2O derived from urea the picture was more
com-plex, reflecting that emissions from LUwere higher than from LUNthroughout the experiment, whereas inHUthe emissions of N2O derived from urea were
initially depressed, but greatly increased between day 6 and 9 (data not shown).
Soil solution composition
Soil pH (Figure 5A) was immediately raised by urea amendment, though with different effects of the three treatments (P < 0.0001). In all treatments with urea, pH declined continuously during the experiment (P <
[image:4.595.76.285.407.578.2]corres-Table 1. Accumulated emissions of N2O derived from urea and soil, as well as accumulated rates of CO2 evolution, after 9 days. The treatments were: CTL, water amendment; LU, 22 g urea-N m−2; HU, 43 g urea-N m−2; LUN, 22 g urea-N m−2+50µg NO−3N cm−3; N, 50µg NO−3N cm−3. The CO2data were corrected for urea-derived CO2by assuming that urea was completely hydrolyzed and urea-C released to the atmosphere. Letters indicate significant (P <0.05) differences within each column (n=3)
N2O from urea N2O from soil CO2, corrected
mg N mg C
CTL 0.3 c 15.9 c 8.2 c LU 27.6 a 26.2 a 19.0 b HU 22.8 ab 22.0 a 36.4 a LUN 15.2 b 24.7 ab 6.8 c
N 0.4 c 17.2 bc 8.4 c
ponded to osmotic potentials of−0.05 to−0.12 MPa after 1 d, decreasing to−0.14 to−0.19 MPa after 9 d (Figure 5B).
Relative to CTL, concentrations of DOC (Fig-ure 6A) were elevated in (Fig-urea amended soil after 1 and 3 days, and inHUandLUNthroughout the experiment (P < 0.05). InHU, DOC decreased between day 1 and day 3, and then increased again to the original level (P <0.01).LUshowed a small, but significant (P <0.05) decrease in DOC during the experiment.
Soil respiration
Soil CO2evolution from urea and soil respiration are
shown in Figure 6B; the production was corrected for dissolved CO2 and carbonates (Lindsay, 1979).
Ef-fects of all treatments had ceased by the end of the 9-d period, despite the differences in DOC availability. CO2evolution fromLUNwas always lower than from LU. In Table 1, the accumulated release of CO2from
each treatment is shown.
Microbial dynamics
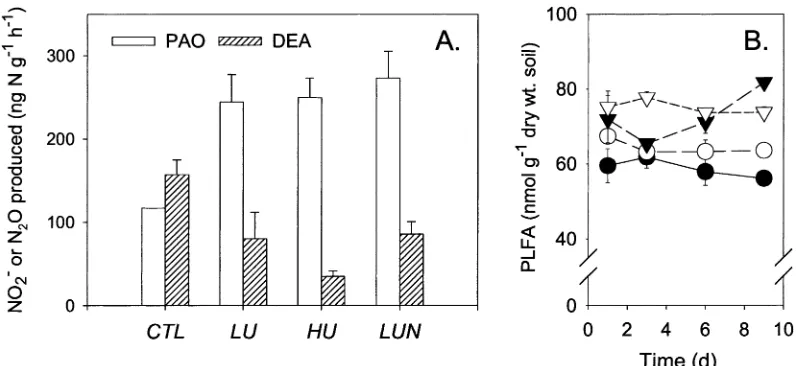
Potential ammonium oxidation (PAO) and denitrify-ing enzyme activity (DEA) were quantified after 3 d (Figure 7A). The buffered PAO assay (pH 7.4) was stimulated inLU,HUandLUNrelative toCTL(P <
0.05). The DEA assay indicated a reduction in the potential for denitrification in bothLU,HUandLUN
(P < 0.05). The decrease appeared to be stronger in the HU treatment, but differences betweenLU, HU
andLUNwere not significant (P = 0.10–0.15). The
DEA assay is not buffered, and pH of the slurries were 6.3 (CTL), 6.9 (LU and LUN) and 7.2 (HU), whereas the pH of the undisturbed soil was 6.4; all pair-wise differences were significant atP <0.01, as determined by Tukey’s multiple comparisons test.
Figure 7B presents concentrations of membrane lipid fatty acids (PLFA). Initial levels of PLFA inHU
andLUNwere elevated relative toCTL (P < 0.01). The levels of PLFA inLUandLUNremained constant throughout the experiment. In theHUtreatment, the apparent decrease between 1 and 3 days was not sig-nificant (P > 0.1). Between day 3 and day 9, PLFA concentrations inHUincreased by 25% (P =0.02).
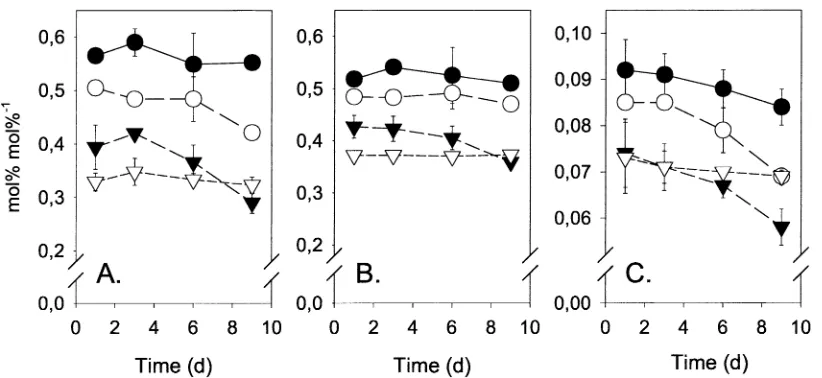
Figure 8 shows ratios of selected PLFA’s which have been linked with the physiological status of mi-croorganisms. These included the ratios between the cyclopropane fatty acids cy17:0 and cy19:0 and their metabolic precursors, palmitoleic acid (16:1ω7c) and cis-vaccenic acid (18:1ω7c), as well as the trans-cis ratio of 16:1ω7. Both cyclopropane/precursur ratios remained constant inCTLandLUNduring the exper-iment, whereas the cy17:0/16:1ω7c ratio of LU and
HU(P < 0.01)) and the cy19:0/18:1ω7 ratio of HU
(P = 0.0003) decreased. Ratios of 16:1ω7t/c de-creased significantly (P <0.05) in the treatmentsLU
andHUduring the experiment. All significant changes occurred mainly between day 3 and day 9.
Discussion
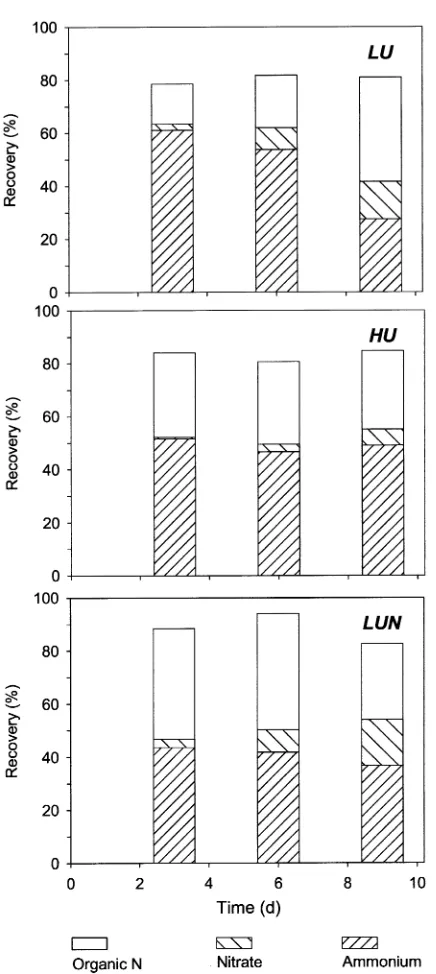
[image:5.595.195.402.158.248.2]Figure 3.Total recovery of15N added in urea as soil N, as NH+4 and as NO−3 (N2O emissions were insignificant).
[image:6.595.310.525.64.233.2]in a pasture soil, and the possible interaction with NO−3 availability. The moisture content during incub-ation was kept at 60% WFPS where denitrificincub-ation was not expected to occur unless stimulated by urea transformations. For nitrification, this moisture level was probably near optimal (Doran et al., 1988). Urea alone was added rather than artificial cattle urine, since
Figure 4. Nitrous oxide emission rates (µg m−2h−1) in theCTL (•), LU (◦), HU (), LUN () andN (NO−3 only) (). Bars represent standard errors (n=3).
we wanted to avoid the interference from turnover of organic constituents in the urine (Bristow et al., 1992). The absence of hippuric acid probably delayed urea hydrolysis in the soil (Whitehead et al., 1989), thereby dampening the initial increase in pH (Sherlock and Goh, 1984; Somda et al., 1997), as well as the os-motic down-shock. Thus, it is likely that any stresses imposed on soil organisms would be as great or greater in a pasture after deposition of cattle urine.
Concentrations of urea-N applied to the soil sur-face, 5 and 10 g N L−1, were selected on the basis of previous analyses of urine from cattle in this grazing system (Petersen et al., 1998). The input to the soil corresponded to 22 and 43 g N m−2, which is within the range of 20 to 80 g N m−2quoted by Oenema et al. (1997) as typical for urine patches.
The use of 15N-labelled urea made it possible to follow the turnover of the N introduced to the soil. For day 1, reliable data on15NH+4 and15NO−3 could not be obtained, but for subsequent sampling days the recovery of urea-N in mineral N and N2O was mostly
between 40 and 65%, and total 15N recovery aver-aged 84%. The missing urea-N was presumably lost to the atmosphere as NH3, or as N2which could not
be detected against the background in atmospheric air. For comparison, gaseous losses of 19–32% from15 N-labelled urine were indicated in a 406-d field lysimeter experiment with four soil types (Clough et al., 1998).
Nitrous oxide emission rates ranged from ca. 50µg N2O-N m−2h−1in theCTLtreatment to a maximum
of 350 µg N2O-N m−2 h−1 in HU by day 9
Figure 5. pH (A) and osmotic potentials (B) inCTL(•),LU(◦),HU() andLUN() during the 9-d experiment. Error bars represent standard error (n=3).
Figure 6. Dissolved organic C (A) and CO2evolution rates (B) inCTL(•),LU(◦),HU() andLUN() during the 9-d experiment. Error bars represent standard error (n=3).
emissions from urine-affected pasture soil observed in other studies (Anger et al., 2003; De Klein et al., 1999; Koops et al., 1997; Lovell and Jarvis, 1996; Yamulki et al., 1998). Emission rates inHUapparently increased beyond the 9-d period of this experiment, in accordance with other studies of N2O emission from
urine patches where a maximum has been recorded after 2–4 weeks (Allen et al., 1996; Lovell and Jar-vis, 1996; Monaghan and Barraclough, 1993). In the present study, accumulated N2O emissions during the
9 days represented 0.05–0.1% of the N inputs in urea. For comparison, N2O emissions equivalent to 0.2–
0.3% of urinary urea-N were recorded during 7 weeks after deposition of 25.5 or 50.9 g urea-N m−2 to
monoliths from the pasture where soil for the present experiment was collected (Ambus, 2004).
Effects on nitrification
Selected soil characteristics were monitored in order to throw light on the potential importance of nitri-fication and denitrinitri-fication for the N2O emissions
observed. Treatment effects on either pH or osmotic potential were not likely to inhibit NH+4 oxidation at the ranges observed (Low et al., 1997; Stark and Firestone, 1995), but the combination of pH and total ammoniacal nitrogen (TAN) in HUresulted in NH3(aq) levels in the soil solution of up to 45 mg L−1,
[image:7.595.72.525.275.449.2]Figure 7. Potential ammonium oxidation (PAO) and denitrifying enzyme activity (DEA) by day 3 (A) and PLFA concentrations (B). Error bars represent standard error (n=3). Key to symbols:CTL(•),LU(◦),HU(),LUN().
pH=9.25+log([NH3]/[TAN÷NH3]) , (4)
where 9.25 is the pKa of the NH+4-NH3equilibrium.
According to the relationship described by Monaghan and Barraclough (1992), this level of NH3(aq) could
have given a>50% reduction of nitrification rates. In the present experiment, net accumulation of NO−3 in
LU,HUandLUNafter 9 days were 90, 63 and 116 mg N kg−1, confirming that nitrification was delayed at the higher urea level.
Nitrite oxidation is more readily inhibited than NH+4 oxidation (Harada and Kai, 1968), and this may have caused the NO−2 accumulation observed inHU
(Figure 2). In this treatment, the NO−2 concentra-tion followed a time course similar to N2O emissions
(cf. Figures 2 and 3). Monaghan and Barraclough (1992) also observed NO−2 accumulation at high urine-N concentrations, while Stevens et al. (1998) found a direct relationship between NO−2 accumulation and N2O emissions at pH 8, but not at pH 5.6–6.5. Nitrous
oxide can be produced by nitrifiers via two different pathways (Wrage et al., 2001). It is either derived from hydroxylamine (NH2OH) as a byproduct of NH+4
oxidation, or it is produced via so-called nitrifier deni-trification, in which case NO−2 is the substrate for a process leading to N2O and N2 formation. The
cor-relation of N2O emissions and NO−2 accumulation in HU was consistent with nitrifier denitrification as a source of N2O emissions. While a direct link between
the two pools could not be established in this study because15NO−2 was not determined, a strong correl-ation between15N labelling of NO−2 and N2O pools
was recently reported for a pasture soil (Müller et al., 2004).
Effects on denitrification
Denitrification is primarily regulated by (lack of) oxy-gen, carbon and NO−3 availability. Denitrification was not limited by NO−3 availability, as indicated by sim-ilar N2O emissions from LU and LUN, and by the
absence of N2O in the N treatment (15N2was not
de-tected). Carbon availability could have varied between treatments, since the measurements of DOC indicated that a pool of soil organic matter was dissolved, in accordance with previous observations (e.g., Lovell and Jarvis, 1996). However, the degradability of this DOC appeared to be low, since elevated concentra-tions were maintained, especially in theHUtreatment (Figure 6A), whereas CO2 evolution rates declined
to the background level by day 9 (Figure 6B). Also, Kalbitz et al. (2003) studied DOC in grassland soil from a fen area and concluded that only 5–9% of the dissolved organic matter was labile. We propose that DOC derived from soil organic matter did not sig-nificantly stimulate microbial activity in the present experiment, and that CO2emissions mainly reflected
the effect of urea-N on soil microbial turnover. Emissions of N2O via denitrification are often
as-sociated with transient conditions such as oxic-anoxic gradients or wetting of a dry soil (Højberg et al., 1994; Rudaz et al., 1991). Sustained N2O production via
Figure 8. Ratios of cyclopropane fatty acids cy17:0/16;1ω7c (A), cy19:0/18:1ω7 (B) and the trans-cis ratio of 16:1ω7 (C) in treatmentsCTL (•),LU(◦),HU() andLUN(). Error bars represent standard error (n=3).
the present experiment, the pH in urea-amended soil was higher than in unamended soil, and there was no effect of increasing NO−3 availability. Therefore, it ap-pears unlikely that significant amounts of N2O were
produced via denitrification.
The possibility that N2O emissions were partly due
to chemodenitrification (references in Nelson, 1982; Venterea and Rolston, 2000) cannot be ruled out. The process is mainly expected to occur under acidic con-ditions, and in the present study pH in urea-amended soil was generally above 7. However, more acidic conditions could have occurred in connection with nitrifying micro-sites.
Microbial dynamics
DEA was depressed in urea-amended soil by day 3. Simek et al. (2002) recently showed that DEA is sens-itive towards pH of the soil slurry and often has an optimum near the natural pH of the soil. The pH in the slurries ofLU,HUandLUNwere 6.9–7.2, i.e., higher than the pH inCTL of 6.3, and a pH effect may thus have contributed to the reductions in DEA observed in urea-amended soil. If such a pH effect was import-ant during the DEA assay, then denitrification activity must have been inhibited in the soil which also had elevated pH upon urea amendment, especially inHU
(Figure 5A) . If, in contrast, a pH effect was not im-portant for the DEA results, then the treatment effects must be interpreted as a decline in the potential for denitrification.
Urea amendment gave comparable stimulations of PAO in LU, HU and LUN, but this assay was buf-fered. An adaptation to ambient soil pH, similar to that observed for DEA, has been described for short-term nitrification activity in pasture soils from various sites in New Zealand (Bramley and White, 1990). This im-plies that the pH changes in urea-amended soil could well have affected nitrification activity during incub-ation in this experiment, as indeed suggested by the dealy in NO−3 accumulation inHUin comparison with
LUandLUN.
The concentration of PLFA in soil is an index of microbial biomass that is strongly correlated with biomass C (Bailey et al., 2002). Compared to CTL,
HU and LUN had elevated concentrations of PLFA even at the first sampling. Microbial dynamics could have been confounded by a shift in lipid extractability or partitioning during extraction at the higher ionic strength in HU and LUN (Frostegård et al., 1991; Nielsen and Petersen, 2000), but subsequent changes in PLFA did not correlate with changes in soil solution properties and were probably dominated by microbial dynamics.
pro-duced in particular by Gram negative bacteria and appear when the organisms enter a stationary phase (Grogan and Cronan, 1997); hence, reduced pro-portions of these compounds suggest active growth. Elevatedtrans/cisratios of membrane lipid fatty acids is another response to environmental stresses observed with some Gram negative bacteria, including Pseudo-monas (Heipieper et al., 2003), and so a decline in 16:1ω7t/c may be taken as an indication of stress re-lief. The observed trends thus imply that any inhibitory effects of urea deposition were replaced by vigorous growth after a few days.
Conclusions
The microbial response to deposition of urea cor-responding to 22–43 g N m−2 was complex. There was evidence for inhibition of both nitrification and denitrification at the highest urea level, but also an average stimulation of potential ammonium oxidation activity and, after a few days, significant microbial growth. Inhibition and stimulation effects could have been spatially separated, and future work should de-scribe the vertical stratification in more detail. The highest N2O emission rates coincided with NO−2
ac-cumulation, and nitrifier denitrification is likely to be the main source of N2O in this laboratory study. It
should be stressed that the well-defined experimental conditions of this study effectively minimized back-ground N2O emissions, which are often associated
with fluctuating climatic conditions, in order to focus on the direct effects of urea. Also, the exclusion of urine components other than urea reduced C availabil-ity and probably urea turnover rates. Hence, the extent of losses, as well as the balance between nitrification and denitrification in this model system may differ from the field situation. On the other hand, the sim-plicity of the experimental setup enabled a relatively detailed interpretation of N dynamics and microbial community changes leading to N2O emissions from
urea in pasture soil. We conclude that urea concentra-tion in urine deposited on pastures is likely to influence microbial dynamics and soil N transformations not only quantitatively, but also qualitatively.
Acknowledgement
This study was supported by the EU Framework Pro-gramme 5 project MIDAIR (EVK2 CT-2000-00096),
and by the Danish Research Centre for Organic Farm-ing. The technical assistance of M. Astridou is greatly appreciated.
References
Allen A G, Jarvis S C and Headon D M 1996 Nitrous oxide emis-sions from soils due to inputs of nitrogen from excreta return by livestock on grazed grassland in the U.K. Soil Biol. Biochem. 28, 597–607.
Ambus P 2004 Short term N2O lossses in urine patches: A15N labelling study.InGreenhouse gas emissions from agriculture – mitigation options and strategies. Ed. A Weiske. pp. 232–233. Int. Conf., Leipzig 12–14 February.
Anger M, Hoffmann C and Kühbauch W 2003 Nitrous oxide emis-sions from artificial urine patches applied to different N-fertilized swards and estimated annual N2O emissions for differently fer-tilized pastures in an upland location in Germany. Soil Use Manage. 19, 104–111.
Bailey V L, Peacock A D, Smith J L and Bolton Jr. H 2002 Relationships between soil microbial biomass determined by chloroform fumigation-extraction, substrate-induced respiration, and phospholipid fatty acid analysis. Soil Biol. Biochem. 34, 1385–1389.
Belser L W and Mays E L 1980 Specific inhibition of nitrite oxida-tion by chlorate and its use in assessing nitrificaoxida-tion in soils and sediments. Appl. Environ. Microbiol. 39, 505–510.
Bramley R G V and White R E 1990 The variability of nitrifying activity in field soils. Plant Soil 126, 203–208.
Bristow A W, Whitehead D C and Cockburn J E 1992 Nitrogenous constituents in the urine of cattle, sheep and goats. J. Sci. Food Agric. 59, 387–394.
Clough T J, Ledgard S F, Sprosen M S and Kear M J 1998 Fate of 15N labelled urine on four soil types. Plant Soil 199, 195–203. De Klein C A M, McTaggart I P, Smith K A, Stevens R J, Harrison R
and Laughlin R J 1999 Measurement of nitrous oxide emissions from grassland soil using photo-acoustic infra-red spectroscopy, long-path intra-red spectroscopy, gas chromatography, and con-tinuous flow isotope-ratio mass spectrometry. Comm. Soil Sci. Plant Anal. 30, 1463–1477.
Doran J W, Mielke L N and Stamatiadis S 1988 Microbial activ-ity and nitrogen cycling as regulated by soil water status and bulk density. InTillage and Traffic in Crop Production. Eds. B D Witney, G Spoor, B D Soane and J T Douglas. pp. 49– 56. International Soil Tillage Research Organization (11th Intl. Conference), Edinburgh, Scotland.
Frostegård Å and Bååth E 1996 The use of phospholipid fatty acid analysis to estimate bacterial and fungal biomass in soil. Biol. Fertil. Soils 22, 59–65.
Grogan D W and Cronan Jr. J E 1997 Cyclopropane ring formation in membrane lipids of bacteria. Microbiol. Molecul. Biol. Rev. 61, 429–441.
Harada T and Kai H 1968 Studies on the environmental conditions controlling nitrification in soil. Soil Sci. Plant Nutr. 14, 20–26. Heipieper H J, Meinhardt F and Segura A 2003 Thecis-trans
iso-merase of unsaturated fatty acids inPseudomonasandVibrio: biochemistry, molecular biology and physiological function of a unique stress adaptive mechanism. FEMS Microbiol. Lett. 229, 1–7.
IPCC 1997 Greenhouse Gas Inventory. Reference Manual. Revised 1996. IPCC Guidelines for National Greenhouse Gas Inventor-ies, Volume 3, London: Intergovernmental Panel on Climate Change.
Kalbitz K, Schmerwitz J Schwesig D and Matzner E 2003 Biode-gradation of soil-derived dissolved organic matter as related to its properties. Geoderma 113, 273–291.
Keeney D R and Nelson D W 1982 Nitrogen – Inorganic forms.In Methods of Soil Analysis. part 2. Eds. A L Page et al. pp. 643-693. 2nded. Agron. Monogr. 9. ASA and SSSA, Madison, WI. Koops J G, van Beusichem M L and Oenema O 1997 Nitrous
ox-ide production, its source and distribution in urine patches on grassland peat soil. Plant Soil 191, 57–65.
Lindsay W L 1979 Chemical equilibria in soils. J. Wiley & Sons, New York.
Lovell R D and Jarvis S C 1996 Effects of urine on soil micro-bial biomass, methanogenesis, nitrification and denitrification in grassland soil. Plant Soil 186, 265–273.
Low A P, Stark J M and Dudley L M 1997 Effects of soil osmotic potential on nitrification, ammonification, N-assimilation, and nitrous oxide production. Soil Sci. 162, 16–27.
Monaghan R M and Barraclough D 1992 Some chemical and phys-ical factors affecting the rate and dynamics of nitrification in urine-affected soil. Plant Soil 143, 11–18.
Monaghan R M and Barraclough D 1993 Nitrous oxide and dinitrogen emissions from urine-affected soil under controlled conditions. Plant Soil 151, 127–138.
Müller C, Stevens R J, Laughlin R J, Ryan M and Jäger H-J 2004 Quantification of N transformation rates and the mechanisms of N2O production and emission in an old grassland soil. In Greenhouse gas emissions from agriculture – mitigation options and strategies. Ed. A Weiske. pp. 79–84. Int. Conf., Leipzig 12–14 February.
Nason G E and Myrold D D 199115N in soil research: Appro-priate application of rate estimation procedures. Agric. Ecosys. Environ. 34, 427–441.
Nelson D W 1982 Gaseous losses of nitrogen other than through de-nitrification.InNitrogen in Agricultural Soils. Eds. F J Stevenson et al. pp. 327–363. Agron. Monogr. No. 22, American Society for Agronomy, Madison, WI.
Nielsen P and Petersen S O 2000. Ester-linked polar lipid fatty acid profiles of soil microbial communities: A comparison of extrac-tion methods and evaluaextrac-tion of interference from humic acids. Soil Biol. Biochem. 32, 1241–1249.
Oenema O, Velthof G L, Yamulki S and Jarvis S C 1997 Nitrous oxide emissions from grazed grassland. Soil Use Manage. 13, 288–295.
Petersen S O, Frohne P S and Kennedy A C 2002 Dynamics of a soil microbial community under spring wheat. Soil Sci. Soc. Am. J. 66, 826–833.
Petersen S O, Sommer S G, Aaes O and Søegaard K 1998 Ammonia losses from urine and dung of grazing cattle: Effect of N intake. Atmos. Environ. 32, 295–300.
Rawlins S L and Campbell G S 1986 Water potential: Thermocouple psychrometry.InMethods of Soil Analysis. Part 1. Physical and Mineralogical Methods. Ed. A Klute. pp. 597–618. 2nded, Am. Soc. Agron., Madison, WI.
Richards I R and Wolton K M 1975 A note on urince scorch caused by grazing animals. J. Br. Grassland. Soc. 30, 187–188. Rudaz A O, Davidson E A and Firestone M K 1991 Sources of
nitrous oxide production following wetting of dry soil. FEMS Microbiol. Ecol. 85, 117–124.
Schepers J S, Francis D D and Thompson M T 1989 Simultaneous determination of total C, total N, and 15N on soil and plant material. Commun. Soil Sci. Plant Anal. 20, 949–959. Sherlock R R and Goh K M 1984. Dynamics of ammonia
volatiliz-ation from simulated urine patches and aqueous urea applied to pasture. I. Field experiments. Fertil. Res. 5, 181–195.
Simek M, Jisova L and Hopkins D W 2002 What is the so-called optimum pH for denitrification in soil? Soil Biol. Biochem. 34, 1227–1234.
Smith J L and Doran J W 1996 Measurement and use of pH and electrical conductivity for soil quality analysis.InMethods for Assessing Soil Quality. Eds. J W Doran and A J Jones. pp. 169– 185. Soil Science Society of America Special Publication No. 49. Madison, WI.
Somda Z C, Powell J M and Bationo A 1997 Soil pH and nitrogen changes following cattle and sheep urine deposition. Comm. Soil Sci. Plant Anal. 28, 1253–1268.
Stark J M and Firestone M K 1995 Mechanisms for soil moisture ef-fects on activity of nitrifying bacteria. Appl. Environ. Microbiol. 61, 218–221.
Stevens R J and Laughlin R J 1998 Measurement of nitrous ox-ide and di-nitrogen emissions from agricultural soils. Nutr. Cycl. Agroecosys. 52, 131–139.
Stevens R J, Laughlin R J and Malone J P 1998 Soil pH affects the processes reducing nitrate to nitrous oxide and di-nitrogen. Soil Biol. Biochem. 30, 1119–1126.
Sørensen P and Jensen E S 1991 Sequential diffusion of ammonium and nitrate from soil extracts to a polytetrafluoroethylene trap for 15N determination. Anal. Chim. Acta 252, 201–203.
Tiedje J M, Simkins S and Groffman PM 1989 Perspectives on measurement of denitrification in the field including recommen-ded protocols for acetylene based methods.InEcology of Arable Land. Eds. M Clarholm and L Bergström. pp. 217–240. Klüwer Acaddemic Press, Dordrecht.
Vance E D, Brookes P C and Jenkinson D S 1987 An extrac-tion method for measuring soil microbial biomass. Soil Biol. Biochem. 19, 703–707.
Venterea R T and Rolston D E 2000 Mechanistic modeling of nitrite accumulation and nitrogen oxide gas emissions during nitrification. J. Environ. Qual. 29, 1741–1751.
Whitehead D C, Lockyer D R and Raistrick N 1989 Volatilization of ammonia from urea applied to soil: Influence of hippuric acid and other constituents of livestock urine. Soil Biol. Biochem. 21, 803–808.
Wrage N, Velthof G L, van Beusichem M L and Oenema O 2001 Role of nitrifier denitrification in the production of nitrous oxide. Soil Biol. Biochem. 33, 1723–1732.