_____________________________________________________________________
1.1. Background
Australia’s forests, both native and plantation, are a highly valuable natural asset (National Forest Inventory, 2005), providing wood and paper products, recreational opportunities and habitat for a diverse range of animals and plants. Traditionally, native forests were the primary source of hardwood timber in Australia (National Forest Inventory, 2005), providing products such as fuel wood, pulp, veneer, and timber. However, the area of native forest available for harvesting is decreasing due to expanding conservation reserves. This has resulted in a rapid expansion of hardwood plantations Australia wide.
A plantation forest is ‘an intensely managed stand of trees of either native or exotic species, created by regular placement of seedlings or seeds’ (National Forest Inventory, 2005). Plantations allow selected species to be grown on short rotation lengths, thereby increasing the volume/ha of desirable products. Though the initial outlay for establishment and ongoing maintenance is high, specific rotation periods for particular products make plantation forestry economically viable. With respect to eucalypt plantations, economic benefits can be seen in as little as 10-15 years for pulpwood, 20-30 years minimum for saw logs, and 40 plus years for large diameter logs (National Forest Inventory, 2005).
Plantation forestry began in Australia in the 1870’s (National Forest Inventory, 2005). In 2005, there were 1.72 million ha of plantation (hardwood and softwood) in
Australia (National Forest Inventory, 2005). Of this, 715,531 ha was hardwood and an estimated 95% was planted with Eucalyptus species (National Forest Inventory, 2005).
The most commonly planted species, in temperate regions, are Eucalyptus globulus
Labill. and Eucalyptus nitens (Deane and Maiden) Maiden, due to their rapid growth rates, favorable pulp yield, and wood density (Farrington and Hickey, 1989). The majority of hardwood plantations are located in southern Australia, with the largest estates being in Western Australia (270,813 ha), Victoria (164,724 ha), and Tasmania (155,500 ha) (National Forest Inventory, 2005). It is estimated that by 2020
Australia’s hardwood industry will reach 3.3 million ha (National Forest Inventory, 2005).
browsing mammals, and fungal pathogens (O'Reilly-Wapstra et al., 2002; Lou and Baldwin, 2004; Milgate et al., 2005; O'Reilly-Wapstra et al., 2005; Prudic et al., 2005; Rapley, 2005). For example, work by Close et al., (2004) has demonstrated that
E. globulus and E. nitens seedlings with a high nutrient status are more susceptible to browsing damage than seedlings with a low nutrient status, and more succulent seedlings take longer to recover from frost than hardened seedlings (Davidson et al., 2004). There is a need to select for maximal growth rates and biomass, but to limit the effects of damaging agents by selection for true resistance.
1.2 Eucalyptus plantation pests and their damage symptoms
Endemic agents can be present at low levels in Australian native vegetation, but can increase to epidemic proportions if close to a susceptible host or source of food, such as plantations. The most significant damaging agents present in Australian native eucalypt forests that have caused problems in newly established plantations are the a) chrysomelid leaf beetles (Ohmart, 1990; Neumann, 1993), b) vertebrate pests
including the red-bellied pademelon (Thylogale billardierii), the common brushtail possum (Trichosurus vulpecula), the introduced European rabbit (Oryctolagus cuniculus), (Bulinski, 2000; Pietrzykowski et al., 2003b), and c) Mycosphaerella
species (Carnegie and Keane, 1994; Stone et al., 1998; Park et al., 2000; Milgate et al., 2001; Mohammed et al., 2003; Hunter et al., 2004; Smith, 2006) which cause Mycosphaerella Leaf Disease (MLD).
(Chrysophtharta spp.), scarab beetles (Heteronyx spp), gum-leaf skeletonizer (Uraba lugens) and autumn gum moth (Mnesampela privata) reduce leaf area and defoliate by chewing and scalloping leaves and shoots; and the leaf blister saw fly larvae (Phylacteophaga spp) and psyllids (Cardiaspina spp) cause discoloration and necrosis of leaf tissue (Elliot and de Little, 1984; Loch and Floyd, 2001).
Foliar pathogens of eucalypts e.g. Aulographina (Carnegie and Keane, 2003),
Phaeophleospora (Hood et al., 2002a), and the previously mentioned MLD, also cause a number of symptoms such as defoliation, necrosis and discoloration of leaves. These pathogens predominantly infect young, juvenile, and newly expanding foliage during spring and summer (Wall and Keane, 1984; Yuan, 1999; Carnegie, 2000), a period which coincides with the vegetative growth phase of the host species.
1.3 Mycosphaerella Leaf Disease
Outbreaks of MLD have been reported from South Africa (Hunter, 2002; Hunter et al., 2004), Ethiopia (Gezahgne et al., 2006), New Zealand (Ganpathi, 1979; Dick, 1982; Hood et al., 2002b) and Chile (Wingfield et al., 1995; Ahumada et al., 2003). In Australia significant damage from MLD has occurred in plantations in Western Australia, South Australia, Victoria, and Tasmania (Mohammed et al., 2003). There have also been sporadic MLD defoliation events in E. globulus plantations in
southeast New South Wales (Stone et al., 1998; Carnegie, 2000). This disease is also present in Queensland, but currently does not cause severe damage, as the hardwood plantation estate is still small and expanding (Mohammed et al., 2003). Severe sporadic epidemics of MLD have been occurring over the past 30 years in E. globulus
plantations in Tasmania, especially in the northwestern region of the island, which is most likely related to the wet and warm conditions that prevail in this region
(Wardlaw, 2001). Recent epidemics have been so significant that Forestry Tasmania has ceased planting E. globulus and has replaced it with E. nitens, as this species is considered more resistant to infection by MLD (Wardlaw, Forestry Tasmania, pers. comm).
(Carnegie and Keane, 1994; Milgate et al., 2001; Mohammed et al., 2003; Milgate et al., 2005; Smith, 2006; Glen et al., 2007).
1.4 Mycosphaerella Leaf Disease impact on eucalypts.
It is necessary to understand the impact of the initial damage and how the degree of recovery after infection by MLD influences final productivity. It is therefore vital to assess both-long or short-term growth effects. Snowdon (2002) identified two types of tree growth responses to damage. Firstly, a short term reduction in growth, with the growth potential returning to that of non-affected trees (Type 1), and secondly a long-term growth reduction where the changed growth trajectory is permanent and growth does not return to that exhibited by non-affected trees (Type 2). The management implications of this is that trees following a Type 1 growth response recover to the same growth rates as healthy trees, but with a time lag compared to undamaged trees (Smith, 2006) so that a management option to maintain profitability is to extend the rotation. Trees exhibiting a Type 2 response will not recover without management intervention, and may require a reappraisal of anticipated end products (Wardlaw et al., 2006).
Investigations by Smith (2006) on the impact of MLD on the growth of E. globulus in a long term trial suggest MLD damage of up to 20% (defoliation) follows a Type 1 growth response, and trees with greater damage follow a Type 2 growth response. Lundquist & Purnell (1987) with E. nitens, reported similar results, with reduced growth rates occurring when trees exhibited 25% defoliation. Several other
10% damage occurred) and Carnegie & Ades (2002b) (up to 10% leaf area with necrosis reduced height by 13% and diameter by 4%). These results, however, were from short-term trials and should not be directly compared with the long-term studies conducted by Smith (2006).
Variation in the reported effects of MLD on tree growth and recovery suggests that genetics and site factors (site water availability and soil nutrition) influence the response to MLD (Carnegie, 1991; Carnegie and Ades, 2001; Carnegie and Ades, 2002b; Wardlaw, 2002; Milgate et al., 2005; Pinkard et al., 2006; Smith, 2006; Smith et al., 2006). There is significant inter and intra specific variation in the response of eucalyptus to infection by MLD. Certain traits such as epicuticular wax coverage and palisade mesophyll density have been associated with Mycosphaerella resistance in juvenile foliage of E. globulus (Smith, 2006). Similar traits have also been identified for E. nitens in South Africa (Smith et al., 2006b). Resistant genotypes of E. nitens in Tasmania have not been selected for planting as E. nitens is generally more resistant to MLD than E. globulus.
Wardlaw (2002) investigated the growth response to MLD of E. globulus planted in windrows* compared to bays. Results demonstrated that trees planted in windrows were taller, had larger stem diameters and exhibited less crown defoliation and necrosis than trees in bays. Wardlaw (2002) concluded that the additional water and nutrition which were available to windrow trees via the mounding of debris and earth provided them with extra resources to resist the effects of infection by MLD. This conclusion is supported by results from other authors. Carnegie and Ades (2002a)
*
found higher doses of phosphorus reduced the effects of MLD and that trees planted on a second rotation site (with low nutrient status) recorded growth reductions from low levels of MLD. Fertilizer trials completed by Pinkard et al., (2006) found fertilizer increased the growth rate and recovery time of defoliated trees.
Timing of a MLD epidemic also has repercussions on a tree’s recovery after infection. Candy (1999) reported that E. nitens subjected to artificial crown defoliation early in the growing season recovered sooner than trees subjected to defoliation late in the season. A similar recovery rate occurred with E. globulus trees that experienced near complete defoliation from MLD in the early in the growing season (Smith, 2006). Alternatively, it is suggested that E. globulus trees damaged by MLD later in the growing season may exhibit a slower recovery (Smith, 2006), as their growth rates begin to slow down at this time. In addition to the timing of a MLD epidemic, the level of severity also affects the rate of recovery. For example, Rapley (2005) demonstrated that E. globulus trees with lower insect damage levels (5-50% leaf area loss) recovered within 12 months, compared to trees with severe damage levels (>70% leaf area loss) which took more than two years to recover.
1.5 MLD epidemiology
The risk of a MLD epidemic is greater in a monoculture than in a mixed forest due to the uniformity of plant species growing (Old and Wingfield, 2003). Trees are also planted in a regular pattern and are at a similar stage of development i.e. susceptible juvenile leaf stage will be present at the same time in a large number of trees, also termed a cohort population (Zadoks & Schein, 1979). These risk factors increase the probability of an epidemic, provided susceptible inoculum (pathogen) and
environmental conditions favourable for disease development occur concurrently present. Inoculum could be present either naturally in surrounding native vegetation, or be disseminated by wind or water to the hosts. Mycosphaerella lesions are always present, albeit at a low level, within a plantation or in surrounding native forest species such as streamside reserves. For example, in the northwest of Tasmania, low levels of damage were observed on trees planted in 1999 and this may have provided a source of inoculum for the neighbouring plantation that was planted in 2000, along with the favorable environmental conditions for disease development, an epidemic resulting in moderate-high (40%-70%) levels of crown damage (Wardlaw, 2001; Wardlaw, 2002).
The environmental variables that most influence pathogen infection and progression through space and time include relative humidity, temperature, leaf wetness duration, wind (speed and direction), solar radiation and plant nutrition (Lucas, 1998). Each of these variables can affect the infection efficiency and subsequent disease
Figure 1.1 Disease cycle depicting each stage required for disease progression.
Drying and wetting cycles are seen as highly important in determining ascospore discharge in ascomycetes. Air at near-saturation (relative humidity) provides enough moisture to trigger ascospore discharge. It has been proposed that discharge occurs when moisture enters the dry ascus through osmosis, causing its walls to expand and burst, thereby forcibly discharging ascospores (Machardy et al., 2001). As low temperatures can alter the osmosis process by affecting membrane permeability and biochemical processes (Machardy et al., 2001), the discharge mechanism can also be affected by temperature (Stensvand et al., 1997). Wind transports ascospores either within the canopy or further afield if turbulence lifts ascospores to higher wind streams (Aylor, 1990).
Both the mechanisms of, and the conditions required for ascospore discharge in
Mycosphaerella species, including eucalypt Mycosphaerella species, have been the subject of several investigations (Appendix 1). As expected, ascospores of
Deposition on susceptible host Infection efficiency
(germination & hyphal penetration)
Lesion expansion
Spore capacity Spore ejection (passive &/or active)
Dispersal (water, wind, soil)
Incubation period
M. nubilosa and M. cryptica have been shown to be forcibly discharged from asci within pseudothecia by a mechanism triggered by successive wetting and drying cycles (Cheah, 1977; Beresford, 1978; Cheah and Hartill, 1987; Park and Keane, 1987; Park, 1988b). Mycosphaerella cryptica produces sexual (ascospores) and asexual spores (Park and Keane, 1984). The latter are transferred within the host canopy by rain splash (Beresford, 1978; Ganapathi, 1979). Mycosphaerella nubilosa
only produces ascospores (Park, 1984). Ascospores can be discharged up to a distance of 12-15 mm from the pseudothecia (Park, 1988a). Ideal environmental conditions for ascospore discharge in laboratory studies are temperatures 25 °C for
M. nubilosa and 20 °C M. cryptica and relative humidity above 90% (Park and Keane, 1987; Park, 1988a; Crous, 1998).
Once ascospores are discharged, they are disseminated by wind and water (through rain-splash) and conidia are disseminated by water only. Deposition into the lower crown and to neighbouring trees occurs through alloinfection by rain splash and active discharge from the lesions onto neighbouring leaves (autoinfection). Long distance transportation occurs when ascospores enter upper wind streams in the atmosphere.
Conditions that influence ascospore germination, infection, lesion expansion and ascospore maturation are very similar, i.e. all require similar warm temperatures, high humidity, and a specified duration of leaf wetness (Park, 1984). Reduced
leaf litter for up to 8 months compared to M. cryptica, which sporulates for up to 4 months (Park, 1984).
M. cryptica will continue secondary and sporulating under favourable conditions (Park, 1984) and is polycyclic, whereas M. nubilosa is mono or bicyclic (just 1 or 2 disease cycles per season). Under favourable conditions the incubation period
(defined as the time required for symptom appearance) on young E. globulus leaves is approximately 7-24 days for M. nubilosa and M. cryptica (Park, 1984). Conditions that influence ascospore germination, infection, penetration, incubation period, lesion and expansion are very similar, i.e. all require warm temperatures, high humidity, and periods of leaf wetness (Park, 1984). Reduced temperatures will inhibit sporulation and infection progression (Park, 1984).
1.6 Forecasting and determining the risk of MLD outbreaks
(teleomorph: Calonectria quinqueseptata Figueiredo and Namekata) (Booth et al., 2000a), and Dothistroma needle blight (Dothistroma septosporum) (Woods et al., 2005). A possible reason for lack of model development at a finer scale to predict disease risk in forest plantations is the logistical difficulties involved in collecting the level of detailed and replicated site data required. There is marked variation that occurs within and among forest plantation sites due to their vast geographical coverage and the wide array of possible interactions among different microclimates, topography’s and soils. Information about MLD epidemiology has been gleaned from laboratory experiments or a very limited number of field studies with the collection of broad-scale data only (Cheah, 1977; Beresford, 1978; Cheah and Hartill, 1987; Park and Keane, 1987; Park, 1988b) (Appendix 1). The only indications of risk provided by previous research is that MLD (caused by the two most common Mycosphaerella
species) is predisposed by temperatures among 17-25 °C, 90% RH and a rainfall event.
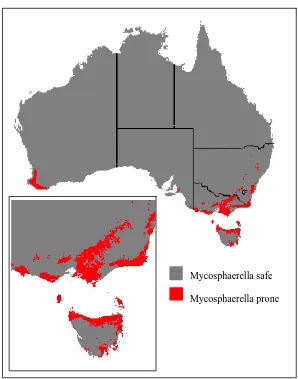
in central and far northeast NSW where severe defoliation of E. globulus occurs by M. nubilosa (A. Carnegie, Forest Health Management, NSW Department of Primary Industry, Pers. Comm., 2006). The coarse nature of the map is an example of a prediction which lacks information on site risk factors such as topography, soil type, water sources and nearby vegetation, which all affect inoculum sources and the microclimate (which could affect forecasting the risk of MLD risk at the local scale).
[image:14.595.148.446.234.613.2]
Figure 1.2. The predicted distribution of Mycosphaerella leaf disease in Australia mapped according to ideal weather conditions based on annual weather data from AUSGRD. Scale-1/8th of a degree for the Australia wide view and 1/25th for the Tasmania (inset) view (Pietrzykowski et al., 2003a).
Mycosphaerella safe
Seasonal and site-specificforecasting systems have been established and are being used by farmers to manage potato late blight (Phytophthora infestans) in the UK (Taylor et al., 2003), and tomato late blight (Phytophthora infestans) in Italy (Bugiani et al., 1995). These systems aid in alerting farmers to start spraying fungicides and can reduce unnecessary fungicide applications (Taylor et al., 2003). As an example, one forecasting system is Brassicaspot (Kennedy and Gilles, 2003). Brassicaspot predicts infection of Albugo candida, by indicating optimal time for controls to be implemented. This program is successfully being used in the UK, to reduce the number of fungicide sprays by 50% (Kennedy and Gilles, 2003). Fungicide application, however, will never be used in eucalypts due to environmental and economical constraints even though their use is being investigated in Victoria, Australia (Ian Smith, University of Melbourne, Australia). An early warning system to alert managers to apply fertilizer would be more applicable to the eucalypt industry.
Limited work has been completed in developing disease forecasting systems for tree species. One rule-based model developed by Meetemeyer et al. (2004) includes mapping the risk and spread of sudden oak death (Phytophthora ramorum)
(Meentemeyer et al., 2004). This model maps regions at risk of infection by sudden oak death, based on knowledge of the susceptibility of multiple host species, the pathogens reproductive potential and spread, and climate variables that favour the host and pathogen. The model serves to precisely target high-risk areas for the purpose of prioritising the highest risk areas in need of disease eradication
native sclerophyll vegetation in south-eastern Australia (Wilson et al., 2003). To date, disease risk modelling for the eucalyptus plantation/MLD pathosystem has been conducted only at a coarse scale (Pietrzykowski et al., 2003a) similar to that completed for guava rust (Booth et al., 2000b).
1.7 Assessment methods
Plantation health surveillance programs are an important component of plantation forest management. Data collected is used by forest managers to develop
management regimes and by external groups for forest accreditation. Therefore there is a need to use surveillance methods that are repeatable (for monitoring over time), accurate (consistently include small errors) and are in expensive (Stone et al., 2003b). Methods also require standardisation and acceptance amongst the forest industry which allows for comparisons to be made among organisations.
To date, in Australia, crown health has been assessed using a number of ground and aerial methods that are not standardized among forest agencies and companies. These include seasonal (short term) and permanent plots, drive-by roadside assessments, and aerial surveys from helicopters or small planes (Stone et al., 2003b; Stone and
Currently in Australia, data is collected on an ‘ad hoc’ basis with only small proportions of the nation’s total forest resource base being assessed (Stone et al., 2003b). Data collected is mainly descriptive, and hence, is limited in its value for comparison with data from other states and countries. Furthermore, forestry companies and agencies in different states have different methods for reporting on forest health, and this data is also limited at the regional scale. A similar issue exists among forestry companies in the U. S. A. and Europe as shown by Hickey et al., (2005) who have reported on the differences that occurred among 22 forestry companies consisting of both public and privately owned, operating in 15 jurisdictions. The study found that companies have a similar level of formal monitoring, but the range of methods, procedures, scales and indicators which they report differ (Hickey et al., 2005). Developing and adopting a more universal prescription for monitoring forest health, international collaborative research would facilitate the acquisition and sharing among countries.
The United States Department of Agriculture, Forest Service (USDA FS), uses a forest health monitoring program to assess the condition of the nations forests (Mangold, 1998). This program is based on a formal, permanent grid-sampling framework that is temporally stratified. It includes a series of tree and plot scale forest health monitoring indicators, which includes assessing the type of damage on a tree, its location and severity (Stone et al., 2003b). The USDA forest health
Recently, a new standardised assessment method, the Crown Damage Index (reffered to as CDI from here in) was developed in Australia to assess crown damage in young (juvenile foliage) eucalypt plantations (Stone et al., 2003a). It includes assessment methodology associated with estimating disease intensity (incidence and severity) at the tree crown scale, the CDI, as well as protocols for assessing and sampling an entire plantation.
The main objectives of the Crown Damage Index assessment method are to provide data on plantation health, evaluate the effectiveness of insect management programs, assess research trials and formulate future yield projections both within and among plantation forests (Stone et al., 2003b). However errors occur at the tree crown scale due to assessment error by scorers, and at the plantation scale if the sampling protocol is not utilized as recommended. This sampling methodology also provides sampling error estimates (Smith et al., 2005; Smith, 2006). The CDI is a first step towards developing a standardized assessment protocol that can be adopted at a national level and used by all government environmental agencies, research organisations, and forestry companies.
1.8 Remote sensing
Recent advances in remote sensing technology provide the opportunity for developing a standard and rapid crown health surveillance method for plantations. Optical remote sensing measures the amount of electromagnetic energy reflected and/or emitted from vegetation in non-visible wavebands as well as visible wavebands, and it can
1993). It provides a method for collecting large volumes of quantitative and accurate data in a non-destructive manner, which can potentially allow for early detection of health problems at the crown and plantation scale.
Remote sensing has been used around the world for various purposes for many years. Numerous projects have demonstrated the capacity of this technology in plantation forestry and native forests to monitor tree health, identify and assess severity of biotic or abiotic stresses, and identify physiological changes (e.g. Heller and Bega, 1973; Curran, 1982; Ahern, 1988; Leckie et al., 1988; Ekstrand, 1994; Carter et al., 1996; Carter et al., 1998; Coops, 2001; Blackburn, 2002; Moskal and Franklin, 2004; Leckie et al., 2005; Coops et al., 2006). In Australia it has been used successfully in eucalypt forests to identify and assess leaf and canopy attributes such as crown condition (Coops et al., 2004; Stone and Haywood, 2006), stand volume (Coops et al., 1999; Stone and Haywood, 2006), habitat complexity (Coops, 1997; Coops et al., 1998; Coops, 2001), leaf area (Coops, 2004), leaf water and pigment content (Datt, 1998, 1999; Coops et al., 2003b), and insect and fungal damage (Stone et al., 1998; Stone et al., 2001; Stone and Coops, 2004; Stone et al., 2005). Though remote sensing has been used to assess the severity and extent of Dothistroma needle blight in Pinus radiata plantations (Coops et al., 2003a; Stone et al., 2004a; Stone et al., 2004b), it has not been used in Eucalyptus plantations.
from the image is used to characterize the various symptoms exhibited by the crowns, which is also matched to ground-based observations. Algorithms are then developed to differentiate among symptom types and severities at the crown scale. The
algorithm can then be applied to the whole image to estimate disease intensity for an entire landscape.
While the cost of image acquisition is currently high, remote sensing has substantial advantages over manual forest health assessments. The data is spatially continuous, referenced and digitized, and hence can be integrated with existing Geographical Information System (referred to as GIS from here in) data. It has the capability to produce disease maps and be incorporated into statistical and forecast modeling. This further provides forest managers with highly valuable information for their
management and decision support programs.
1.9 Research overview 1.9.1 Scope
1.9.2 Hypotheses EPIDEMIOLOGY
1. Atmospheric Mycosphaerella ascospore concentration is correlated with
meteorological variables.
2. The relationship among Mycosphaerella atmospheric ascospore concentration
and meteorological variables can be used to develop an ascospore risk
prediction model.
REMOTE SENSING
1. Spectral analysis can be used to quantify the extent to which Mycosphaerella
leaf disease causes damage to eucalypt foliage.
2. Models can be developed to identify symptoms of Mycosphaerella leaf disease at the crown scale and further applied to Digital Multi Spectral Imagery to
scale up to the plantation scale.
1.9.3 Objectives and summary of work
The main areas of research completed were: quantifying the effects of meteorological variables on atmospheric ascospore density, forecasting atmospheric ascospore concentration of Mycosphaerella Leaf Disease, remote sensing and spectral characterization of Mycosphaerella Leaf Disease on E. globulus foliage, and the development of a crown-based model to predict Mycosphaerella Leaf Disease when using remotely sensed imagery.
Chapter 2 investigates the relationship among meteorological variables and
precisely than previous studies, the meteorological variables correlated with increased atmospheric ascospore concentrations; and secondly, to identify and describe any seasonal and diurnal periodicities in atmospheric ascospore concentrations. The third objective was to develop a model that uses meteorological data to predict when ascospore release and dispersal events would occur and the concentration of the ascospores in the atmosphere at those times. The chapter describes how this model could be used to issue a ‘disease risk alert’ to help plantation managers in selecting low disease risk plantation sites and implement other management intervention. It further explains how it can be used at established plantation sites by managers to predict future disease occurrence.
There has been no investigation to date on the effects of Mycosphaerella Leaf Disease on leaf or crown spectral characteristics. The objectives of Chapter 3 were to
characterise MLD severity at the leaf scale using spectral reflectance data, and to provide spectral diagnostic information that will be used to produce reflectance indices and algorithms in the further development of models to predict symptom severity at the crown scale.
present a crown scale model and demonstrate how the model is applied to the plantation scale and the information that can be extracted and used for plantation management.
Ahern FJ. 1988. The effects of bark beetle stress on the foliar spectral reflectance of lodgepole pine. International Journal of Remote Sensing 9:1451-1468.
Ahumada R, Hunter GC, Wingfield BD, Wingfield MJ. 2003. Molecular and morphological identification of Mycosphaerella spp. associated with
Eucalyptus leaf disease in Chile. In: 8th International Congress of Plant Pathology. Christchurch, New Zealand. p 153.
Asrar G. 1989. Theory and applications of optical remote sensing. New York: John Wiley & Sons.
Aylor DE. 1990. The role of intermittent wind in the dispersal of fungal pathogens. Annual Review of Phytopathology 28:73-92.
Battaglia M, Sands P, White D, Mummery D. 2004. CABALA: a linked carbon, water and nitrogen model of forest growth for silvicultural decision support. Forest Ecology and Management 193:251-282.
Beresford RM. 1978. Mycosphaerella nubilosa (CKE) Hansf. on Eucalyptus delegatensis R.T. Baker: further studies of epidemiology in the north island of New Zealand. Thesis type. University of Auckland: Auckland.
Blackburn GA. 2002. Remote sensing of forest pigments using airborne imaging spectrometer and LIDAR imagery. Remote Sensing of Environment 82:311-321.
eucalypts in mainland South East Asia and around the world. Environmental Pollution 108:365-372.
Booth TH, Old KM, Jovanovic T. 2000b. A preliminary assessment of high risk areas for Puccinia psidii (Eucalyptus rust) in the Neotropics and Australia. Agriculture, Ecosystems and Environment 82:295-301.
Bugiani R, Govoni P, Bottazzi R, Giannico P, Montini B, Pozza M. 1995. Monitoring airborne concentrations of sporangia of Phytophthora infestans in relation to tomato late blight in Emilia Romagna, Italy. Aerobiologia 11:41-46.
Bulinski J. 2000. Relationships among herbivore abundance and browsing damage in Tasmanian eucalypt plantations. Australian Forestry 63:181-187.
Candy SG. 1999. Predictive models for integrated pest management of the leaf beetle
Chrysophtharta bimaculata in Eucalyptus nitens plantations in Tasmania. Thesis type. University of Tasmania: Hobart.
Carnegie A. 1991. The susceptibility of certain Eucalyptus species and provenances to infection by Mycosphaerella spp. and other leaf parasites. Thesis type. La Trobe University: Bundoora, Victoria.
Carnegie A, Ades P. 2002a. Added phosphorus is associated with reduced severity of
Mycosphaerella cryptica in Eucalyptus globulus. Australian Forestry 64:203-208.
Carnegie AJ. 2000. A study of species of Mycosphaerella on eucalypts in Australia and the impact of Mycosphaerella leaf disease on Eucalyptus globulus
Carnegie AJ, Ades PK. 2001. Added phosphorus is associated with reduced severity of Mycosphaerella cryptica in Eucalyptus globulus. Australian Forestry 64:203-208.
Carnegie AJ, Ades PK. 2002b. Mycosphaerella leaf disease reduces growth of plantation-grown Eucalyptus globulus. Australian Forestry 66:113-119.
Carnegie AJ, Ades PK, Keane PJ, Smith IW. 1998. Mycosphaerella diseases of juvenile foliage in eucalypt species and provenance trial in Victoria, Australia. Australian Forestry 61:190-194.
Carnegie AJ, Keane PJ. 1994. Further Mycosphaerella species associated with leaf diseases of Eucalyptus. Mycological Research 98:413-418.
Carnegie AJ, Keane PJ. 2003. Variation in severity of target spot, caused by
Aulographina eucalypti, in a eucalypt species and provenance trial in Victoria. Australasian Plant Pathology 32:393-402.
Carrisse O, Bourgeois, G., Duthie, J. A. 2000. Influence of temperature and leaf wetness duration on infection of strawberry leaves by Mycosphaerella fragariae. Phytopathology 90:1120-1125.
Carter GA, Dell TR, Cibula WG. 1996. Spectral reflectance characteristics and digital imagery of a pine needle blight in the southeastern United States.
Canadian Journal of Forest Research 26:402-407.
Cheah L-H. 1977. Aerobiology and epidemiology of Mycosphaerella nubilosa (CKE) Hansf. on Eucalyptus spp. Thesis type. University of Auckland: Auckland.
Cheah L-H, Hartill W. 1987. Ascospore release in Mycosphaerella cryptica (Cooke) Hansford. European Journal of Forest Pathology 17:129-141.
Clark M, Roberts D, Clark D. 2005. Hyperspectral discrimination of tropical rain forest tree species at leaf to crown scales. Remote Sensing of Environment 96:375-398.
Close D, McArthur C, Pietrzykowski E, Fitzgerald H, Paterson S. 2004. Evaluating effects of nursery and post-planting nutrient regimes on leaf chemistry and browsing of eucalypt seedlings in plantations. Forest Ecology and
Management 200:101-112.
Coops N, Culvenor D, Preston R, Catling P. 1998. Procedures for predicting habitat and structural attributes in eucalypt forests using high spatial resolution remotely sensed imagery. Australian Forestry 61:244-252.
Coops N, Stanford M, Old K, Dudzinski M, Culvenor D, C. S. 2003a. Assessment of Dothistroma needle blight of Pinus radiata using airborne hyperspectral imagery. Ecology and Epidemiology 93:1524-1532.
Coops N, Stone C, Culvenor D, Chisholm L. 2004. Assessment of crown condition in eucalypt vegetation by remotely sensed optical indices. Journal of
Environmental Quality 33:956-964.
Coops NC, Bi H, Barnett P, Ryan P. 1999. Estimating mean and current annual increments of stand volume in a regrowth eucalyptus forest using historical landsat multi spectral scanner imagery. Journal of Sustainable Forestry 9:149-168.
Coops NC, Catling, P.C. 1997. Utilising airborne multispectral videography to predict habitat complexity in eucalypt forests fir wildlife management. Wildlife Research 24:691-703.
Coops NC, Johnson M, Wulder MA, White JC. 2006. Assessment of QuickBird high spatial resolution imagery to detect red attack damage due to mountain pine beetle infestation. Remote Sensing of Environment 103:67-80.
Coops NC, Smith, M. L., Jacobsen, K. L., Martin, M., Ollinger, S. 2004. Estimation of plant and leaf area index using three techniques in a mature native eucalypt canopy. Austral Ecology 29:332-341.
Coops NC, Stone C, Culvenor DS, Chisholm L, Merton R. 2003b. Chlorophyll content in eucalypt vegetation at the leaf and canopy scales as derived from high resolution spectra data. Tree Physiology 23:23-31.
Crous PW. 1998. Mycosphaerella spp. and their anamorphs associated with leaf spot diseases of Eucalyptus. Mycologia Memoir (APS Press).
Crous PW, Groenewald JZ, Mansilla JP, Hunter GC, Wingfield MJ. 2004.
Curran PJ. 1982. Multispectral photographic remote sensing of green vegetation biomass and productivity. Photogrammetric Engineering and Remote Sensing 48:243-250.
Dalla Marta A, De Vincenzi M, Dietrich S, Orlandini S. 2005. Neural network for the estimation of leaf wetness duration: application to a Plasmopara viticola
infection forecasting. Physics and Chemistry of the Earth 30:91-96.
Datt B. 1998. Remote sensing of chlorophyll a, chlorophyll b, chlorophyll a +b, and total carotenoid content in eucalyptus leaves. Remote Sensing of
Environment 66:111-121.
Datt B. 1999. Remote sensing of water content in Eucalyptus leaves. Australian Journal of Botany 47:909-923.
Davidson NJ, Battaglia M, Close DC. 2004. Photosynthetic responses to overnight frost in Eucalyptus nitens and E. globulus. 18:245-252.
de Vallavielle-Pope C, Giosue S, Munk L, Newton A, C., , Niks R, E., , Ostergard H, Pons-Kuhnemann J, Rossi V, Sache I. 2000. Assessment of
epidemiological parameters and their use in epidemiological and forecasting models of cereal airborne diseases. Agronomie 20:715-727.
Dick M. 1982. Leaf-inhabiting fungi of eucalypts in New Zealand. New Zealand Journal of Forestry Science 12:525-537.
Elliot HJ, de Little DW. 1984. Insect pests of trees and timber: Forestry Commission Tasmania, Hobart.
Farrington A, Hickey BA. 1989. Wood sources for the Port-Huon-Mill - NSSC pulping of some young Eucalypt species. Appita Journal 42:419-423.
Ganapathi A. 1979. Studies on the etiology of the leaf spot disease of Eucalyptus spp. caused by Mycosphaerella nubilosa (Cke.). Hansf. Thesis type. University of Auckland, New Zealand: Auckland.
Ganpathi A. 1979. Studies on the etiology of the leaf spot disease of Eucalyptus spp. caused by Mycosphaerella nubilosa (Cke.). Hansf. Thesis type. University of Auckland, New Zealand: Auckland.
Gezahgne A, Roux J, Hunter GC, Wingfield MJ. 2006. Mycosphaerella species associated with leaf disease of Eucalyptus globulus in Ethiopia. Forest Pathology 36:253-263.
Gilles T, Evans N, Fitt B, Jeger M. 2000. Epidemiology in relation to methods for forecasting light leaf spot (Pyrenopeziza brassicae) seveity on winter oilseed rape (Brassica napusi) in the UK. European Journal of Plant Pathology 106:593-605.
Heller RC, Bega RV. 1973. Detection of forest diseases by remote sensing. Journal of Forest Research 71:18-21.
Hickey GM, Innes JL, Kozak RA, Bull GQ, Vertinsky I. 2005. Monitoring and information reporting for sustainable forest management: An international multiple case study analysis. Forest Ecology and Management 209:237-259.
Hood I, Gardener J, Kimberley M, Molony K. 2002a. Variation among eucalypt species in early susceptibility to the leaf spot fungi Phaeophleospora eucalypti and Mycosphaerella spp. New Zealand Journal of Forestry Science 32:235-255.
Hood IA, Chapman SJ, Gardener JF, Molony K. 2002b. Seasonal development of
Septoria leaf blight in young Eucalyptus nitens plantations in New Zealand. Australian Forestry 65:153-164.
Hoppmann D, Wittich K-P. 1997. Epidemiology-related modelling of the leaf-wetness duration as an alternative to measurements, taking Plasmopara viticola as an example. Journal of Plant Diseases and Protection 104:533-544.
Hunter GC. 2002. Mycosphaerella causing leaf blotch on eucalypt species in South Africa. Thesis type. University of Pretoria: South Africa.
Hunter GC, Roux J, Wingfield BD, Crous PW, Wingfield MJ. 2004. Mycosphaerella
Hunter GC, Wingfield BD, Crous PW, Wingfield MJ. 2006. A multi-gene phylogeny for species of Mycosphaerella occurring on Eucalyptus leaves. Studies in Mycology 55:147-161.
Kennedy R, Gilles T. 2003. Brassicaspot a forecasting system for foliar disease of vegetable brassicas. In: 8th International Congress of Plant Pathology. Christchurch, New Zealand p131.
Leckie D, Cloney E, Joyce S. 2005. Automated detection and mapping of crown discolouration caused by jack pine budworm with 2.5m resolution
multispectral imagery. International Journal of Applied Earth Observation and Geoinformation 7:61-77.
Leckie D, Teillet PM, Fedosejevs G, Ostaff DP. 1988. Reflectance characteristics of cumulative defoliation of balsam fir. Canadian Journal of Forest Research 18:1008-1016.
Llorente I, Vilardell P, Bugiani R, Gherardi I, Montesinos E. 2000. Evaluation of BSPcast disease warning system in reduced fungicide use programs for management of brown spot of pear. Plant Disease 84:631-637.
Loch AD, Floyd RB. 2001. Insect pests of Tasmanian blue gum, Eucalyptus globulus, in south-western Australia: History, current perspectives and future prospects. Austral Ecology 26:458-466.
Lucas JA. 1998. Plant Pathology and Plant Pathogens, Third Edition ed. Malden, USA: Blackwell Publishing.
Lundquist JE, Purnell RC. 1987. Effects of Mycosphaerella leaf spot on growth of
Eucalyptus nitens. Plant Disease 71:1025-1029.
Machardy WE, Gadoury DM, Gessier C. 2001. Parasitic and biological fitness of
Venturia inaequalis: relationship to disease management strategies. Plant Disease 85:1036-1051.
Mangold RD. 1998. Overview of the Forest Health Monitoing Program. In: Hansen M, Burk T, editors. Intergrated Tools for Natutal Resources Inventories in the 21st Century: An International Conference on the Inventory and Monitoring of Forested Ecosystems. General Technical Report NCRS-212 USDA FS North Central Research Station. p 129-140.
Maxwell A, Dell B, Neumeister-Kemp H, Hardy G. 2003. Mycosphaerella species associated with Eucalyptus in south-western Australia: new species, new records and a key. Mycological Research 107:351-359.
Meentemeyer R, Rizzo D, Mark W, Lotz E. 2004. Mapping the risk of establishment and spread of sudden oak death in California. Forest Ecology and
Management 200:195-214.
Milgate AW, Yuan ZQ, Vaillancourt RE, Mohammed C. 2001. Mycosphaerella
species occurring on Eucalyptus globulus and Eucalyptus nitens
plantations of Tasmania, Australia. Forest Pathology 31:53-63.
Mohammed C, Wardlaw T, Smith A, Pinkard L, Battaglia M, Tommerup I, Potts B, Vaillancourt R. 2003. Mycosphaerella leaf diseases of temperate eucalypts around the southern pacific rim. New Zealand Journal of Forest Science 33:362-372.
Moskal LM, Franklin SE. 2004. Relationship among airborne multispectral image texture and aspen defoliation. International Journal of Remote Sensing 25:2701-2711.
National Forest Inventory. 2005. Australia's State of the Forests Report 2005. In. Canberra: Bureau of Rural Sciences.
Neumann FG. 1993. Insect pest problems of eucalypt plantations in Australia. Australian Forestry 56:370-374.
O'Reilly-Wapstra JM, McArthur C, Potts BM. 2002. Genetic variation in resistance of
Eucalyptus globulus to marsupial browsers. Oecologia 130:289-296.
Ohmart CP. 1990. Insect pests in intensively-managed eucalypt plantations in Australia: some thoughts on this challenge to a new era in forest management. Australian Forestry 53:7-12.
Old KM, Wingfield MJ. 2003. A Manual of Diseases of Eucalypts in South-East Asia. Jakarta: Centre for International Forestry Research.
Park RF. 1984. The taxonomy, pathology, and epidemiology of Mycosphaerella
species associated with leaf disease of Eucalyptus in Australia. Thesis type. La Trobe University: Melbourne.
Park RF. 1988a. Effect of certain host, innoculum, and environmental factors on infection of Eucalyptus species by two Mycosphaerella. Transactions of the British Mycological Society 90:221-228.
Park RF. 1988b. Epidemiology of Mycosphaerella nubilosa and M. cryptica on
Eucalyptus spp. in South-Eastern Australia. Transactions of the British Mycological Society 91:261-266.
Park RF, Keane PJ. 1984. Further Mycosphaerella species causing leaf diseases of
Eucalyptus. Transactions of the British Mycological Society 83:93-105.
Park RF, Keane PJ. 1987. Spore production by Mycosphaerella species causing leaf diseases of Eucalyptus. Transactions of the British Mycological Society 89:461-470.
Pathogens of Eucalypts. Collingwood; Australia: CSIRO Publishing. p 153-239.
Pietrzykowski E, Booth T, Battaglia M, Stone C, Mohammed C, Pinkard L, Wardlaw T, Smith A. 2003a. Is the risk on an epidemic too high? Case Study: Risk and Remote Sensing of Mycosphaerella leaf blight. Techniques for
modeling disease risk, forecasting epidemics and monitoring disease symptom spread using remote sensing. Poster presentation CRC-SPF Annual Meeting Cradle Mountain, Tasmania, 21st-23rd October 2003.
Pietrzykowski E, McArthur C, Fitzgerald H, Goodwin AN. 2003b. Influence of patch characteristics on browsing of tree seedlings by mammalian herbivores. Journal of Applied Ecology 40:458-469.
Pinkard EA, Baillie CC, Patel V, Paterson S, Battaglia M, Smethurst PJ, Mohammed CL, Wardlaw T, Stone C. 2006. Growth responses of Eucalyptus globulus
Labill. to nitrogen application and severity, pattern and frequency of artificial defoliation. Forest Ecology and Management 229:378-387.
Prudic KL, Oliver JC, Bowers MD. 2005. Soil nutrient effects on oviposition
preference, larval performance, and chemical defence of a specialist insect herbivore. Oecologia 143:578-587.
Rapley L. 2005. Eucalyptus globulus leaf chemistry and variation to insect attack. Thesis type. University of Tasmania, Australia: Hobart.
Smethurst P, Baillie C, Cherry M, Holz G. 2003. Fertilizer effects on LAI and growth of four Eucalyptus nitens plantations. Forest Ecology and Management 176:531-542.
Smith A. 2006. Management of foliar pathogens on Eucalyptus plantations. Thesis type. University of Tasmania: Hobart.
Smith A, Wardlaw T, Pinkard E, Wotherspoon K, Mohammed C. 2006. Effects of
Mycosphaerella Leaf Disease on the growth and wood quality of
Eucalyptus globulus. Canadian Journal of Forest Research Submitted.
Smith AH, Pinkard EA, Stone C, Battaglia M, Mohammed CL. 2005. Precision and accuracy of pest and pathogen damage assessment in young eucalypt plantations. Environmental Monitoring and Assessment:1-14.
Snowdon P. 2002. Modeling Type 1 and Type 2 growth responses in plantations after application of fertilizer or other silvicultural treatments. Forest Ecology and Management 163:229-244.
Stensvand A, Gadoury DM, Amundsen T, Semb L, Seem R. 1997. Ascospore release and infection of apple leaves by conidia and ascospores of Venturia inaequalis at low temperatures. Phytopathology 87:1046-1053.
Stone C, Chisholm L, Coops N. 2001. Spectral reflectance characteristics of eucalypt foliage damaged by insects. Australian Journal of Botany 49:687-698.
Stone C, Chisholm L, McDonald S. 2005. Effects of leaf age and psyllid damage on the spectral reflectance properties of Eucalyptus saligna foliage.
Stone C, Coops N, Sims N, Ryan P, Loughead A, Stanford M, Goodwin N. 2004a. Remote assessment of pine plantation condition: A handbook describing the use of multi-spectral imagery to measure impacts form three damaging agents of Pinus radiata. Report to Forestry and Wood Products Research and Development Corporation (FWPRDC). In. Melbourne: CSIRO Forestry and Forest Products. p 1-55.
Stone C, Coops NC. 2004. Assessment and monitoring of damage from insects in Australian eucalypt forests and commercial plantations. Australian Journal of Entomology 43:283-292.
Stone C, Coops NC, Sims N, Ryan P, Loughhead A, Stanford M, Goodwin N. 2004b. Application of multispectral imagery to the management of pine plantation condition and productivity
In. Melbourne: Forest and Wood Products Research and Development Corporation (FWPRDC). p 1-56.
Stone C, Haywood A. 2006. Assessing canopy health of native eucalypt forests. Ecological Management and Restoration 7:24-30.
Stone C, Matsuki M, Carnegie A. 2003a. Pest and disease assessment in young eucalypt plantations: field manual for using the Crown Damage Index. Canberra: Parsons, M. National Forest Inventory, Bureau of Rural Sciences.
Stone C, Simpson JA, Eldridge RH. 1998. Insect and fungal damage to young
Stone C, Wardlaw T, Floyd R, Carnegie A, Wyalie R, de Little D. 2003b. Harmonisation of methods for the assessment and reporting of forest health in Australia - a starting point. Australian Forestry 66:233-245.
Taylor MC, Hardwick NV, Bradshaw NJ, Hall AM. 2003. Relative performance of five forecasting schemes for potato late blight (Phytophthora infestans) I. Accuracy of infection warnings and reduction of unnecessary, theoretical, fungicide applications. Crop Protection 22:275-283.
Twengstrom E, Sigvald R, Svensson C, Yuen J. 1998. Forecasting Sclerotinia stem rot in spring sown oilseed rape. Crop Protection 17:405-411.
Wall E, Keane PJ. 1984. Leaf spots casued by Aulographina eucalypti. Transactions of the British Mycological Society 82:257-273.
Wardlaw T. 2002. Response to Mycosphaerella leaf blight of E. globulus planted in windrows and bays. In. Hobart: Forestry Tasmania p1-12.
Wardlaw T, Smith A, Pinkard E, Wotherspoon K, Mohammed C. 2006. The impact of a single epidemic of Mycosphaerella leaf disease on the growth of
Eucalyptus globulus. In: CRC for Forestry, editor. Risk, impact on productivity and control of Mycosphaerella infection in plantations of
Eucalyptus nitens and E. globulus. Hobart: Report to Industry. p 40-49.
Whittock SP, Greaves BL, Apiolaza LA. 2004. A cash flow model to compare coppice and genetically improved seedling options for Eucalyptus
globulus pulpwood plantations. Forest Ecology and Management 191:267-274.
Wilson BA, Lewis A, Aberton J. 2003. Spatial model for predicting the presence of cinnamon fungus (Phytophthora cinnamomi) in sclerophyll vegetation communities in south-eastern Australia. 28:108-115.
Wingfield MJ, Crous PW, Peredo HL. 1995. A preliminary, annotated list of foliar pathogens of Eucalyptus spp. in Chile. South African Forestry Journal 173:53-57.
Woods A, Coates KD, Hamann A. 2005. Is an unprecedented Dothistroma Needle Blight epidemic related to climate change? Bioscience 55:761-769.
____________________________________________________________________
Work from this chapter will be published as:
Pietrzykowski, E., Foster, S., Pinkard, L., and Mohammed, C. Factors influencing the periodicity and density of atmospheric ascospores at a plantation site in
Tasmania of Eucalyptus globulus infected with Mycosphaerella nubilosa. Forest Pathology. In prep.
2.1 Introduction
Our understanding of Mycosphaerella spp. epidemiology in eucalyptus has been derived from studies conducted in the late 1970’s and early 1980’s in south-eastern Australia and New Zealand on the species Mycosphaerella nubilosa and M. cryptica (Cheah 1977; Beresford 1978; Ganpathi 1979; Cheah and Hartill 1987; Park and Keane 1987; 1988). These investigations focused on the taxonomy and biology of the pathogen, including the environmental conditions required for lesion development and ascospore maturation, discharge and germination (see Appendix 1 for details on these studies).
From their studies with E. delegatensis, Beresford (1978) and Cheah (1977) concluded that ascospore discharge in the field occurred under similar conditions to those occurring in the laboratory. They reported that the presence of rain or moisture in the form of dew or near-saturation relative humidity were sufficient for ascospore discharge to occur (Cheah 1977; Cheah and Hartill 1987). Beresford (1978) found ascospore density peaked when rainfall occurred after a long dry period, which was in agreement with laboratory results (Park and
Chapter 2.
Atmospheric ascospore density s of
Keane 1987; Park 1988). Results from MLD field trials are predominantly descriptive, compared with results from laboratory experiments obtained under controlled conditions. This is because detailed and reliable meteorological data were not easily obtained at the time many of the experiments were conducted.
Spore trapping in New Zealand indicated that the highest atmospheric ascospore density s of the Mycosphaerella species under investigation coincided with summer and autumn, during the host’s maximal vegetative growth period, and reduced with the onset of winter (Cheah 1977; Beresford 1978; Cheah and Hartill 1987). These are similar to observations made with Kirramyces eucalypti (Cook & Massee) J. Walkerin E. nitens in New Zealand (Hood, Chapman et al. 2002) (Appendix 1). From these results it was concluded that the annual disease cycle of Mycosphaerella spp. commences in spring if low levels of
ascospore inoculum are available. Disease and ascospore build-up occurs during the host’s vegetative growth period when meteorological variables favourable to MLD are present (long periods of rainfall, high relative humidity and/or prolonged leaf wetness) (Park 1984).
To date, studies completed on M. cryptica and M. nubilosa have been either short-term laboratory experiments under constant environment conditions, or field experiments that were based on ascospore data counted on a weekly time frame (Cheah 1977; Beresford 1978; Park 1984) (Appendix 1). The most detailed field data collected involved counting
To aid in planning of control strategies, especially fungicide application, it is important to know if fungi have spore specific release patterns (periodicity and density). These patterns may be seasonal and/or diurnal and influenced by meteorological factors. The timing of fungicide applications to coincide with threshold values of atmospheric spores and
meteorological variables. is a common disease management practice in agricultural crops, such as apples (e.g Rossi, Ponti et al. 2001), broccoli (e.g Kennedy and Gilles 2003), and potatoes (e.g Taylor, Hardwick et al. 2003). In apple orchards where Venturia inaequalis
(Cooke) Wint. is a problem, fungicides are applied when ascospores are actively released into the atmosphere (Rossi, Ponti et al. 2001). The spore trap is employed to monitor atmospheric ascospore density s and the information they give trigger intervention. Spore release patterns can also be predicted using simulation models based on meteorological parameters (e.g. Burt, Rosenberg et al. 1999; Aylor and Flesch 2001). As stated in Chapter 1, fungicide application is currently not a feasible option in a eucalyptus plantation system. If a suitable “environmentally-friendly”, low costing fungicide becomes available, it will be necessary to understand and predict Mycosphaerella ascospore release patterns.
In the following study, hourly Mycosphaerella ascospore density field data were used alongside hourly meteorological data to investigate the effect of meteorological variables on atmospheric ascospore density s over approximately 28 months. The field studies were completed to extend our knowledge of the ascospore release patterns of M. nubilosa
Specific aims of this work were to (a) investigate the effects of a range of meteorological variables on atmospheric Mycosphaerella ascospore periodicity and density in an
E. globulus plantation, (b) identify seasonal and/or diurnal patterns in atmospheric ascospore periodicity and density in the field and which meteorological variables most affect these patterns, and (c) describe mathematically the ascospore release patterns and present the first steps towards producing a MLD warning system.
2.2 Methods 2.2.1 Study site
The study was conducted in a Eucalyptus globulus plantation (CH033B) located 15 km from Smithton at Christmas Hills, in north-west Tasmania, Australia (S40° 55’ 21”: E144°
Figure 2.1. Location of the automated weather station and spore trap (Quest Volumetric Spore Trap) in a E. globulus plantation (CH033B) used to trap ascospores of
Mycosphaerella Leaf Disease, at Christmas Hills, in north-west Tasmania (Inset).
E globulus E nitens
2 Lane road
Native forest
Eucalypt plantation
Water
Spore trap
Automated weather station
2.2.2 Data
Atmospheric ascospore density and meteorological data were collected for this study. Data were collected from the 5th September 2002 (Spring) through to 11th November 2004 (Spring) at the field site. Trees were 308 days old when data collection began.
Atmospheric ascospore density
Atmospheric ascospore densities were studied using a Quest Volumetric Spore Trap (Melpat International Pty Ltd, Canningvale, WA, Australia). The trap was adjusted to sample 20 litres of air per min through a 25 mm × 2 mm orifice that was approximately
50 cm above the plantation floor. The trap’s vacuum was powered by a 12-volt car battery that was attached to two solar panels allowing for continuous and constant power over the duration of the experiment. Perspex (toughened plastic) disks were placed into the trap and mechanically rotated exposing the disk to an opening through which air was impacted. Disks were divided into 8 segments corresponding to 8 individual days, and further divided into 24 hour bands. Disks were lightly sprayed with Vaseline lubricant to ensure spores would remain on the disk. The trap was placed in a central location of the plantation between tree rows (Figure 2.1) which were 2.5 metres apart. As the trees reached heights of 2 metres the trap was also raised to 2 metres, to be level with the top of the canopy. This was done to ensure branches from neighbouring trees did not obstruct the trap. The trap was raised on the 3rd of October 2003.
Ascospores were examined using a microscope using ×200 magnification and were
most dominant (Glen, Smith et al. 2007). Samples were counted from each hour by
counting one random field of view for each hour and multiplying up to give one hour (note: there were 54 fields of view in each hour). To examine the accuracy of the sampling
method, ascospores were counted for the complete area designated to an hour and compared to the scaled up sample. The relationship between observed and estimated ascospore
densities per hour was examined using linear regression.
Figure 2.2. Ascospore of Mycosphaerellanubilosa as seen under the microscope (a) at 200x magnification and a sketch (b).
Meteorological data
Hourly records of meteorological variables (see Table 2.1) were recorded at an onsite automated meteorological station (ENSIS, Hobart, Australia) (see Figure 2.1 for location of meteorological station at study site). Temperature and humidity were measured using a temperature/humidity probe (Vaisala HMP35A. Helsinki, Finland), solar radiation using a Licor L1I200X pyranometer (Nebraska, USA), wind speed using a Met One 014A
anemometer (Oregon, USA) and rainfall using a tipping-bucket rain gauge that was 200 mm in diameter and recorded rainfall in units of 0.2 mm per tip (Monitor Sensors TBRG Qld., Australia). Sensors were connected to a Campbell Scientific 21X multiplexer data
logger (Campbell Scientific, Logan, Utah, USA), which recorded the hourly data and calculated vapour pressure deficit (VPD). The logger also calculated daily averages for each of the climatic variables in addition to recording the maximum and minimum daily temperature and maximum rainfall every 5 minutes. The sensors and logger were located approximately 1.5 m above the ground inside a protective Stanley screen housing. The solar radiation sensor was located at the top of the screen (~2 m) and both the anemometer and rain gauge were located 3 meters away from the station in opposite directions. The anemometer was secured 2 meters above the ground and the tipping bucket rain gauge was fastened on a 30×30 cm concrete slab at ground level.
Table 2.1. Meteorological variables recorded at Christmas Hills (see Figure 2.1 for the location of the meteorological station at the study site).
Meteorological variable R = Rainfall (mm)
T = Average temperature (°C)
TMAX = Maximum temperature (°C)
TMIN = Minimum temperature (°C)
RH = Average relative humidity (%)
VPD = Average vapour pressure deficit (Kpa) SR = Average solar radiation (KW/m2)
WV = Average wind velocity (ms-1)
Missing and unreliable data
There were two periods where the weather station failed and data were not available. These were during the periods 23rd July 2003 to 11 September 2003 and 13 January 2004 to 26th February 2004. See section 2.2.3 Data analysis, for details on how the missing data were handled.
of Meteorology (this variable was denoted as BOMSolRad) for its Cape Grim meteorological station (40˚ 40’S, 144˚ 41’E) on the north west coast of Tasmania, approximately 30 km from the study site. The effect of the geographical difference between the two sites is assumed to be negligible.
Additional data variables
Additional variables were used in data analysis. These included age of the plantation and a number of variables further derived from the meteorological variables. These were chosen based on conceptual models from previous studies (Gottwald and Bertrand 1982;
Papastamati, van den Bosch et al. 2002; De Wolf, Madden et al. 2003; Mondal, Gottwald et al. 2003; Prados-Ligero, Melero-Vara et al. 2003) and are included in Table 2.2.
Descriptions of the variables explain the conceptual model which is hypothesized to effect ascospore density. The temperature range variable (TRange) was chosen considering the
empirical distribution (10th and 90th percentiles) of the temperature data for days when ascospores were recorded.
Table 2.2. Additional variables computed from meteorological variables logged by the weather station and regarded as important for the conceptual model.
Variable Description
RH90 A binary variable indicating if relative humidity is above 90%
RH90Time The length of time (measured in days) that the RH has been above 90%
Rain A binary variable indicating if it is raining
RTimeSince The length of time (measured in days) since the last rain event
RDSR Number of days since rain
TInRange A binary value indicating if the temperature is in the range 5 °C-15 °C
THrsOutRange The length of time (measured in days) that the temperature is outside the
temperature range 5 °C-15 °C
2.2.3 Data analysis
Data used for analyses were ascospores per cubic litre per hour (spores L-3hr-1). Analyses were split into three parts 1) investigation of seasonal and diurnal patterns in spore density, 2) effects of meteorological variables on hourly ascospore density and 3) mathematical description of ascospore presence/absence and density patterns.
1) Investigation of seasonal and diurnal patterns in ascospore density
Dates when maximum ascospore densities were recorded were noted. Average seasonal and monthly values were calculated to identify patterns in the data. Hourly ascospore data were averaged for each hour of the day to investigate diurnal density patterns on days with and without rain.
2) Effects of meteorological variables on hourly ascospore density
Relationships between ascospore densities and meteorological variables were examined using scatter plots of the daily data and fitted with a trend line to extract outer boundaries. Additionally, a 100-day sequence of data was randomly chosen and used to examine daily lag time effects of rainfall and relative humidity on ascospore density.
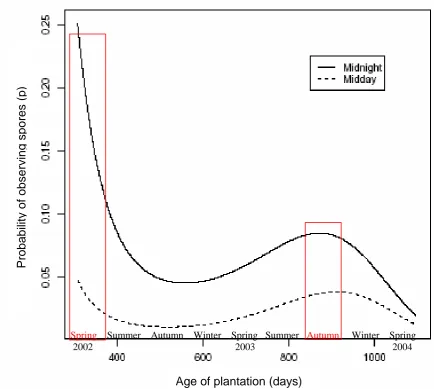
3) Mathematical description of ascospore presence/absence and density patterns
This component was split into three sections and included fitting a mathematical function to (a) the patterns of ascospore presence with age of plantation, (b) the effect of
Patterns were investigated for daily and diurnal (hourly) data as follows:
Ascospore data were converted into a binary variable to investigating the presence (1) or absence (0) of ascospores. This eliminated the complication of including meteorological data and ascospore density for initial investigations into the effects of plantation age and/or season on ascospore density.
The mathematical functions (Appendix 2) used to describe the patterns, in the data were additionally used to calculate the probability of an ascospore release occurring and the density of ascospore density s once a release had been observed. Both calculations were based on the meteorological variable values during the time of ascospore release. Appendix 2 gives an example of how to calculate the probability of ascospore release occurring excluding (Section 1) and including (Section 2) meteorological data, in addition to estimating the density of the ascospore release.
Function application that did not include meteorological effects used the full ascospore data set. Size of the set was reduced for analyses that did include weather variables, by
2.3 Results
2.3.1 Ascospore counting method
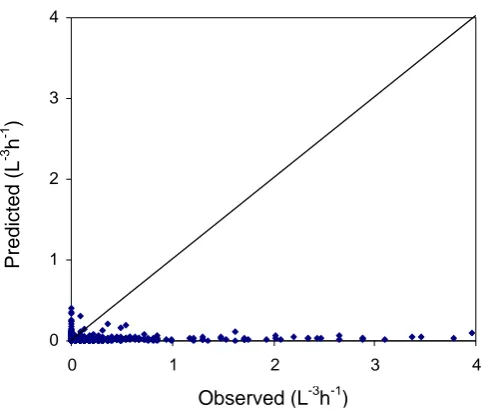
Figure 2.3 depicts the fit of observed versus estimated Mycosphaerella spp. ascospore density data. Ascospores per unit volume from one field of view (scaled up to 1 hour) could be used to estimate the actual density of ascospores per hour. There was more unexplained error (variation) in the model at low ascospore densities.
Figure 2.3. Density (observed) of trapped Mycosphaerella spp. ascospores per hour period versus estimated ascospore density at Christmas Hills, Tasmania in September 2003.
2.3.2 Investigation of seasonal and diurnal patterns in ascospore density
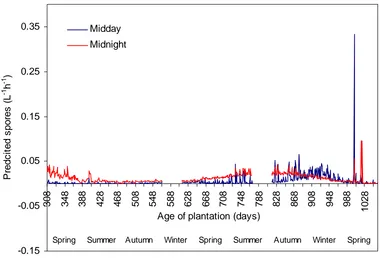
Seasonal periodicity of Mycosphaerella spp. ascospores were recorded throughout the collection period of the experiment, and substantial peaks in ascospore densities were observed in the second year of the experiment compared to the first (Figure 2.4). The highest total ascospore density for a day occurred during the second year of the experiment on December 15th with 23,976 ascospores being recorded. Peaks in ascospore density following December 15th were frequently observed. In comparison, during the first year of the experiment, the highest daily total was 2,700 ascospores on November 24th, with the remaining ascospore density observations being low and infrequent during the first year.
R2 = 0.9612 0 0.1 0.2 0.3 0.4 0.5 0.6 0.7 0.8 0.9 1
0 0.1 0.2 0.3 0.4 0.5 0.6 0.7 0.8 0.9 1 Observed (Spores L-1hr -1)
E s ti m at ed ( S po res L
-1 hr -1)
Observed (Ascospores L-1hr-1)
Estimated (Ascospores L
Figure 2.4. Average monthly atmospheric Mycosphaerella spp. ascospore density (average ascospores/L-3 hr-1 including standard error bars) throughout the data collection period (5th September 2002 through to 11th November 2004) at an E. globulus plantation at Christmas Hills, Tasmania. This graph shows greater ascospore densities during the second year (after November) compared to the first. It also shows that in the second year the highest density s were recorded in alternate months, beginning in December (summer).
0.0 0.5 1.0 1.5
A S O N D J F M A M J J
Time (months)
S
p
or
es
(L
-1hr -1)
1st Year
2nd Year
(Ascospores L
-3
hr
The seasonal results indicate variability in ascospore density between years (Figure 2.5). During the second year of the trial, ascospore densities increased markedly during the summer then decreased over the subsequent seasons.
Figure 2.5. Seasonal average (including standard error bars; P<0.05) atmospheric
ascospore density (spores L-3 hr-1) throughout the data collection period. The red arrow in this graph shows the reduction in ascospore density from summer to spring during the
second year of the trial. No pattern was evident from season to season during the first year.
Many of the peaks in ascospore density occurred up to 2 days after rainfall occurred was recorded and when average relative humidity was high (>90%). For example, Figures 2.6 and 2.7 include a 100-day sequence (randomly chosen) from the trial period depicting the increase in ascospore numbers within 2-3 days of a rainfall event and when relative humidity was high.
-0.1 0.0 0.1 0.2 0.3 0.4 0.5
Spring Summer Autumn Winter Spring Summer Autumn Winter Spring
Season
S
por
e
s
(
L
-1 hr -1 )
(Ascospores L
-3
hr
Figure 2.6 suggests the amount of rain does not affect ascospore release as low and high rainfall (mm) resulted in ascospores being trapped. The response to relative humidity (Figure 2.7) was similar (i.e. ascospores were recorded a few days after relative humidity increased), but not as obvious.
Figure 2.6. Observed daily ascospore density and rainfall data over a 00-day series (randomly chosen) from the 25th December 2003 – 3 April 2004. The red rectangle encompasses the days that include rainfall events and the associated ascospore record. The results suggest the density of the rainfall event (mm) does not influence the density of the ascospore release as most rainfall events (large and small) have an ascospore record associated with it. All of the ascospore densities were low.
0 5 10 15 20 25 30
0 5 10 15 20 25 30 35 40 45 50 55 60 65 70 75 80 85 90 95 100
Time (Days) R a in fa ll ( m m ) -10 -9 -8 -7 -6 -5 -4 -3 -2 -1 0 1 2 Sp o re s ( L -1 hr -1 )
Rainfall Spores
(Ascospores L
-3
hr