Discomfort from feeling vehicle vibration
M. J. GRIFFIN
2
Abstract
Vehicle refinement should include a consideration of the discomfort likely to be caused by vibration. This paper reviews the measurement, the evaluation, and the assessment of vehicle vibration felt by drivers and passengers.
The feeling of vibration that gives rise to judgements of vibration discomfort can be predicted using evaluation procedures that take account of human sensitivity to different magnitudes, frequencies, directions, and durations of vibration. The evaluation methods make it possible to optimise vehicles via dynamic modelling before the production of prototypes and they assist the testing and optimisation of prototypes and production vehicles.
Vibration evaluation provides imperfect predictions of discomfort when driver or passenger opinion is influenced by factors other than the vibration that is being measured and evaluated. Vibration evaluation can detect changes that are not detectable subjectively since smaller changes can be detected by measurement and evaluation than by subjective assessment.
1 Introduction
Vibration provokes sensations and responses varying from pleasure or displeasure, to interference with activities, injury, and disease. Human responses to vibration may be predicted if the vibration is ‘measured’, ‘evaluated’, and ‘assessed’ using understanding derived from studies of human responses vibration. Understanding comes from laboratory experimental exposures, from tests in real environments, and from vibration exposures at work and during leisure.
1.1 Measurement, evaluation, and assessment
The ‘measurement’ of vibration involves a transducer converting the movement into a representation that follows the motion with sufficient accuracy. This requires assumptions as to which parts of the motion cause the effect of interest. Measurements can be stored as tables of numbers, as waveforms on paper, as analogue recordings on magnetic tape, or in a digitised form for use by computers. The ‘evaluation’ of vibration measurements with respect to human response requires knowledge of the relative importance of different qualities in the vibration exposure (e.g. frequencies, directions, and durations) so as to produce values that reflect the relative severity of different exposures. It is common practice to ‘weight’ vibration according to the assumed effects of different vibration frequencies, directions, and durations. It is then possible to report a single ‘weighted’ value that represents the severity of the complex motion that was measured.
Vibration ‘assessment’ involves a consideration of the vibration and a judgement about it. Whereas evaluation results in a numerical value representative of the vibration severity, assessment predicts the outcome of a vibration exposure: the type, severity, or probability of a human response, or even the legal consequences. An assessment does not necessarily require measurement and evaluation of vibration: a particular type or source of vibration exposure could be labelled as unacceptable without knowledge of the vibration magnitudes.
4
the measurement method, the evaluation procedure, and the assessment criterion may encourage a more rigorous route to individual assessments and relevant standards.
1.2 Predicting discomfort in vehicles
For each environment where vibration is experienced, a different approach might be taken to the measurement, the evaluation, and the assessment of the vibration with respect to human response. Even when the environments are similar (e.g. cars and motor bicycles), different approaches might be advocated – possibly stemming from pre-existing methods of measuring, evaluating, or assessing vibration with respect to other effects, such as the condition of machinery or structural responses. The vibration to be measured may differ (e.g. the vibration on the seat or vibration at the hands, or a different range of vibration frequencies) and so two methods that appear to work in the environments for which they have been developed may differ and be inappropriate when applied to other environments. This allows the proliferation of many different methods – for cars and trucks, trains and motor bikes, aircraft and marine craft. Yet in all environments there is a common feature – the reaction comes from the human transducer! If the characteristics of the human are assumed to be similar in all environments, it should be possible to identify a single method of measurement, evaluation, and assessment that provides good predictions of comfort for all environments.
It is almost impossible to assess the appropriateness of a means of predicting human responses to vibration solely from experience of its use in the environment for which it is intended. Human responses to vibration are highly variable (both within and between individuals) and it is not simple to conduct a useful field assessment of a method of predicting human responses to vibration. Claims that a method has been ‘validated’ are usually based on limited evidence of consistency with some observations or impressions in a specific situation and not evidence that the method is appropriate over the full range of conditions to which it can be applied. In contrast, it can be easy to show by laboratory experiment or demonstration that some of the assumptions in methods evolved from field studies over the years make inappropriate assumptions about human responses to vibration (e.g., inappropriate weightings for the effects of frequency, direction, or duration).
environments if the response of interest differs – the discomfort caused by vibration in a train might be dominated by postural instability in standing passengers whereas discomfort in a car might be influenced by vibration of the steering wheel. ‘Assessment methods’ will likely differ between environments based on the degree of undesirable effect (e.g. probability of falling or degree of discomfort) that is considered acceptable, and this may be influenced by pragmatic considerations including the comfort of competitive transport and the ‘cost’ of reducing the undesired effect.
Where vibration measurements are made at equivalent locations with respect to the person (e.g. at the point of contact with the body), and the response of interest is similar (e.g. the strength of perception of vibration), it should be possible to define an evaluation method that predicts the response of interest in a wide range of environments. The ‘acceptable level’ of vibration may then be adjusted taking into account other considerations that influence the acceptability of the strength of perception of vibration in specific environments.
The ‘unification of methods of measuring, evaluating, and assessing human responses to vibration’, based on knowledge of factors influencing human responses, has many advantages. These include the ability to use common equipment and develop a greater pool of understanding of human responses.
To illustrate the unification of procedures, this paper focuses on the measurement, evaluation, and assessment of the feeling of vibration in road and rail vehicles that may give rise to judgements of discomfort. Vehicles can be judged as uncomfortable for many reasons and the vibration can be detected by several senses – principally touch, vision, and hearing. This paper concerns situations in which the response is dictated by feeling vibration. The methods defined will not be appropriate when responses are influenced by hearing or seeing movement.
2 The principles of vibration measurement
2.1 Measurement location
Vibration measurement should produce the information required (e.g. acceleration signals) for the evaluation of the vibration with respect to a specific response.
6
vehicle occupants will need to be measured if measurements are not made at interfaces with passengers or drivers (e.g. on the seat surface, on steering wheels). The vibration felt by people in vehicles is often transmitted from the floor. The vibration will vary across the floor of a vehicle. Vibration on the structure of a vehicle, such as the floor, may be convenient to measure or predict, but the vibration causing the discomfort of drivers and passengers is often predominantly the vibration on the seat, which can differ greatly from the vibration on the floor.
When predicting vibration discomfort, vibration is currently measured at the interfaces between the body and the vibrating environment (e.g. at the supporting seat surface, the backrest, the feet, the hands) (Figure 1).
FIGURE 1 ABOUT HERE
When standing, the vibration on the floor will determine whether the vibration is felt, so it is reasonable to measure the vibration of the floor. Sitting on a chair or lying in a bed, the vibration is modified according to the transmission of vibration through the seat or bed. Lower frequencies (usually less than 10 Hz) may be amplified by a seat or bed, while other frequencies may be attenuated. It is possible to measure at the interface between the body and the seat or bed using a SIT-pad (as used to measure vibration on car seats) [1].
Vibration of the body is the cause of vibration discomfort, and so it may be tempting to measure vibration on some part of the body (e.g. at the head) – but vibration causes discomfort at many different locations in the body and there are different magnitudes and directions of vibration at each location. Measurements of vibration on the body at locations other than the interfaces with the vibrating environment are not currently useful when predicting vibration discomfort.
2.2 Measurement bandwidth
It is current practice to use instrumentation conforming to standards for the measurement and evaluation of vibration with respect to human responses [2].
The vibration in vehicles can be felt over a wide range of frequencies, from less than 1 Hz to more than 300 Hz. At frequencies less than about 0.5 Hz, the dominant effect may be motion sickness, provoking sensations that differ from ‘vibration discomfort’ and require different methods of prediction [1].
For vibration of the hands and feet, there may be direct contact of the body without attenuation by compliant material. Current standards for hand-transmitted vibration extend to 1000 Hz, although experimental data on the frequency-dependence of vibration discomfort are not available at such high frequencies – the vibration causing discomfort will often cause unacceptable noise so consideration of vibration discomfort will often be limited to frequencies less than about 300 Hz.
3 The principles of vibration evaluation
Vibration evaluation should produce numerical values from which it can be predicted which of two or more vibrations are ‘greatest’ with respect to a specific human response.
The evaluation of vibration with respect to human response requires the use of procedures that reveal the relative or absolute severity of the vibration: it is not appropriate to assume that all frequencies, all directions, or all durations of vibration are of equal importance. An evaluation procedure will result in one (or a few) numbers such that the severities of different vibration exposures can be compared. This requires knowledge of the relative importance of different qualities in the measurement (e.g. different frequencies, directions, and durations).
The evaluation of vibration may be expressed on an interval scale (i.e. a scale on which differences between intervals on the scale have significance but the scale values themselves do not, and so the ratio of one scale value to another has no significance) or on a ratio scale (i.e. a scale on which the ratios of values on the scale have some quantitative significance so, for example, an environment with a rating of discomfort on a ratio scale twice that of another environment is associated with ‘twice as much discomfort’).
An evaluation could indicate the overall discomfort caused by a complex exposure to vibration or the relative importance of the components in the motion (e.g., specific frequencies, directions, locations) that cause the discomfort. The overall evaluation helps when comparing vehicles, but the breakdown of the overall evaluation into components provides the vehicle designer with the information needed for the efficient improvement of vehicle ride.
8
From the complex multi-axis vibration that is measured or predicted, one (or a few) numbers are usually sufficient to estimate the severity of a vibration in respect of discomfort. This is achieved by ‘weighting’ the vibration (which may encompass a range of magnitudes, frequencies, and directions of vibration at one or more points of contact with the body) according to the manner in which discomfort depends on the magnitude, frequency, direction, and duration of the vibration at those points.
3.1 Vibration magnitude
It is assumed that the greater the magnitude of vibration the greater the vibration discomfort. The discomfort of any vibration of interest can then be expressed in terms of the magnitude of a reference vibration that gives vibration discomfort equivalent to that of the vibration of interest.
The equivalent magnitude of the reference motion can be determined directly by asking subjects to compare a complex simulated ride with the reference motion and say which vibration they would prefer to be reduced if they were to be presented with them again. If the comparison is made over a range of magnitudes of the reference, the magnitude of the reference motion equivalent to the simulated ride can be determined, and this is the ‘value’ of the discomfort on the scale. In practice, the value is usually predicted from knowledge of how discomfort depends on the form of the vibration (i.e. its magnitude, frequency, direction, and duration) as described below.
The rate of increase in vibration discomfort with increasing vibration magnitude has been determined using Stevens’ power law, in which the relationship between the psychophysical magnitude, ψ (i.e., the ‘vibration discomfort’), and the physical magnitude, ϕ(i.e., the vibration magnitude),is assumed to be:
ψ = kϕn (1)
where k is a constant, and the exponent n describes the rate of change of sensation, ψ, with vibration magnitude, ϕ [5].
greater reduction of vibration discomfort than halving the magnitude of vibration at high frequencies.
3.2 Vibration frequency
Translational vibration
Experimental studies have evolved ‘equivalent comfort contours’ showing how discomfort varies with vibration frequency in each direction and at the principal interfaces with the body [1, 6-14]. For vertical seat vibration, equivalent comfort contours over the range 2 to 100 Hz obtained by Griffin et al. [12] were combined with contours over the range 0.5 to 5 Hz obtained by Corbridge and Griffin [13] to develop a frequency weighting for discomfort that became known as Wb (see Figure
2). Other studies in the 1980s developed equivalent comfort contours for non-vertical vibration at the seat and for vibration of the back and feet of seated persons. More recently, equivalent contours have been obtained from 2 to 315 Hz for a range of magnitudes of fore-and-aft, lateral and vertical vibration at the seat (as shown in Figure 3, [6]) and at the hand (as shown in Figure 4, [7]), and at the feet [unpublished].
FIGURES 2, 3 and 4 ABOUT HERE
The recent studies show that the shapes of equivalent comfort contours depend on the vibration magnitude – they generally become less flat with increasing magnitude – sensitivity to high frequency vibration relative to low frequency vibration decreases with increasing vibration magnitude – because the rate of growth with vibration magnitude (i.e. the exponent n in Stevens’ power law) is less at high frequencies. The contours shown in Figure 3 were obtained with independent vibration at each location and in each axis (i.e. only one component of motion at a time). In consequence, there was relative motion between the feet and the seat and this was responsible for increased sensitivity (i.e. a lower contour) with low frequency vertical vibration of the seat than is obtained when seat and feet move together. The contours for low frequency vibration in Figure 2 were obtained with the same motion at the seat and feet and show reduced sensitivity to low frequency vibration. Jang and Griffin showed that relative motion between seat and feet at low frequencies can have a large effect on judgements of the discomfort of low magnitude vibration [15,16].
10
The dependence of vibration discomfort on rotational vibration (roll, pitch and yaw oscillation) has also been determined and used to produce frequency weightings for rotational vibration over the range 0.5 to 80 Hz [10] (see below).
Roll and pitch oscillation results in acceleration being measured in the lateral and fore-and-aft axes, respectively, due to rotation of translational accelerometers relative to the gravity vector. With high frequencies, where there are only small angles of rotation, the acceleration measured as a result of tilting is small. With low frequencies, where the angle of tilt can be large, the gravitational component can be a significant part of the measured ‘horizontal’ acceleration.
The discomfort caused by low frequency lateral and roll oscillations has usually been predicted from the lateral acceleration in the plane of the seat, irrespective of whether the measured acceleration comes from lateral motion or a component of gravity arising from roll. Similarly, the discomfort caused by low frequency fore-and-aft and pitch oscillations has usually been predicted from fore-and-aft acceleration in the plane of the seat, irrespective of whether it comes from fore-and-aft motion or a component of gravity arising from pitch. Experimental studies have found that acceleration in the plane of the seat can provide useful predictions of discomfort from both lateral and roll oscillation, and also from fore-and-aft and pitch oscillation, but only at frequencies less than approximately 0.5 Hz. At higher frequencies, the lateral (or fore-and-aft) acceleration in the plane of the seat produced by roll (or pitch) oscillation results in greater discomfort than the same acceleration produced by pure lateral (or pure fore-and-aft) oscillation [8,17]. Further research is needed to develop a means of predicting with confidence the discomfort associated with combined translational and rotational oscillations at low frequencies.
3.3 Weightings for the direction of vibration
At some frequencies, the same vibration in two directions may produce similar discomfort – for example, a given magnitude of 3.15 Hz vibration in the vertical direction can produce discomfort similar to that caused by the same frequency and magnitude in the lateral direction. However, in general, the biodynamic responses of the human body (and, consequently, discomfort) varies between directions – for example, a given magnitude of 31.5 Hz vibration in the vertical direction may produce discomfort similar to that caused by the same frequency of lateral vibration with a 10 times greater magnitude.
weightings from equivalent comfort contours so that, after weighting (by both frequency and direction) a weighted vibration has a magnitude representative of the likely discomfort. For this purpose, the phase between motions at the same location but in different axes is currently ignored – although phase may affect comfort at low frequencies.
3.4 Weighting for location of contact with vibration
Experiments have explored the relative discomfort caused by vibration at different locations on the body, such as the seat, the backrest, the feet, and the hands [e.g., 12]. This has made it possible to adjust the weightings from equivalent comfort contours so that, after weighting (by frequency, direction, and location) a weighted vibration has a magnitude representative of the likely discomfort.
With simultaneous vibration at different locations, the relative phase between the input locations is not important with high frequency vibration but the phase can have a large effect at low frequencies. The effect of phase depends on the magnitude of the vibration, for example, with sinusoidal vibration at 2.5, 3.15, 4, 5, and 6.3 Hz and vibration magnitudes of 0.25, 0.4, 0.63, 1.0, and 1.6 ms-2 r.m.s., phase changes have the greatest effect at the lowest frequencies and the lowest magnitudes. Although there is clear evidence that vibration discomfort is influenced by the phase between the seat and the feet, the effect is a complex function of the frequency and magnitude of the vibration and the posture of the body, and it is currently not normally included in evaluations of vibration discomfort [15,16].
In general, phase differences are likely to be important only at low frequencies, but they can be important at other locations in addition to the feet. For example, the phase between motion of a backrest and motion of the seat has been found to be important with low frequency vibration (unpublished data).
Backrests also influence the extent to which low frequency roll, pitch, fore-and-aft or lateral oscillation causes discomfort [8,17]. Although a backrest might sometimes provide support and reduce discomfort, in many conditions the additional vibration input from a full-height backrest increases discomfort.
3.5 Duration
Traditionally, the r.m.s. value of time-varying quantities has been determined. So, for evaluating the frequency-weighted acceleration, aw(t), some vibration meters have
12 2 1 2 d ) ( 1 (r.m.s.) square -mean -root ⎥ ⎥ ⎦ ⎤ ⎢ ⎢ ⎣ ⎡
∫
a t t T = w =T t 0 = t (2)If a vibration is steady-state (continuous with no shocks), the r.m.s. value may provide a useful indication of the average severity of a vibration. However, vehicle vibration is often not steady-state and human reaction to a vibration depends on the duration over which vibration is felt. Asked to judge the relative discomfort of two vibrations differing only in their duration, people will say that, to obtain equivalence, the longer duration vibration should be of lower magnitude. The extent to which the magnitude must be reduced for different durations indicates the ‘weighting’ required for duration.
Most experimental studies of the effects of the duration of vibration on discomfort have been of short duration – partly because studies with long durations are time-consuming, difficult, and expensive. However, experimental studies have found that when people are asked to state their preferences for motions of varying magnitude and duration, a doubling of vibration magnitude requires, very approximately, a sixteen-fold reduction in duration to maintain equivalence [20,21] (Figure 5). This led to fourth-power relationships between the acceleration magnitude and duration. The root-mean-quad is identical to the r.m.s. except the square and square-root are replaced by a fourth power and a fourth root:
4 1 4 d ) ( 1 (r.m.q.) quad -mean -root ⎥ ⎥ ⎦ ⎤ ⎢ ⎢ ⎣ ⎡
∫
a t t T = w =T t 0 = t (3)The r.m.q. gives greater relative weight to occasional higher vibration magnitudes than the r.m.s., and seems to more appropriately reflect the greater sensitivity to shocks and other motions having occasional peaks [e.g., 1, 22, 23, 24].
FIGURE 5 ABOUT HERE
stationary (e.g. when encountering potholes or joints) and it is difficult to define the moment to start and end the r.m.s. or r.m.q. evaluation of events that vary in magnitude and duration. These problems can be overcome by the use of a measure that accumulates, rather than averages, the measured vibration.
The fourth-power relationship is therefore mostly used as a dose (as in the vibration dose value, VDV) that increases with duration, rather than as an average (as in the r.m.q.). The vibration dose value comes from the r.m.q. without dividing by the exposure duration: 4 1 4 d ) ( (VDV) value dose vibration ⎥ ⎥ ⎦ ⎤ ⎢ ⎢ ⎣ ⎡
∫
a t t = w T = t 0 = t (4)where aw(t) is the frequency-weighted acceleration and T is the period during which a
person is exposed to vibration.
The VDV can be used to quantify vibration events of any type. It is robust and not sensitive to variations in the time of starting or ending the period of measurement. It is sensitive to peaks in the vibration, because people are sensitive to peaks, so it is susceptible to instrumentation faults that lead to false peaks.
Vibration dose values obtained from different events (e.g. the passage of a vehicle over different bumps) can be compared to predict the main contributor to human response. Vibration dose values can be added (from the fourth root of the sum of the fourth powers of the VDVs) to obtain an overall value from a series of events. It is only necessary to measure one of each type of event and count the number of events to be able to calculate to total VDV for a day.
The vibration dose value can be estimated from the r.m.s. value and the exposure duration if the vibration is statistically stationary. For an exposure duration, t (in seconds), and frequency-weighted r.m.s. acceleration, arms (in ms-2 r.m.s.) the
'estimated vibration dose value' is given by:
estimated vibration dose value (eVDV) = 1.4 arms t¼ (5)
14
The a4t relationship (as in r.m.q. averaging, eVDV and VDV) implies that if a vibration magnitude of 0.25 ms-2 r.m.s. (a comfortable ride in many vehicles – see below) is considered acceptable for 24 hrs, 0.55 ms-2 r.m.s. will be acceptable for 1 hour, 1.5 ms-2 r.m.s. will be acceptable for 1 minute and 4.3 ms-2 r.m.s. will be acceptable for 1 second (see Figure 6).
The a2t relationship in r.m.s. averaging is very different to the a4t relationship and implies that if 0.25 ms-2 r.m.s. is acceptable for 24 hrs, 1.2 ms-2 r.m.s. will be acceptable for 1 hour, 9.5 ms-2 r.m.s. will be acceptable for 1 minute and 73 ms-2 r.m.s. will be acceptable for 1 second (see Figure 5). These are not safe exposures, let alone comfortable. The relation between acceleration and duration of exposure implicit in r.m.s. averaging (i.e. a2t) is not reasonable, whereas the relation in r.m.q. averaging and the VDV (i.e. a4t) seems reasonable.
FIGURE 6 ABOUT HERE
The eVDV is not applicable to transients, shocks, and repeated shock motions. For these motions, the true vibration dose value is required.
The vibration dose value is rugged, easy to use, and seems more appropriate than overall r.m.s. values (that may rise or fall with increasing duration) or a 1-s peak r.m.s. value (which is uninfluenced by vibration other than during the worst 1-s period). The fourth-power time-dependency seems to be useful over short durations (including single events such as shocks and transients) and also reasonable over periods as long as a full day. However, the vibration dose value (both the VDV and the eVDV) is best seen as a pragmatic solution to a complex problem rather than a reflection of an underlying mechanism in human perception of vibration.
3.6 Practical methods of evaluation
British Standard 6841:1987 [3] and International Standard 2631:1997 [4] define similar procedures for predicting vibration discomfort from measurements of vibration at the seat, the seat back, and the feet of seated persons (see Figure 1).
3.6.1 Effects of vibration frequency and direction
The standards define frequency weightings to take account of the different sensitivity of the body to different frequencies of vibration. Figure 7 shows frequency weightings
Wb to Wf as defined in British Standard 6841:1987 [3]. International Standard
2631:1997 [4] allows the use of Wk in place of the almost identical weighting Wb,
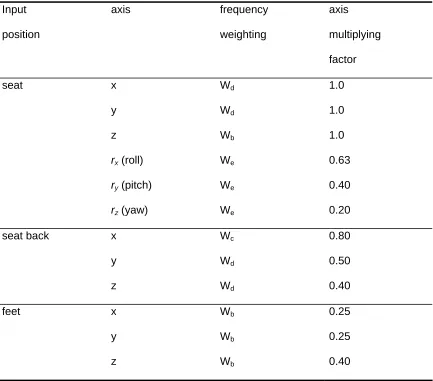
although it is not based on experimental studies and appears to be a less satisfactory predictor of discomfort. Table 1 shows how the weightings should be applied to the 12 axes of vibration illustrated in Figure 1. The weightings Wg and Wf are not
required to predict vibration discomfort: Wg has been used for assessing interference
with activities and is similar to the weighting for vertical vibration in the first version of ISO 2631 published in 1974 [25]; Wf is used to predict motion sickness caused by
vertical oscillation.
FIGURE 7 AND TABLE 1 ABOUT HERE
Some frequency weightings are used for more than one axis of vibration, with different 'multiplying factors' allowing for overall differences in sensitivity between axes (Table 1). The frequency-weighted acceleration should be multiplied by the multiplying factor before the component is compared with components in other axes, or included in any summation over axes. The r.m.s. value of this acceleration (i.e. after frequency weighting and after being multiplied by the multiplying factor) is called a 'component ride value'. In order to obtain an 'overall ride value', the 'root-sums-of-squares' of the component ride values is calculated:
overall ride value = (Σ (component ride values)2)½ (6)
16 3.6.2 Effects of vibration duration
British Standard 6841:1987 [3] says that the duration of exposure is one of many factors that should be taken into consideration when determining vibration limits (i.e. the ‘assessment’ of vibration) in respect of comfort. When the vibration is not statistically stationary (e.g. intermittent vibration or shocks), BS 6841:1987 advocates the use of the r.m.q. of the frequency-weighted acceleration in preference to the use of the r.m.s. value, which is expected to underestimate discomfort.
International Standard 2631:1997 suggests that the estimated vibration dose value, eVDV, is used to compare discomfort between environments. It says that in some environments the r.m.s. measure of vibration is not appropriate and then either the vibration dose value, VDV (equation (4) above), or the maximum transient vibration value, MTVV, is used. The MTVV is the ‘worst’ 1-second period of the frequency-weighted acceleration so it is only influenced by 1-second during a journey – unlike the VDV it does not combine shocks and vibration (all except the worst shock is ignored) and it does not increase with increasing duration of exposure to a motion. In consequence, the MTVV is not normally a useful indicator of ride comfort. The running r.m.s. of the frequency-weighted acceleration may provide a useful representation of the way in which vibration changes during a journey (see Figure 12.12 in the Handbook of Human Vibration pp 501 [1]), although the acceleration time history is sometimes more revealing (see Figure 12.9 on pp 495 and Figure 12.24 on pp 524 in the Handbook of Human Vibration [1]).
4 The principles of vibration assessment
Assessment requires decisions on the type, severity, and probability of the human response of interest. The ‘assessment’ of vibration in a vehicle may involve a judgement on what responses are acceptable and what responses are unacceptable. Whereas an evaluation results in a numerical value representative of the vibration severity, an assessment predicts the outcome of a vibration exposure. The complete assessment of vibration in a vehicle should include a judgment of the effects of vibration on health and activities as well as a consideration of discomfort.
The assessment of vibration discomfort may consider the behavioural consequences of discomfort, such as whether passengers will choose another form of transport. This behaviour may depend on the feeling of vibration but cannot be predicted solely from the feeling of vibration – it depends on the availability and characteristics of other transport and a person’s familiarity with the alternative means of transport, the relative costs, etc. In consequence, the assessment corresponding to an evaluation will depend on the context and vary from place to place and from time to time.
Assessments can be obtained by subjective judgements of real or simulated environments. They may alternatively be predicted from evaluations of measured rides, or from computer predictions of the rides in projected vehicles.
If it is assumed, for example, that a doubling of vibration magnitude corresponds to a doubling of vibration discomfort (see above), it is possible to use overall ride values as a ratio scale. Overall ride values may also be compared with Figure 8 showing the ranges of vibration magnitudes associated with varying degrees of discomfort according to BS 6841:1987 [3] and ISO 2631:1997 [4]).
FIGURE 8 ABOUT HERE
It is common automotive practice for test drivers to provide ratings of specific vehicle attributes on absolute scales of acceptability (often on a scale from 1 to 10). As quality generally advances, the ratings should improve, but relative to the competing forms of transport (both similar transport and alternative modes of transport) the quality may be degenerating. For this and other reasons, although such scales can give useful information they are less absolute than claimed. It may be best to consider them a convenient tool for making relative judgements when comparing vehicles, or for comparing different aspects of one vehicle.
18
The evaluation of vibration also makes it possible to predict how a projected new vehicle will be assessed compared to an existing vehicle or a projected competitive vehicle. Where the optimisation of vehicle ride includes mathematical simulation of the vehicle vibration, evaluation based on vibration predictions without subjective judgements is essential. The weightings in the evaluation method that reflect the sensitivity of the human body to the different characteristics of vibration affect the optimisation. An attempt to optimise ride without taking the sensitivity of people into account will not result in the optimum ride. Targets for acceptable vibration may be set during design, based on either ratings of discomfort or an evaluation of the measured vibration.
Targets for vibration discomfort in new forms of transport should consider the future and not only the present. A public transport vehicle may have a life of about 30 years. Comfort in public transport has increased greatly over the past 30 years and may be expected to improve over the next 30 years, so a vehicle that is only just acceptable today is be likely to be unacceptable before the end of its design life.
5 Discussion
5.1 The merits of measuring and evaluating vibration to predict discomfort
The logical development of a vehicle commences with a mathematical model of the dynamics of the vehicle and seating. This is used to optimise the dynamic response of the vehicle and seating prior to the construction of a prototype. This optimisation must utilise an evaluation method that take account of the sensitivity of the body to different frequencies, directions, and durations of vibration. When a vehicle is available for testing, the vibration may be measured and evaluated taking into account the sensitivity of the body to vibration, and thereby assist further optimisation of the dynamics. It is then also possible to obtain subjective evaluations that can contribute to the optimisation. The flow of events is summarised in Figure 9.
FIGURE 9 ABOUT HERE
Vibration evaluation and subjective evaluation are complementary. Incremental improvements can be detected by measuring and evaluating vibration when they are undetectable to observers. However, some problems can be detected by subjective evaluation but not detected by vibration evaluation.
sufficient without an apparently absolute ‘assessment’ of the vibration. Direction, location,
5.2 Disappointing results from measurements and evaluations
The measurement and evaluation of vibration will not properly predict human responses that are influenced by physical factors that are not measured. This is why the judgement of test drivers is required within product development – refinement may require attention to some aspects not included within the measurement and evaluation scheme. However, because such assessments are sometimes necessary it does not mean they are always superior to measurement and evaluation: competent measurement and evaluation supplemented by expert assessment is the desirable combination.
Other aspects of the environment (e.g., noise, thermal, visual and seating comfort), can influence judgements of vibration discomfort and overall comfort. Noise can influence judgements of vibration discomfort, and some research suggests a procedure for predicting the combined response to noise and vibration [27]. The discomfort caused by seat hardness and vibration also interact [28]. It should not be assumed that persons judging vibration know the extent to which their judgements are influenced by vibration and the extent to which they are influenced by other factors. If other factors remain constant and are not considered significant contributors to discomfort in the absence of vibration it might be thought that they have little influence. However, for example, changes to vibration are often accompanied by changes to the acoustic environment that may either mask a change in the vibration or heighten perception of a change in vibration, depending on the relative levels of the noise and the vibration.
Vibration evaluation will not reflect the influence of personal factors not included in the evaluation procedure. Such factors may include variability within subjects (e.g., personal preferences that vary between environments), or variability between subjects (e.g., exceptional sensitivity in a driver). In addition, the acceptability of vibration discomfort will always depend on the context (e.g. the expectations of the individual for that environment), and should therefore be expected to vary between individuals and over time.
20
This is partially because the change needed for an improvement to be detected is often greater than the change that can be measured. It is also because the ability to detect a change varies between people (some are relatively insensitive to changes) and because various factors can mask the existence of changes.
Another cause of disappointing correlations between measurements and judgements is that some methods of measuring and evaluating vibration are over-simplistic – they do not measure the vibration at an appropriate location or in appropriate directions, or do not allow for the varying sensitivity of the body to different frequencies and directions of vibration. With knowledge of the environment, it is often possible to develop simple procedures, but the simplification must be based on knowledge sufficient to decide that a component can be eliminated because it is unlikely to influence drivers or passengers. Even then, although it may not usually be a problem, an unusual vibration component might occasionally become the source of a problem requiring a solution. A complete procedure of vibration measurement and evaluation is therefore recommended and, with modern facilities, it is easy to achieve.
5.3 Effect of dynamic response of seating
Seating dynamics can greatly influence the vibration responsible for discomfort. Seats exhibit resonance resulting in higher magnitudes of vertical vibration on the seat than on the floor at low frequencies. At high frequencies, there is usually attenuation of vertical vibration. Resonances also occur with non-vertical vibration. The variations in transmissibility between seats are sufficient to result in significant differences in the vibration experienced by people supported by different seats. The influence of seats is sufficient for vibration measurements on the floor to be a poor indicator of vibration discomfort in many vehicles. Additionally, if vibration discomfort is judged from measurements of floor vibration it is not possible to improve the judgement by optimising the seat. In practice, ride can usually be improved by optimising the seating dynamics taking account of the input vibration and the sensitivity of people to vibration, using the SEAT value [1,29].
5.4 Limitations to standards for predicting vibration discomfort
2631:1997 is applied. More recent research has provided new information, so it may be useful to identify some of the known limitations of the underlying method.
5.4.1 Magnitude
The standards assume that the effect of vibration magnitude is the same for all frequencies, directions, and points of input of vibration to the body. In other words, a doubling of vibration magnitude has the same effect on a vibration evaluation irrespective of the frequency, direction, point of input of the vibration, or the duration of the vibration. As summarised above (Section 3.1), the exponent, n, in Stevens’ power law varies, and so a doubling of magnitude has a greater effect for some types of vibration than others. Although the difference may be large for some motions, the complexity of the problem makes it difficult to overcome by simple means. This is not likely to lead to early changes to the standards, although it partly explains the inappropriate frequency weighting for vertical vibration, Wg, in the old ISO 2631:1974
[25] that was influenced by studies at magnitudes of vibration far too high to be relevant to most situations where comfort is of concern.
The standards do not give precise information on absolute thresholds for the perception of vibration or any information on difference thresholds, both of which can be helpful when optimising a system to minimise vibration discomfort. Information on absolute thresholds is available and may eventually find its way into standards – thresholds for whole-body vibration and hand-transmitted vibration are shown in Figures 3 and 4 above. Research is underway to understand the factors that influence difference thresholds.
5.4.2 Frequency
The frequency weightings in the standards may be considered reasonable for evaluating the vibration in some transport environments (Figures 2, 3, 4 and 7). However, they are not optimum for very low magnitude vibration. At low magnitudes the sensitivity changes less with frequency. It may be better to use experimentally determined thresholds and low magnitude equivalent comfort contours than the standardised frequency weightings when evaluating low magnitude vibration.
5.4.3 Direction
22
The standards do not clearly address the effects of roll and pitch oscillation on measurements of acceleration in lateral and fore-and-aft directions as the accelerometers rotate through the gravitational vector. These components may dominate discomfort at frequencies less than about 0.4 Hz, but these frequencies are not included in the 0.5 to 80 Hz frequency range over which the standards evaluate vibration. Some current research is developing means of predicting discomfort due to combined low frequency translational and rotational oscillation.
At high frequencies, the phase between different directions of vibration is probably unimportant but at frequencies associated with the principal body resonance it seems possible that the phase between vertical and fore-and-aft vibration may influence discomfort [30]. The extent to which this affects the optimisation of vehicle ride and seating dynamics is another area for research.
5.4.4 Location
International Standard 2631:1997 and British Standard 6841:1987 are limited to the measurement, evaluation, and assessment of vibration at the seat, the backrest and the feet. Multiplying factors are given to reflect the sensitivity to vibration in each axis at these three locations (Table 1). Drivers have contact with vibration at the hands and the vibration of steering wheels is considered during vehicle development. A frequency weighting for hand-transmitted vibration is provided in ISO 5349-1:2001 [31] but intended for the prediction of the risks of injury from hand-transmitted vibration. The weighting does not seem optimal for the evaluation of the low levels of vibration that normally occur on steering wheels [7].
Relative motion between different vibration inputs is not considered in current standards, yet such motions (especially between the seat and the feet) can be an important source of vibration discomfort. Although conventional seats have near unity transmissibility and minimal phase lags at low frequencies and therefore only small relative displacements between the seat and the feet, such movement may contribute to vibration discomfort in the area of the thighs. Suspension seats have lower resonance frequencies and larger relative motions that may be significant contributors to discomfort, especially with low magnitudes of motion.
5.4.5 Duration
vibration discomfort, it also affects the prediction of risks of injury from whole-body vibration – conflicting guidance is sometimes offered with different time-dependencies in the same recommendations [31,32]. Until a better understanding is uncovered, it is necessary to make some assumption so that time-varying vibration can be evaluated. Measures based on r.m.s. averaging underestimate the importance of peaks while measures based on peaks underestimate the importance of longer periods of lower magnitude vibration. The r.m.q. provides a compromise between these deficiencies and employs a time-dependence that appears to reflect, very roughly, the time-dependency of discomfort for short-duration vibration. However, averaging methods (such as r.m.s. and r.m.q.) are difficult to apply uniformly when the duration of measurement (and therefore averaging period) influences the evaluation, such as with time-varying motions. A dose measure eliminates the problems of averaging (which can result in lower magnitudes merely by extending the averaging period), and the vibration dose value provides a robust and easy to use measure with a time-dependency that looks plausible for periods from seconds up to a full day (Figure 6). It should not be expected that the vibration dose value is perfect for all motions, but it is more appropriate than r.m.s. measures, its simplicity is attractive, and there is currently no evidence to suggest a measure that is more accurate.
6 Conclusions
The feeling of vibration that gives rise to judgements of vibration discomfort can be predicted using evaluation procedures that take account of human sensitivity to different magnitudes, frequencies, directions, and durations of vibration. Such evaluation methods can assist vehicle optimisation via dynamic modelling before the production of prototypes and the testing and optimisation of prototypes.
The measurement and evaluation of vibration will always provide imperfect predictions of discomfort when discomfort is influenced by factors other than the motion that is being measured and evaluated. This can arise when factors such as noise or seating discomfort influence judgements even when they are not noticed by those judging the vibration. Vibration evaluations may detect changes that are not detectable subjectively, because smaller changes can be detected by measurement and evaluation than by subjective assessment.
24
transport, and the interactions between responses to vibration and other stimuli. As the methods of predicting discomfort are seen to provide useful guidance, greater unification of the methods of measuring, evaluating, and assessing human responses to vibration in the different forms of transport can be expected.
7 References
[1] Griffin, M.J., 1990, Handbook of human vibration. Academic Press, London, ISBN: 0-12-303040-4.
[2] International Organization for Standardization, 2005, Human response to vibration - measuring instrumentation. International Standard, ISO 8041.
[3] British Standards Institution, 1987, Measurement and evaluation of human exposure to whole-body mechanical vibration and repeated shock, British Standard, BS 6841.
[4] International Organization for Standardization, 1997, Mechanical vibration and shock - evaluation of human exposure - to whole-body vibration. Part 1: general requirements. International Standard, ISO 2631-1, Second edition 1997-05-01, Corrected and reprinted 1997-07-15.
[5] Stevens, S.S., 1975, Psychophysics, Introduction to its perceptual, neural and social prospects. John Wiley and Sons, Inc. New York.
[6] Morioka, M. Griffin,M.J., 2006, Magnitude dependence of equivalent comfort contours for fore-and-aft, lateral, and vertical whole-body vibration. Journal of Sound and Vibration 298 (2006) 755-772.
[7] Morioka, M. Griffin,M.J., 2006, Magnitude dependence of equivalent comfort contours for fore-and-aft, lateral and vertical hand-transmitted vibration. Journal of Sound and Vibration 295 (2006) 633-648.
[8] Wyllie, I.H., Griffin, M.J., 2007, Discomfort from sinusoidal oscillation in the roll and lateral axes at frequencies between 0.2 and 1.6 Hz. The Journal of the Acoustical Society of America (awaiting publication).
[9] Griffin, M.J., Whitham, E.M., Parsons, K.C., 1982, Vibration and comfort. I. Translational seat vibration. Ergonomics, 25, (7), 603-630.
[11] Parsons, K.C., Griffin, M.J., Whitham, E.M., 1982, Vibration and comfort. III. Translational vibration of the feet and back. Ergonomics, 25, (8), 705-719.
[12] Griffin, M.J., Parsons, K.C., Whitham, E.M., 1982, Vibration and comfort. IV. Application of experimental results. Ergonomics, 25, (8), 721-739.
[13] Corbridge, C., Griffin, M.J., 1986, Vibration and comfort: vertical and lateral motion in the range 0.5 to 5.0 Hz. Ergonomics, 29, (2), 249-272.
[14] Howarth, H.V.C., Griffin, M.J., 1988, The frequency dependence of subjective reaction to vertical and horizontal whole-body vibration at low magnitudes.. The Journal of the Acoustical Society of America, 83, (4), 1406-1413.
[15] Jang, H.-K., Griffin, M.J., 1999, The effect of phase of differential vertical vibration at the seat and feet on discomfort. Journal of Sound and Vibration, 223, (5), 785-794.
[16] Jang, H.-K., Griffin, M.J., 2000, Effect of phase, frequency, magnitude and posture on discomfort associated with differential vertical vibration at the seat and feet. Journal of Sound and Vibration, 229, (2), 273-286.
[17] Wyllie, I.H., Griffin, M.J., 2007, Discomfort from sinusoidal oscillation in the pitch and fore-and-aft axes at frequencies between 0.2 and 1.6 Hz. (submitted for publication).
[18] Griffin, M.J. Whitham, E.M., 1977, Assessing the discomfort of dual-axis whole-body vibration. Journal of Sound and Vibration, 54,(1), 107-116.
[19] Fairley, T.E., Griffin, M.J., 1988, Predicting the discomfort caused by simultaneous vertical and fore-and-aft whole-body vibration. Journal of Sound and Vibration, 124, (1), 141-156.
26
[24] Ruffell, C.M., Griffin, M.J., 1995, Effect of 1-Hz and 2-Hz transient vertical vibration on discomfort. The Journal of the Acoustical Society of America, 98, (4), 2157-2164.
[25] International Organization for Standardization, 1974, Guide for the evaluation of human exposure to whole-body vibration. International Standard, ISO 2631 (E). [26] Morioka, M., Griffin, M.J., 2000, Difference thresholds for intensity perception of whole-body vertical vibration: effect of frequency and magnitude. The Journal of the Acoustical Society of America, 107, (1), 620-624.
[27] Howarth, H.V.C., Griffin, M.J., 1990, Subjective response to combined noise and vibration: summation and interaction effects. Journal of Sound and Vibration, 143, (3), 443-454.
[28] Ebe, K., Griffin, M.J., 2000, Qualitative models of seat discomfort including static and dynamic factors. Ergonomics, 43, (6), 771-790.
[29] Griffin, M.J., 1978, The evaluation of vehicle vibration and seats. Applied Ergonomics, 9,(1), 15-21.
[30] Matsumoto, Y., Ohdo, K., Saito, T., 2006, Dynamic and subjective responses of seated subjects exposed to simultaneous vertical and fore-and-aft whole-body vibration: The effect of the phase between the two single-axis components. Journal of Sound and Vibration 298 (3), 773-787.
[31] Griffin, M.J., 1998, A comparison of standardized methods for predicting the hazards of whole-body vibration and repeated shocks. Journal of Sound and Vibration, 215, (4), 883-914.
[31] International Organization for Standardization, 2001, Mechanical vibration - measurement and evaluation of human exposure to hand-transmitted vibration - Part 1: General Requirements. International Standard, ISO 5349-1:2001(E).
Table 1
Application of frequency weightings for the evaluation of vibration at the seat, the back and the feet with respect to vibration discomfort [1, 3, 4].Input position
axis frequency
weighting
axis
multiplying factor
seat x Wd 1.0
y Wd 1.0
z Wb 1.0
rx(roll) We 0.63
ry (pitch) We 0.40
rz(yaw) We 0.20
seat back x Wc 0.80
y Wd 0.50
z Wd 0.40
feet x Wb 0.25
y Wb 0.25
28
FIGURE CAPTIONS
1. Axes of vibration used to measure and evaluate exposures to whole-body vibration.
2. Equivalent comfort contours for the frequency of vertical seat vibration from 2 to 100 Hz by Griffin et al. [9] combined with contours over the range 0.5 to 5 Hz obtained by Corbridge and Griffin [13] compared with the frequency-dependence of weighting Wb as defined in BS 6841:1987 [3] and ISO
2631:1997 [4].
3. Equivalent comfort contours for the frequency of vibration when seated (adapted from [6]). The four experimentally determined contours correspond to magnitude estimates of 25, 50, 100, and 200, where a doubling corresponds to doubling discomfort. The frequency weightings are represented by the reciprocal of Wd for fore-and-aft and lateral vibration, and
the reciprocal of Wb for vertical vibration, drawn to coincide with the
experimental contours at 2 and 5 Hz, respectively.
4. Equivalent comfort contours for the frequency of hand-transmitted vibration (adapted from [7]). The four experimentally determined contours correspond to magnitude estimates of 25, 50, 100, and 200, where a doubling corresponds to doubling discomfort. The frequency weightings are represented by the reciprocal of Wh for fore-and-aft, lateral and vertical
vibration, drawn to coincide with the experimental contours at 16 Hz.
5. Equivalent comfort contours for the duration of vertical vibration when seated (adapted from [20]). The two experimentally determined contours correspond to similar degrees of vibration discomfort.
6. Comparison of a2t time-dependency (as in r.m.s.) and a4t time-dependency (as in r.m.q., eVDV and VDV) with discomfort scales (as in BS 6841:1987 and ISO 2631:1997).
7. Acceleration frequency weightings for whole-body vibration and motion sickness as defined in BS 6841:1987 and ISO 2631:1997.
x
s
z
s
y
s
x
f
z
f
y
f
x
b
z
b
y
b
back
ischial
tuberosities
0.5
1
10
100
0.1
1
5
0.5 to 4 Hz: 20 males, 20 females
4 to 100 Hz: 18 males, 18 females
Acceleration ms
-2
r.m.s.
1
10
100
0.01
0.10
1.00
10.00
10
100
10
100
25 50 100 200
Acceleration (ms
-2
r.m.
s.)
Fore-and-aft vibration
50 200
25 100
Threshold
200
100
50
25
Frequency (Hz)
Lateral vibration
50 200
25 100
Threshold
200
100
50
25
Vertical vibration
50 200
25 100
10
100
0.01
0.1
1
10
100
10
100
10
100
200
100
25 50
Acceleration (ms
-2
r.m.s.)
25 50 100 200
25 50 100 200
Frequency (Hz)
Vertical vibration
200 100 50 25
Threshold
Lateral vibration
200 100 50 25
Threshold
Fore-and-aft vibration
200 100 50 25
0.1
1
10
0.2
0.3
0.4
0.5
0.6
0.7
0.8
0.9
1
2
Acceleration (ms
-2
r.m.s.)
Duration (seconds)
0.315 Uncomfortable A little uncomfortable Extremely uncomfortable Very uncomfortable Fairly uncomfortable Not uncomfortable 3.15 2.5 2.0 1.6 1.25 1.0 0.8 0.63 0.5 0.4 0.25 r.m.s. weighted acceleration
(ms )-2