111
Journal of Social and Development SciencesVol. 2, No. 3, pp. 111-120, Sep 2011 (ISSN 2221-1152)
The Uptake of Organic Agriculture: A Decade of Worldwide Development
John Paull
Institute of Social and Cultural Anthropology, University of Oxford [email protected]
Abstract: It has been claimed that organic agriculture is the fastest growing agriculture based industry in the world. The land devoted to organic agriculture worldwide has increased over the past decade from 15.8 million hectares to 37.2 million hectares exhibiting a compounding rate of growth of 8.9% per annum. This paper disaggregates the global growth in organic agriculture land over the past decade using country as the unit of analysis. For each country, two indices of organics sector growth are derived, firstly, the actual hectares increase, and secondly, the hectares-multiplier, that is the factor by which the organic hectares have changed over the decade. Growth over the past decade is presented for 71 countries which taken together account for 35.3 million organic agricultural hectares, that is 94.8% of the total global organic agriculture area and 58.2% of the total global agriculture area. The analysis reveals that, underlying what appears at the global level to be steady incremental growth over the decade, the growth appears very uneven when disaggregated by country. The decadal increase in organic hectares ranges from Australia’s gain of 4.3 million organic hectares and China’s gain of 1.9 million organic hectares through to Costa Rica’s decrease of 1549 organic hectares. Globally, the organic hectares total has multiplied by 2.3 in the decade from 2001 to 2011, but this has varied greatly by country. Uruguay increased its organic hectares dramatically with a hectares-multiplier of 716.1, and India with a multiplier of 689.7. In contrast, Denmark has barely increased with a hectares-multiplier of 1.07, while Suriname exhibited the greatest shrinkage with a multiplier of 0.03. China and India are the only countries that rank in the top ten countries for both of the indices of organics growth, namely, the decadal organic hectares increase and the decadal organic hectares-multiplier.
Keywords: Organic farming; certified organic; global statistics; growth; trend; world map, IFOAM.
1. Introduction
Fritz Haber and Carl Bosch demonstrated an industrial process for ‘fixing’ nitrogen in 1909. The Haber-Bosch process was rapidly adopted and this created a revolution in agriculture by providing farmers with ready access to inexpensive synthetic fertilizers (Paull, 2009; Smil, 2001). Organic agriculture developed as a response to the chemicalization of agriculture. Rudolf Steiner delivered his eight-lecture Agriculture Course in the summer of 1924 at Koberwitz (now Kobierzyce, Poland). The course was an early response to the disquiet at the new directions that agriculture was taking, and it laid the foundations for the development of an alternative agriculture and a differentiated food stream (Paull, 2011a). Steiner’s course of 1924 led to the publication of the influential book Bio-Dynamic Farming and Gardening by Pfeiffer (1938) which appeared simultaneously in English, German, Dutch, French and Italian editions (Paull, 2011b). The following year, Pfeiffer, along with several other leading European biodynamics experts from Switzerland and Holland, led the Betteshanger Summer School on biodynamic farming at the Kent farm of the English agriculturalist Northbourne (Paull, 2011c).
112
The stated vision of IFOAM (2011) is the “Adoption of Organic Agriculture world-wide”. This is an ambitious goal given that the current share of global agricultural land that is managed as organic is reported as just 0.85% (Willer & Kilcher, 2011). At the present rate of uptake such a goal would take decades or hundreds of years to achieve (Paull, 2010b). There is a Punjabi aphorism that invites consideration: “It’s a tree on a riverbank. How long can it survive?” (Purcell, 2007, p.55). It is an observation that life on the edge can be precarious, and it implicitly acknowledges that a retreat from the edge can enhance security. After many decades of advocacy, the organics enterprise remains a liminal phenomenon, accounting for less than one percent of global agricultural land, and yet it surely harbors the potential to retreat from ‘the edge’ and to even realize IFOAM goal of achieving 100% market penetration. The present study sets out to examine the rates of growth of the organic agriculture sector over the past decade using country as the unit of analysis, and in the process to identify which countries are leaders and which are laggards in the uptake of organics.
2. Literature Review
It has been claimed that organic agriculture is the fastest growing agriculture based industry in the world (OFA, 2011). Global data for organic agriculture first appeared in the compilation of Willer & Yussefi (2000). It was a study sponsored by BioFach in collaboration with IFOAM and published by Stiftung Okologie & Landbau. Since the Willer & Yussefi (2000) study, global cross-sectional data have been published annually, with the most recent account being Willer & Kilcher (2011). The existence of such cross-sectional data sets now enables the longitudinal examination of the organics sector.
In the decade 2001 to 2011, the total worldwide organic agricultural hectares has grown by 135% (Willer & Yuseffi, 2001; Willer & Kilcher, 2011), which equates to an 8.9% per annum compound growth over the decade. The 2011 figures report organic agriculture data from 160 countries and a total of 37,232,127 organic agricultural hectares (Willer & Kilcher, 2011). The present study disaggregates the global growth over the past decade to examine the growth on a country by country basis. It addresses issues which are central to IFOAM’s vision, namely, the real and relative growth of land devoted to organic agriculture. The present study examines the uptake, and the speed of uptake, of organic agriculture across the 71 countries for which data spanning the past decade are available.
3. Methodology
The present study uses data from cross-sectional studies of the state of the organic agriculture sector reported in 2001 and 2011 (Willer & Yuseffi, 2001; Willer & Kilcher, 2011). The 2001 data set recorded organic agriculture hectares in 71 countries and the 2011 data set recorded organic agriculture hectares in 160 countries. In each case, the data sets are collations of the latest available statistics, at the time of their publication, for each country where statistics are reported.
Over the decade there have been some changes in two of the reported 71 geo-political entities of the 2001 data set. The 122 organic hectares reported for Hong Kong in 2001 have been added to China’s 2001 total for the purposes of the present analysis. The 8000 organic hectares reported for Yugoslavia in 2001 were distributed between Montenegro (2776 ha.) and Serbia (5224 ha.) on a pro rata basis commensurate with the 2011 data distribution. The redacted 2001 data set thereby still includes 71 countries (i.e. no net change in the total due to the loss of both Hong Kong and Yugoslavia, and the gain of Montenegro and Serbia) and data from each of these resulting 71 entities were available in the 2011 data set. Two parameters were derived, firstly, the organic hectares increase over a decade (this was negative in some cases), and, secondly, the ‘hectares-multiplier’ was derived by taking the 2011/2001 quotient, that is the 2011 hectares statistic divided by the 2001 hectares statistic for each country (so that, for example, a hectares-multiplier of 2.0 means the organic hectares doubled in the decade; a multiplier of 1.00 means no change; and less than 1.00 means the organic hectares declined).
113
figures on the state of organic farming in individual countries” (p.13) and they add that on occasions “Unfortunately our inquiries remained unanswered” (p.13). Willer & Yussefi (2001, p.21) claim that “for those countries for which no statistical material was available, it may be assumed that organic agriculture methods are being practiced”. The 2001 data were reported as “Organic Hectares” (e.g. p.22) without distinguishing whether or not these are, for example, certified organic and/or in-conversion organic. The 2001 data set is stated to be derived from a variety of sources including: “experts from IFOAM member organisations”; “an internet search”; and “a literature search” (p.13). Of the data set published in 2011, the authors state that “Not for all countries 2009 data were available [sic]” (Willer & Kilcher, 2011, p.246) and the data are stated to be from, variously, and depending on the country: 2004; 2005; 2006. 2007; 2008, 2008/2009; Oct 2008-Sept 2009; 2009 [most commonly]; 2009/2010; and June 2010 (Willer & Kilcher, 2011, pp.234-237). Data sources for the 2011 data set are various and are listed (pp.268-286). Willer & Kilcher state the caveat that: “A direct year-to-year comparison is not always possible for many countries as the data sources may have changed over the years or data access becomes better” (p.246). The 2011 data are reported as “organic agricultural land (including in-conversion areas)” (p.29), however Willer & Kilcher state that “some countries provided only data on the fully converted area, others only on the total organically managed agricultural land, and thus the conversion area is not known for many countries” (p.29). Some redactions of previously published data have been published (e.g. p.278). There appear to be no published redactions of the 2001 data set and at the time of the preparation of the present study there were no redactions applicable to the 2011 data points. The 2011 data set of organic agriculture land does not include organic aquaculture, forest and wild collection areas, and for the 2001 data set there was no mention of such areas.
Survey data of the type used here, that is, of mixed provenance, based on the self-reportage of third parties who are not ‘at arms length’, and which is of unknown validity and reliability, is deficient in some important qualities that are desirable in a data set. Survey respondents may under-report for reasons of, for example, ignorance or confidentiality; they may over-report, for example, to intentionally inflate figures, or because an enterprise that is certified organic may be certified by several certifiers to gain access to different markets and thereby may be counted several times in aggregated data. Nevertheless, the deficiencies identified here, of the 2001 and 2011 data sets, are in no way unique to these particular data sets and ought not be taken as a reason for retreating from any analysis. What an awareness of these deficiencies indicates is that conclusions ought to be drawn with caution, and in the event, and to the extent, that the results prove to be ‘interesting’, then they ought to be taken as indicative, rather than definitive, and as an invitation to further research.
4. Results
[image:3.595.72.523.612.756.2]The organic hectares for the 71 countries increased from 15.8 million to 35.3 million organic hectares from 2001 to 2011. The data set for 2011 includes 160 countries accounting for a total of 37.2 million. The additional 89 countries appearing the 2011 data set collectively account for only 1.9 million hectares that is 5.2% of the global organic agriculture hectares. The data for the 71 countries are tabulated alphabetically by country (Table 1), ranked by increase in organic hectares (Table 2), ranked by the hectares-multiplier (Table 3), and a world map presents the hectares growth pictorially (Figure 1).
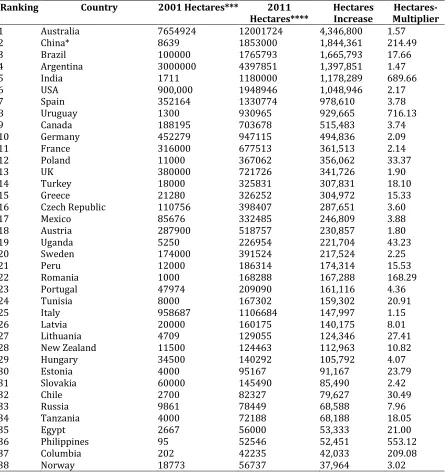
Table 1: Organic agriculture increase and rate of increase (2001-2011) sorted alphabetically by country (* includes Hong Kong; ** Yugoslavia 2001 data distributed to Serbia and Montenegro pro rata; ***Data source: Willer & Yussefi, 2001; ****Data source: Willer & Kilcher, 2011).
Country 2001 Hectares*** 2011 Hectares**** Hectares Increase Hectares-Multiplier
Argentina 3000000 4397851 1,397,851 1.47
Australia 7654924 12001724 4,346,800 1.57
Austria 287900 518757 230,857 1.80
Belgium 18572 41459 22,887 2.23
Bolivia 8000 41004 33,004 5.13
Brazil 100000 1765793 1,665,793 17.66
Cameroon 719 292 -427 0.41
Canada 188195 703678 515,483 3.74
Chile 2700 82327 79,627 30.49
114
Columbia 202 42235 42,033 209.08
Costa Rica 9607 8058 -1,549 0.84
Croatia 120 14194 14,074 118.28
Cyprus 52 3816 3,764 73.38
Czech Republic 110756 398407 287,651 3.60
Denmark 146685 156433 9,748 1.07
Egypt 2667 56000 53,333 21.00
El Salvador 4900 6736 1,836 1.37
Estonia 4000 95167 91,167 23.79
Finland 147423 166171 18,748 1.13
France 316000 677513 361,513 2.14
Georgia 1000 1208 208 1.21
Germany 452279 947115 494,836 2.09
Greece 21280 326252 304,972 15.33
Guatemala 7000 13300 6,300 1.90
Hungary 34500 140292 105,792 4.07
Iceland 2500 6661 4,161 2.66
India 1711 1180000 1,178,289 689.66
Ireland 32478 47864 15,386 1.47
Israel 4223 6969 2,746 1.65
Italy 958687 1106684 147,997 1.15
Japan 5083 8817 3,734 1.73
Korea, Republic of 902 13343 12,441 14.79
Latvia 20000 160175 140,175 8.01
Lebanon 100 3332 3,232 33.32
Liechtenstein 690 1005 315 1.46
Lithuania 4709 129055 124,346 27.41
Luxembourg 1002 3614 2,612 3.61
Malawi 80 994 914 12.43
Mauritius 175 6 -169 0.03
Mexico 85676 332485 246,809 3.88
Montenegro** 2776 4603 1,827 1.66
Netherlands 27820 51911 24,091 1.87
New Zealand 11500 124463 112,963 10.82
Nicaragua 1400 33621 32,221 24.02
Norway 18773 56737 37,964 3.02
Papua New Guinea 4265 3321 -944 0.78
Paraguay 19218 51190 31,972 2.66
Peru 12000 186314 174,314 15.53
Philippines 95 52546 52,451 553.12
Poland 11000 367062 356,062 33.37
Portugal 47974 209090 161,116 4.36
Romania 1000 168288 167,288 168.29
Russia 9861 78449 68,588 7.96
Serbia** 5224 8661 3,437 1.66
Slovakia 60000 145490 85,490 2.42
Slovenia 3000 29388 26,388 9.80
Spain 352164 1330774 978,610 3.78
Sri Lanka 550 21156 20,606 38.47
Suriname 250 8 -242 0.03
Sweden 174000 391524 217,524 2.25
Switzerland 84271 114050 29,779 1.35
Taiwan 1240 2962 1,722 2.39
Tanzania 4000 72188 68,188 18.05
Tunisia 8000 167302 159,302 20.91
Turkey 18000 325831 307,831 18.10
Uganda 5250 226954 221,704 43.23
UK 380000 721726 341,726 1.90
115
USA 900,000 1948946 1,048,946 2.17
Zimbabwe 1000 421 -579 0.42
Total 15812067 35285727 19,473,660 2.23
[image:5.595.77.524.284.759.2]Australia began and finished the decade with the greatest number of hectares, it also ranked number one with an increase of 1.4 million hectares (Table 2) and it accounted for 22.3% of the decadal increase for the data set. Seven countries account for almost two thirds (64.0%) of the decadal increase. The data set conforms to the 80/20 Pareto Principle (Pareto, 1906) with 81.0% of the decadal increase accounted for by the top 20% of countries (i.e. the top fourteen countries). The second 20% of countries accounted for 13.8% of the increase; the third 20% for 4.2%; the fourth 20% for 1.0%; and the final 20% for just 0.06% of the decadal increase (Table 2). Countries leading on the basis of increased hectares are diverse - geographically, economically, culturally, and linguistically - and this diversity is a healthy sign for the organics sector. The top ten countries based on the organic hectares increase are regionally diverse coming from: South America (N=3); Asia (N=2); Europe (N=2); North America (N=2); and Oceania (N=1) (Table 2).
Table 2: Countries ranked by organic hectares increase (2001 to 2011) (* includes Hong Kong; ** Yugoslavia 2001 data distributed to Serbia and Montenegro pro rata; ***Data source: Willer & Yussefi, 2001; ****Data source: Willer & Kilcher, 2011).
Ranking Country 2001 Hectares*** 2011
Hectares**** Hectares Increase Multiplier
Hectares-1 Australia 7654924 12001724 4,346,800 1.57
2 China* 8639 1853000 1,844,361 214.49
3 Brazil 100000 1765793 1,665,793 17.66
4 Argentina 3000000 4397851 1,397,851 1.47
5 India 1711 1180000 1,178,289 689.66
6 USA 900,000 1948946 1,048,946 2.17
7 Spain 352164 1330774 978,610 3.78
8 Uruguay 1300 930965 929,665 716.13
9 Canada 188195 703678 515,483 3.74
10 Germany 452279 947115 494,836 2.09
11 France 316000 677513 361,513 2.14
12 Poland 11000 367062 356,062 33.37
13 UK 380000 721726 341,726 1.90
14 Turkey 18000 325831 307,831 18.10
15 Greece 21280 326252 304,972 15.33
16 Czech Republic 110756 398407 287,651 3.60
17 Mexico 85676 332485 246,809 3.88
18 Austria 287900 518757 230,857 1.80
19 Uganda 5250 226954 221,704 43.23
20 Sweden 174000 391524 217,524 2.25
21 Peru 12000 186314 174,314 15.53
22 Romania 1000 168288 167,288 168.29
23 Portugal 47974 209090 161,116 4.36
24 Tunisia 8000 167302 159,302 20.91
25 Italy 958687 1106684 147,997 1.15
26 Latvia 20000 160175 140,175 8.01
27 Lithuania 4709 129055 124,346 27.41
28 New Zealand 11500 124463 112,963 10.82
29 Hungary 34500 140292 105,792 4.07
30 Estonia 4000 95167 91,167 23.79
31 Slovakia 60000 145490 85,490 2.42
32 Chile 2700 82327 79,627 30.49
33 Russia 9861 78449 68,588 7.96
34 Tanzania 4000 72188 68,188 18.05
35 Egypt 2667 56000 53,333 21.00
36 Philippines 95 52546 52,451 553.12
37 Columbia 202 42235 42,033 209.08
116
39 Bolivia 8000 41004 33,004 5.13
40 Nicaragua 1400 33621 32,221 24.02
41 Paraguay 19218 51190 31,972 2.66
42 Switzerland 84271 114050 29,779 1.35
43 Slovenia 3000 29388 26,388 9.80
44 Netherlands 27820 51911 24,091 1.87
45 Belgium 18572 41459 22,887 2.23
46 Sri Lanka 550 21156 20,606 38.47
47 Finland 147423 166171 18,748 1.13
48 Ireland 32478 47864 15,386 1.47
49 Croatia 120 14194 14,074 118.28
50 Korea, Republic of 902 13343 12,441 14.79
51 Denmark 146685 156433 9,748 1.07
52 Guatemala 7000 13300 6,300 1.90
53 Iceland 2500 6661 4,161 2.66
54 Cyprus 52 3816 3,764 73.38
55 Japan 5083 8817 3,734 1.73
56 Serbia** 5224 8661 3,437 1.66
57 Lebanon 100 3332 3,232 33.32
58 Israel 4223 6969 2,746 1.65
59 Luxembourg 1002 3614 2,612 3.61
60 El Salvador 4900 6736 1,836 1.37
61 Montenegro** 2776 4603 1,827 1.66
62 Taiwan 1240 2962 1,722 2.39
63 Malawi 80 994 914 12.43
64 Liechtenstein 690 1005 315 1.46
65 Georgia 1000 1208 208 1.21
66 Mauritius 175 6 -169 0.03
67 Suriname 250 8 -242 0.03
68 Cameroon 719 292 -427 0.41
69 Zimbabwe 1000 421 -579 0.42
70 Papua New Guinea 4265 3321 -944 0.78
71 Costa Rica 9607 8058 -1,549 0.84
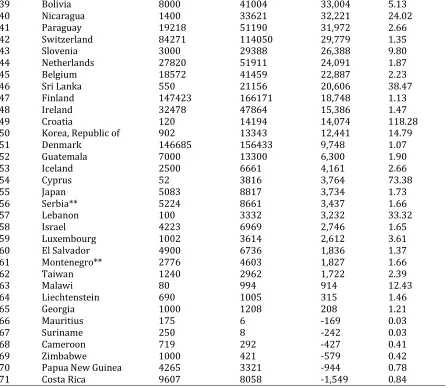
A second way of looking at the decade’s growth in organic agricultural hectares is to examine the multiplier (the 2011 organic hectares divided by the 2001 hectares) (Table 3). The hectares-multiplier for the set of 71 countries was 2.23 that is an overall increase of 123%. The hectares-hectares-multiplier per country was highly variable ranging from a maximum multiplier of 716.13 for Uruguay, which is a massive relative increase, to a low of 0.03 for Suriname, which is a substantial shrinkage (Table 3). The top ten countries based on the organic hectares-multiplier are regionally diverse coming from: Asia (N=4); Europe (N=3); South America (N=2); and Africa (N=1) (Table 3). Seven countries registered triple digit growth, increasing their organic hectares by more than one hundred fold, and led by Uruguay, followed by India with a multiplier of 689, and the Philippines with a multiplier of 553. Nineteen countries registered double-digit growth, with from a ten-fold up to a hundred-fold expansion of their organic hectares. Cyprus with a multiplier of 73 and Uganda with a multiplier of 43 led this second block.
[image:6.595.76.524.75.463.2]A block of twenty countries registered single-digit growth, with a multiplier of two up to 10. Some countries, that otherwise exhibit organic agriculture leadership (Table 2), exhibited less than a doubling of their organic hectares over the decade (Table 3). Australia, despite registering a big net increase in organic hectares (Table 2), falls into this category of tardy relative increasers, exhibiting a 57% increase which is less than the average (and which takes its organic share of its total agricultural land from 1.83% to 2.88%, and offers plenty of scope for further growth). Netherlands, Austria, Italy and Denmark also appear in this below average performers - based on the hectares-multiplier index. Six countries recorded a shrinkage of organic hectares over the decade; each of those began with a low area and each of those six started (and finished) the decade with below 10,000 organic hectares (Table 3).
117
Ranking Country 2001
Hectares*** Hectares**** 2011 Hectares Increase Multiplier
Hectares-1 Uruguay 1300 930965 929,665 716.13
2 India 1711 1180000 1,178,289 689.66
3 Philippines 95 52546 52,451 553.12
4 China* 8639 1853000 1,844,361 214.49
5 Columbia 202 42235 42,033 209.08
6 Romania 1000 168288 167,288 168.29
7 Croatia 120 14194 14,074 118.28
8 Cyprus 52 3816 3,764 73.38
9 Uganda 5250 226954 221,704 43.23
10 Sri Lanka 550 21156 20,606 38.47
11 Poland 11000 367062 356,062 33.37
12 Lebanon 100 3332 3,232 33.32
13 Chile 2700 82327 79,627 30.49
14 Lithuania 4709 129055 124,346 27.41
15 Nicaragua 1400 33621 32,221 24.02
16 Estonia 4000 95167 91,167 23.79
17 Egypt 2667 56000 53,333 21.00
18 Tunisia 8000 167302 159,302 20.91
19 Turkey 18000 325831 307,831 18.10
20 Tanzania 4000 72188 68,188 18.05
21 Brazil 100000 1765793 1,665,793 17.66
22 Peru 12000 186314 174,314 15.53
23 Greece 21280 326252 304,972 15.33
24 Korea 902 13343 12,441 14.79
25 Malawi 80 994 914 12.43
26 New Zealand 11500 124463 112,963 10.82
27 Slovenia 3000 29388 26,388 9.80
28 Latvia 20000 160175 140,175 8.01
29 Russia 9861 78449 68,588 7.96
30 Bolivia 8000 41004 33,004 5.13
31 Portugal 47974 209090 161,116 4.36
32 Hungary 34500 140292 105,792 4.07
33 Mexico 85676 332485 246,809 3.88
34 Spain 352164 1330774 978,610 3.78
35 Canada 188195 703678 515,483 3.74
36 Luxembourg 1002 3614 2,612 3.61
37 Czech Republic 110756 398407 287,651 3.60
38 Norway 18773 56737 37,964 3.02
39 Iceland 2500 6661 4,161 2.66
40 Paraguay 19218 51190 31,972 2.66
41 Slovakia 60000 145490 85,490 2.42
42 Taiwan 1240 2962 1,722 2.39
43 Sweden 174000 391524 217,524 2.25
44 Belgium 18572 41459 22,887 2.23
* Total 15812067 35285727 19,473,660 2.23
45 USA 900,000 1948946 1,048,946 2.17
46 France 316000 677513 361,513 2.14
47 Germany 452279 947115 494,836 2.09
48 Guatemala 7000 13300 6,300 1.90
49 UK 380000 721726 341,726 1.90
50 Netherlands 27820 51911 24,091 1.87
51 Austria 287900 518757 230,857 1.80
52 Japan 5083 8817 3,734 1.73
53 Montenegro** 2776 4603 1,827 1.66
54 Serbia** 5224 8661 3,437 1.66
118
56 Australia 7654924 12001724 4,346,800 1.57
57 Ireland 32478 47864 15,386 1.47
58 Argentina 3000000 4397851 1,397,851 1.47
59 Liechtenstein 690 1005 315 1.46
60 El Salvador 4900 6736 1,836 1.37
61 Switzerland 84271 114050 29,779 1.35
62 Georgia 1000 1208 208 1.21
63 Italy 958687 1106684 147,997 1.15
64 Finland 147423 166171 18,748 1.13
65 Denmark 146685 156433 9,748 1.07
66 Costa Rica 9607 8058 -1,549 0.84
67 Papua New Guinea 4265 3321 -944 0.78
68 Zimbabwe 1000 421 -579 0.42
69 Cameroon 719 292 -427 0.41
70 Mauritius 175 6 -169 0.03
71 Suriname 250 8 -242 0.03
A world map (Fig. 1) visually presents the growth rate of organic agriculture over the decade (2001-2011). Countries exhibiting triple digit, double digit, and single digit growth that is above the average (of 2.23) appear as warm colours - red, orange and yellow respectively. Countries that exhibit a growth rate below average appear as green, while countries that exhibit shrinkage appear as blue. Countries that appear uncoloured did not report organic hectares in 2001, and collectively they account for just 5.2% of the 2011 organic hectares, and they are not a part of the present analysis.
Figure 1: World map of organic agriculture growth rates for 71 countries over a decade (2001-2011). Triple digit growth = ▲ (red); Double digit growth =▲ (orange); Single digit growth (above average) =▲, (yellow); Single digit growth (below average) =▲ (green); Negative growth =▲ (blue).
5. Discussion and Conclusion
[image:8.595.70.527.398.684.2]119
ought to be a cause for concern is that the 71 countries, being 100% of the 2001 data set, still account for 94.8% of the total global organic agricultural hectares a decade later in the 2011 data set. By way of contrast, the 89 ‘newcomer’ countries account for only 5.2% of the total global organic agricultural hectares in 2011. To put this in context, the 71 countries which account for 94.8% of global organic hectares, together account for only 58.2% of the global agriculture land (with 28,380,066 km2,compared
to the global total of 48,770,080 km2; 1km2 = 100 hectares)(World Bank, 2011).
Most of the new growth in organic hectares of the past decade has come from the counties already within the organics ‘family’ of 2001 (accounting for 90.9% of the 21,420,060 hectares growth), whereas the growth outside of the family of 2001, has been wide but shallow (with the 89 newcomer countries accounting for just 9.1% of the organic hectares growth). From an advocacy point of view, this underscores the opportunity for organics adoption and growth amongst the 124 countries (of which 89 contributed organics data) which account for 41.8% of the world’s agricultural land (World Bank, 2011) but a disproportionately small 5.2% of the world’s organic agriculture land.
The great diversity within the 71 countries of the present study demonstrates that the organics project is a phenomenon capable of breaching barriers of politics, geography, language and culture. The increase over the past decade of 8.9% compounding annual growth indicates a vibrant uptake. However underlying this impressive and continuing growth, there are great differences between the uptake trajectories of individual countries in terms of both the size and the speed of their growth as measured by the two indices of the present study. In some countries, notably some in the European Union, organic agriculture has attracted considerable government support (EC, 2010; Schwarz, Nieberg & Sanders, 2010), while in others, such as Australia, there has been little government support forthcoming, and in the UK there is the call for the government to emulate the support offered in continental Europe (SA, 2011).
India and China stand alone in appearing in the top ten countries in terms of both the organic hectares increase (Table 2) and the organic hectares-multiplier (Table 3). Both of these countries are bullish regarding organics, expressing sentiments and ambitions for the expansion of their regional and national organics sectors (Chamling, 2010; Paull, 2007). Both India and China have the capacity for substantial and rapid increases with currently just 0.66% of India’s, and 0.35% of China’s agricultural land managed organically (Willer & Kilcher, 2011; World Bank, 2011).
There are many ways to measure leadership in the the field of organic agriculture, for example, the Organics Olympiad nominates 12 indices of leadership (Paull, 2011d). The present analysis can be used as an indicator of where future research efforts may be directed to understand the dynamics within those countries that have achieved big increases (Table 2) or fast increases (Table 3) or both. It also highlights the stagnation in some countries, and the reversals of a few, and hence where such lessons may perhaps be most usefully applied. There is the potential to expand the scope of this study by examining the data of additional years and parameters.
If IFOAM’s vision of taking organic agriculture beyond a niche agricultural sector (IFOAM, 2008, 2011; Paull, 2010b), and in particular beyond a 1% solution, is to be achieved then further research is called for to understand the multifactorial dynamics of organics growth and the interplay of impacting factors, including government support, availability of technical know-how, consumer awareness, access to markets, price premiums, the maintenance of environmental integrity including the avoidance of GM pollen and chemical spray drift, marketing support, and consumer demand.
120
Acknowledgements: The important continuing project by FiBL and IFOAM of compiling annual global statistics of the organics sector and the GIS mapping software of Sankakukei.net, Osaka, are acknowledged.
References
Chamling, P. (2010). Sikkim Organic Mission 2015. Gangtok, India: Food Security & Agriculture Development Department, Government of Sikkim.
EC. (2010). An Analysis of the EU Organic Sector. Brussels: Directorate-General for Agriculture and Rural Development, European Commission (EC).
IFOAM (2008). IFOAM Program 2008. Bonn: International Federation of Organic Agriculture Movements (IFOAM).
IFOAM (2011). Summary Strategic Plan. Bonn: International Federation of Organic Agriculture Movements (IFOAM).
Northbourne, L. (1940). Look to the Land. London: Dent.
OFA. (2011). Organic-The fastest growing agricultural based industry in the world. OFA Organic Update, August.
Pareto, V. (1906). Manuale Di Economia Politica Con Una Introduzione Alla Scienza Sociale (1994 edition). Pordenone, Italy: Edizioni Studio Tesi.
Paull, J. (2007). China's organic revolution. Journal of Organic Systems, 2(1), 1-11.
Paull, J. (2008). The lost history of organic farming in Australia. Journal of Organic Systems, 3(2), 2-17. Paull, J. (2009). A century of synthetic fertilizer: 1909-2009. Journal of Bio-Dynamics Tasmania, (94),
16-21.
Paull, J. (2010a). From France to the World: The International Federation of Organic Agriculture Movements (IFOAM). Journal of Social Research & Policy, 1(2), 93-102.
Paull, J. (2010b). The future of organic agriculture: Otopia or oblivion? Innovative Science Editions, 1, 11-14.
Paull, J. (2011a). Attending the first organic agriculture course: Rudolf Steiner’s Agriculture Course at Koberwitz, 1924. European Journal of Social Sciences, 21(1), 64-70.
Paull, J. (2011b). Biodynamic Agriculture: The journey from Koberwitz to the World, 1924-1938. Journal of Organic Systems, 6(1), 27-41.
Paull, J. (2011c). The Betteshanger Summer School: Missing link between biodynamic agriculture and organic farming. Journal of Oganic Systems, 6(2): 13-26.
Paull, J. (2011d). Organics Olympiad 2011: Global indices of leadership in organic agriculture. Journal of Social and Development Sciences, 1(4), 144-150.
Pfeiffer, E. (1938). Bio-Dynamic Farming and Gardening: Soil Fertility Renewal and Preservation (F. Heckel, Trans.). New York: Anthroposophic Press.
Purcell, L. (2007). Trees, A Photographic Celebration. New York: Metro Books.
Rodale, J. I. (Ed.). (1942). Organic Farming and Gardening. Emmaus Pennsylvania: Rodale Press, 1(1), 1-16. Schwarz, G., Nieberg, H.
-Institut.
Smil, V. (2001). Enriching the Earth: Fritz Haber, Carl Bosch, and the Transformation of World Food Production. Cambridge, USA: The MIT Press.
Waitley, D. (2009). The Psychology of Success (5th edn.). New York: McGraw-Hill Higher Education. Willer, H. & Kilcher, L. (Eds.). (2011). The World of Organic Agriculture: Statistics and Emerging Trends
2011: Bonn: International Federation of Organic Agriculture Movements (IFOAM); Frick, Switzerland: Research Institute of Organic Agriculture (FiBL).
Willer, H. & Yussefi, M. (Eds.). (2000). Organic Agriculture World-Wide: Statistics and Perspectives. Bad Durkheim, Germany: Stiftung Ökologie & Landbau (SÖL).
Willer, H. & Yussefi, M. (Eds.). (2001). Organic Agriculture Worldwide 2001: Statistics and Future Prospects. Bad Durkheim, Germany: Stiftung Ökologie & Landbau (SÖL).